Climate Science Glossary

Term Lookup

Enter a term in the search box to find its definition.

Settings

Use the controls in the far right panel to increase or decrease the number of terms automatically displayed (or to completely turn that feature off).

Term Lookup

Settings


All IPCC definitions taken from Climate Change 2007: The Physical Science Basis. Working Group I Contribution to the Fourth Assessment Report of the Intergovernmental Panel on Climate Change, Annex I, Glossary, pp. 941-954. Cambridge University Press.

Home Arguments Software Resources Comments The Consensus Project Translations About Support

Twitter Facebook YouTube Mastodon MeWe

RSS Posts RSS Comments Email Subscribe


Climate's changed before
It's the sun
It's not bad
There is no consensus
It's cooling
Models are unreliable
Temp record is unreliable
Animals and plants can adapt
It hasn't warmed since 1998
Antarctica is gaining ice
View All Arguments...


Username
Password
New? Register here
Forgot your password?

Latest Posts

Archives

What does past climate change tell us about global warming?

What the science says...

Select a level... Basic Intermediate

Previous climates can be explained by natural causes, while current climate change can only be explained by an excess of CO2 released by human fossil fuel burning. Records of past climates indicate that change happened on time scales of thousands to millions of years. The global rise in temperature that has occurred over the past 150 years is unprecedented and has our fingerprints all over it.

Climate Myth...

Climate's changed before

Climate is always changing. We have had ice ages and warmer periods when alligators were found in Spitzbergen. Ice ages have occurred in a hundred thousand year cycle for the last 700 thousand years, and there have been previous periods that appear to have been warmer than the present despite CO2 levels being lower than they are now. More recently, we have had the medieval warm period and the little ice age. (Richard Lindzen)

The total rate of global warming observed since the industrial revolution can only be explained by the observed excess of CO2 in the atmosphere. The excess of CO2 can only be explained via human sources. Let us first examine the post-industrial revolution warming and some of the telltale signs that humans are responsible.

The human fingerprint

How can we be sure that humanity’s release of greenhouse gases are to blame for the observed rise in global temperature? First, let’s look at evidence showing that greenhouse gases are causing the current warming. Then we will explore how we know that the recent increase in greenhouse gases is due to human activity.

Greenhouse gases like CO2 are understood quite well, so we can make predictions about what we should observe. When CO2 is added to the atmosphere, it causes the lower atmosphere (aka the troposphere where we live and experience its weather) to warm. This warming occurs because the added CO2 traps infrared heat emitted from the Earth's warm surface - heat that would otherwise escape to space. However, in the stratosphere, above the troposphere, adding CO2 to the atmosphere causes it to cool. This is because the extra CO2 in the stratosphere radiates more heat to space. The stratosphere has been cooling in recent decades, as atmospheric CO2 increases. This also rules out the sun, as an increase in solar energy would heat the whole atmosphere.

Another example, predicted by Arrhenius in 1896, states that winters should warm more than summers. Hemispheres receive less sunlight in winter and cool down by radiating energy away into space. If greenhouse gases were increased, they would act to prevent some of that energy from radiating away, thus warming the winter hemisphere. The warming effect on winter was predicted to be greater than that of summer. Again, this is observed.

It is also possible to use statistical techniques, like detection and attribution studies, to compare the relative contributions of various factors (such as greenhouse gases, aerosols, etc.) towards the recent global warming trend. These too show that the recent global warming trend cannot be explained without the additional greenhouse gases humans have released into the atmosphere.

Given that the warming is caused by greenhouse gases, how do we know that human CO2 emissions are specifically to blame for their sudden increase? This too can be quantified.

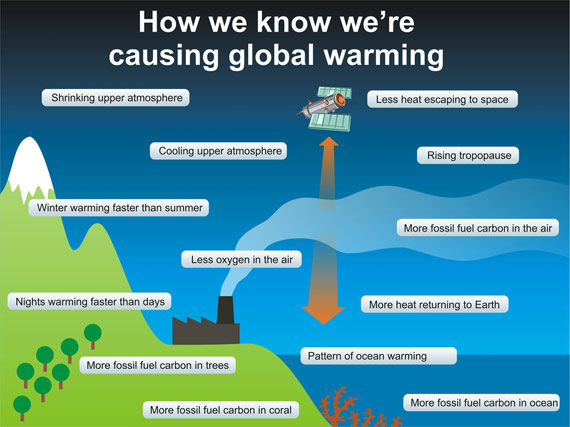
Figure 1. Examples of human fingerprints on global warming. Source

We have accurate estimates of how much CO2 we release each year, and we also have a good understanding of the natural annual variability of CO2. Although the land and ocean are absorbing CO2 all the time, it is not enough to prevent the increase of atmospheric CO2. There is currently more CO2 being put into the atmosphere annually than natural processes can remove. One way to observe the ocean absorption of CO2 is by the increasing acidification of ocean water.

Additionally, the average atomic weight of atmospheric CO2 is observed to be decreasing. The carbon atom in CO2 can have different amounts of neutrons in its nucleus, a difference we can measure. Of the three main reservoirs of CO2—plants, water, and air—plants have a detectably lighter average weight of CO2. This indicates that much of the atmospheric CO2 is coming from a plant based source. Fossil fuels, the primary source of greenhouse gas emissions, are made of fossil plants, and therefore contain the lighter average atomic weight of CO2.

There are other examples of human fingerprints, like the depletion of atmospheric oxygen due to combustion or nights warming faster than days, which confirm our scientific understanding. The planet is warming unnaturally fast, and the only explanation is the excess release of greenhouse gases like CO2 by humans.

The myth commits the single cause fallacy

Now let’s take a closer look at the myth. The myth that current climate change is natural because past climate changed naturally makes an implicit, and incorrect, assumption. It assumes that because the climate has changed from natural causes before, it can only be changing from natural causes now. This is committing what is known as the single cause fallacy. As the name suggests, this is when a phenomenon is falsely attributed to a single cause, even though other causes are possible. It would be similar to saying that smoking cannot cause cancer because people were getting cancer before cigarettes were invented. In the following sections we will look at different examples of past climates commonly used in the myth.

Previous warm climates and energy balance

One version of this myth compares current climate to past periods where CO2 levels were comparable but temperatures were different - this is meant to sow doubt about the legitimacy of CO2 as a driver of climate change. However, this discrepancy can be explained by the process of energy balance.

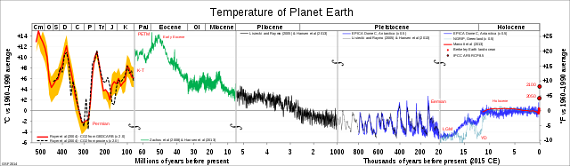
Figure 2. Global average temperature relative to 1960-1990 average in degrees Celsius (Larger Image).

Figure 2 shows that there were only a few periods in the past million years that briefly had temperatures warmer than today (those are related to orbital changes, which will be discussed later). However, if we want a period with sustained temperatures warmer than today, we need to go back at least three million years. This period, the Pliocene, had CO2 levels comparable to today’s at around 400 parts per million (ppm), yet had average global temperatures approximately 1.8°C - 3.6°C warmer than today. It may seem odd that a similar CO2 amount would be so much warmer. This reflects the concept of energy balance.

The average temperature of Earth is dependent on the balance between incoming and outgoing energy in the form of radiation. Energy comes in from the sun, and energy leaves when the surface radiates it back into space. If the incoming and outgoing radiation are equal, the global temperature will remain the same. If either the incoming or outgoing radiation amount changes, the temperature of Earth will slowly increase (net energy in) or decrease (net energy out) until a new balance is reached. So-called “greenhouse gases” - like CO2 - trap radiation on Earth, reducing the amount of outgoing radiation. If we reduce the energy out, while the energy coming in has not changed, there is now more energy coming in than going out. In order to reach a new balance, the planet must heat up until it is radiating enough energy out to restore balance.

The process of achieving energy balance of the coupled ocean-atmosphere system takes roughly a few thousand years. So how was the Pliocene warmer than today if it had a similar CO2 level? When we look at temperature records reflecting thousands or millions of years, we are looking at values which represent an Earth in energy balance. Right now, the CO2 in our atmosphere has increased more than 40% in just over 100 years. We are still out of balance and will need many hundreds or thousands of years to get back to balance via an increase in global temperature. This means that even if CO2 stopped rising right now, we have already locked in gradual warming for hundreds of years as the oceans slowly warm.

Ice ages and Earth’s orbit

The up and down temperature patterns seen from the present to about one million years ago in Figure 2 represent what are known as the ice ages. Graphs like these are used in support of the myth; proof that the climate is always changing. Their regular intervals are explained by regular changes in Earth’s orbit, known as Milankovitch cycles. When the orbit changes so that the Earth is receiving significantly less energy from the sun during summer in the northern hemisphere, the polar ice caps expand towards the equator, cooling the planet. Cooler oceans can hold more dissolved gas, so some of the CO2 that was in the atmosphere moves into the ocean. This helps cool the planet further as greenhouse gases are removed from the atmosphere. When the orbit begins changing back, the opposite happens. This relationship is clear when looking at the ice core data in Figure 3.

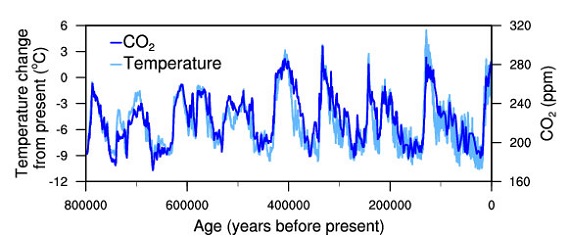
Figure 3. Temperature change (light blue) and carbon dioxide change (dark blue) measured from the EPICA Dome C ice core in Antarctica (Jouzel et al. 2007; Lüthi et al. 2008). The 0 on the x-axis corresponds to 1813 (NOAA).

Figure 3 contains data from the past 800,000 years, but stops at the year 1813, before the Industrial Revolution. Without looking at data from the past 150 years, it appears that we are currently at the peak of the latest cycle and should expect the global temperature and CO2 levels to plateau or begin to fall. However, if we zoom in on the past 10,000 years and include modern data, as in Figure 4, we see CO2 gradually rising about 10-15 ppm before suddenly spiking in the last 150 years. Look again at Figure 3 and be sure to note the scales of both the time and CO2 changes. The largest changes in CO2, going from about 200 ppm to 300 ppm, all take upward of 10,000 years. In Figure 4, we see a change from about 280 ppm all the way up to 410 ppm occur in less than 200 years. Both the size and the speed of the modern change in CO2 is totally unprecedented in at least the past 800,000 years!

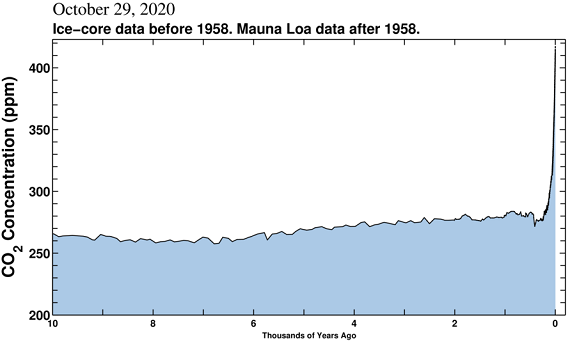
Figure 4. Atmospheric CO2 concentration taken from ice-core data over the past 10,000 years. (Scripps Institution of Oceanography)

Medieval Warm Period and Little Ice Age

Around the years 950-1200 CE, temperature reconstructions show that parts of the Northern hemisphere experienced moderate warming, often referred to as the Medieval Warm Period (MWP) or the Medieval Climate Anomaly (MCA). From roughly 1450-1850 CE, both hemispheres experienced moderate cooling. This became known as the Little Ice Age (LIA). Although these periods are sometimes characterized as proof that modern climate change is a natural fluctuation, that claim is difficult to support. The exact amount, timing and cause of the temperature changes are not agreed upon. Simulations with varying solar intensity and volcanic forcing seem to replicate some of the changes, but are not conclusive. On the contrary, the temperature changes since the industrial revolution are known quite well, along with the solar and volcanic forcings. Those forcings can confidently be rejected as causes for the observed increase in temperature in the past 150 years. The MCA and LIA are examples of natural climate variability, and they do not conflict with our understanding of modern climate change.

Conclusion

To summarize, none of the mechanisms which facilitated previous climate change can explain the rapid rise in both CO2 and temperature observed over the past 150 years. However, human-released CO2 explains both!

Last updated on 13 November 2020 by ScottKnapp. View Archives

Printable Version  |  Offline PDF Version  |  Link to this page

Argument Feedback

Please use this form to let us know about suggested updates to this rebuttal.

Related Arguments

Myth Deconstruction

Related resource: Myth Deconstruction as animated GIF

MD Past

Please check the related blog post for background information about this graphics resource.

Further reading

RealClimate article published by Prof. Stefan Rahmstorf on July 20, 2017:

The climate has always changed. What do you conclude?

Comments

1  2  3  4  5  6  7  8  9  10  11  12  13  14  15  16  17  18  19  20  Next

Comments 1 to 25 out of 897:

  1. Thanks for trying to answer science with science. Most sites on the subject are propaganda vs science or propaganda vs propaganda.
  2. A change or two in climate history has recently been revealed indicating change happens faster than thought: Fossils Found In Tibet Revise History Of Elevation, Climate ScienceDaily (June 12, 2008) — About 15,000 feet up on Tibet's desolate Himalayan-Tibetan Plateau, an international research team led by Florida State University geologist Yang Wang was surprised to find thick layers of ancient lake sediment filled with plant, fish and animal fossils typical of far lower elevations and warmer, wetter climates. Greenland Ice Core Analysis Shows Drastic Climate Change Near End Of Last Ice Age ScienceDaily (June 19, 2008) — Information gleaned from a Greenland ice core by an international science team shows that two huge Northern Hemisphere temperature spikes prior to the close of the last ice age some 11,500 years ago were tied to fundamental shifts in atmospheric circulation.
    Response: This would indicate that climate is more sensitive than realised which means the climate response to CO2 forcing will be greater than current estimations.
  3. Very interesting read here...haven't heard anything about water vapour feedback yet. Enlighten me if what i say is wrong but are the IPCC models flawed in that their water vapour feedback element is missing out on a rather unavoidable factor in gravity. Douglas Hoyt discusses here http://www.warwickhughes.com/hoyt/wvfeedback.htm about how overestimated the water vapour feedback is in the IPCC models. I take the side of the devil's advocate and say that it seems the IPCC has jumped on a bandwagon and is trying to make it work their way...but it isn't.
  4. That's a very odd notion. Odd in two respects. First the enhanced atmospheric water vapour that follows enhanced greenhouse atmospheric warming has been directly measured [*] and some of the consequences with respect to surface humidity and precipitation patterns are already identified in the real world [**]. Secondly, because the "gravity" notion raised in the dodgy website you linked to is a nonsense. Water vapor that partitions in the atmosphere does so according to atmospheric pressure and temperature. As the temperature of the atmosphere rises so does the water vapour concentration. Is this effect countered by gravity? Not to any significant degree. Atmospheric water exists in the atmosphere in the form of individual water molecules. The gravitational force acting on these molecules is extremely small and is opposed by the kinetic energy of the water molecules provided by the ambient thermal energy. It's only if the atmosphere cools a bit and the water vapour concentration rises above the saturation point, that gravity takes a significant macroscopic hold. Then water molecules "aggregate", the water vapour condenses, and gravity then has an effect (it rains!). So not only is the website trying to sell a ludicrous notion, but it's premise is contradicted by real world measurements (see [*] and [**] below. [*] e.g.: Soden BJ et al. (2005) "The radiative signature of upper tropospheric moistening" Science 310, 841-844. Abstract: "Climate models predict that the concentration of water vapor in the upper troposphere could double by the end of the century as a result of increases in greenhouse gases. Such moistening plays a key role in amplifying the rate at which the climate warms in response to anthropogenic activities, but has been difficult to detect because of deficiencies in conventional observing systems. We use satellite measurements to highlight a distinct radiative signature of upper tropospheric moistening over the period 1982 to 2004. The observed moistening is accurately captured by climate model simulations and lends further credence to model projections of future global warming." Santer BD et al (2007) "Identification of human-induced changes in atmospheric moisture content" Proc. Natl. Acad. Sci. USA 104 15248-15253. Abstract: "Data from the satellite-based Special Sensor Microwave Imager (SSM/I) show that the total atmospheric moisture content over oceans has increased by 0.41 kg/m(2) per decade since 1988. Results from current climate models indicate that water vapor increases of this magnitude cannot be explained by climate noise alone. In a formal detection and attribution analysis using the pooled results from 22 different climate models, the simulated "fingerprint" pattern of anthropogenically caused changes in water vapor is identifiable with high statistical confidence in the SSM/I data. Experiments in which forcing factors are varied individually suggest that this fingerprint "match" is primarily due to human caused increases in greenhouse gases and not to solar forcing or recovery from the eruption of Mount Pinatubo. Our findings provide preliminary evidence of an emerging anthropogenic signal in the moisture content of earth's atmosphere." Rind D et al (1991) "Positive Water-Vapor Feedback In Climate Models Confirmed By Satellite Data" Nature 349, 500-503. Abstract: "Chief among the mechanisms thought to amplify the global climate response to increased concentrations of trace gases is the atmospheric water vapour feedback. As the oceans and atmosphere warm, there is increased evaporation, and it has been generally thought that the additional moisture then adds to the greenhouse effect by trapping more infrared radiation. Recently, it has been suggested that general circulation models used for evaluating climate change overestimate this response, and that increased convection in a warmer climate would actually dry the middle and upper troposphere by means of associated compensatory subsidence1. We use some new satellite-generated water vapour data to investigate this question. From a comparison of summer and winter moisture values in regions of the middle and upper troposphere that have previously been difficult to observe with confidence, we find that, as the hemispheres warm, increased convection leads to increased water vapour above 500 mbar in approximate quantitative agreement with the results from current climate models. The same conclusion is reached by comparing the tropical western and eastern Pacific regions. Thus, we conclude that the water vapour feedback is not overestimated in models and should amplify the climate response to increased trace-gas concentrations." [**] e.g.: Zhang XB (2007) "Detection of human influence on twentieth-century precipitation trends" Nature 448, 461-465. Abstract: "Human influence on climate has been detected in surface air temperature(1-5), sea level pressure(6), free atmospheric temperature(7), tropopause height(8) and ocean heat content(9). Human-induced changes have not, however, previously been detected in precipitation at the global scale(10-12), partly because changes in precipitation in different regions cancel each other out and thereby reduce the strength of the global average signal(13-19). Models suggest that anthropogenic forcing should have caused a small increase in global mean precipitation and a latitudinal redistribution of precipitation, increasing precipitation at high latitudes, decreasing precipitation at sub-tropical latitudes(15,18,19), and possibly changing the distribution of precipitation within the tropics by shifting the position of the Intertropical Convergence Zone(20). Here we compare observed changes in land precipitation during the twentieth century averaged over latitudinal bands with changes simulated by fourteen climate models. We show that anthropogenic forcing has had a detectable influence on observed changes in average precipitation within latitudinal bands, and that these changes cannot be explained by internal climate variability or natural forcing. We estimate that anthropogenic forcing contributed significantly to observed increases in precipitation in the Northern Hemisphere mid-latitudes, drying in the Northern Hemisphere subtropics and tropics, and moistening in the Southern Hemisphere subtropics and deep tropics. The observed changes, which are larger than estimated from model simulations, may have already had significant effects on ecosystems, agriculture and human health in regions that are sensitive to changes in precipitation, such as the Sahel." Allan, R P & Soden, B J (2008) Atmospheric warming and the amplification of precipitation extremes" Science 321, 1481-1484. Abstract: "Climate models suggest that extreme precipitation events will become more common in an anthropogenically warmed climate. However, observational limitations have hindered a direct evaluation of model- projected changes in extreme precipitation. We used satellite observations and model simulations to examine the response of tropical precipitation events to naturally driven changes in surface temperature and atmospheric moisture content. These observations reveal a distinct link between rainfall extremes and temperature, with heavy rain events increasing during warm periods and decreasing during cold periods. Furthermore, the observed amplification of rainfall extremes is found to be larger than that predicted by models, implying that projections of future changes in rainfall extremes in response to anthropogenic global warming may be underestimated."
  5. Has any research been done on just how much water vapour can be held in the atmosphere and the warmer temperatures before it reaches saturation point? And also explain to me why Douglas Hoyt's info is so dodgy. He's fairly knowledgeable in the field so why is his contribution so wrong? How do we know what's right or wrong? You can justify comments with 'scientific proof' but how do we know that it is correct? Are you prepared to take anyones word for it? Is there some corruption not only from the climate change skeptics but also from the IPCC and other anthropogenic climate change supporters? It's all very interesting but doesn't everyone within this current issue have an agenda?
  6. interesting questions; some are easily answered, some less so: [Has any research been done on just how much water vapour can be held in the atmosphere and the warmer temperatures before it reaches saturation point?] It depends where you are in the atmosphere since the saturation level varies with temperature and pressure. These data are known quite acurately 'though. You can see the variation of saturation of air with water vapour as a function of temperature here (scroll down the page to find the relevant graph): http://en.wikipedia.org/wiki/Water_vapor [And also explain to me why Douglas Hoyt's info is so dodgy. He's fairly knowledgeable in the field so why is his contribution so wrong? How do we know what's right or wrong?] One can compare Hoyt's assertions with reality. They don't match. Therefore in this instance we know Hoyt is wrong. A problem is that Hoyt hasn't published anything on this. he's just asserting stuff on a web site. Since he may well have written it in 2004, perhaps he thought it was correct then but doesn't realize that real world data now contradicts his assertion; perhaps he just hasn't bothered to update his web site. We'd have to ask him... Hoyt has made the assertion (on his website) that gravity effects will eliminate 90% of the warming-induced enhancement of water vapour concentrations. The Minschwaner and Dessler paper that Hoyt refers to indicates a possibility of a much smaller reduction in enhanced water vapour. So even in 2004, Hoyt's assertion didn't match reality. Now we have much better measures of atmospheric water vapour, and it's clear that the atmospheric water vapour concentrations rise pretty much as predicted by theory and modelling. As well as the articles whose abstracts are listed in my post above, more recent analyses (see [**] below) of direct tropospheric water vapour demonstrate that the water vapour concentrations are rising in response to warming pretty much as predicted. So Hoyt is demonstrably wrong. [You can justify comments with 'scientific proof' but how do we know that it is correct?] It's not really about "proof". It's about the evidence. In this case Hoyt is making assertions that are directly contradicted by the evidence. So in this instance Hoyt is demonstrably wrong. A lot of the efforts in dealing with so-called "skeptical" (!) "arguments" is in pointing out their inherent self-contradictions. Hoyt is also wrong (it seems to me) on straightforward theoretical/empirical grounds that relate to the competing effects of gravity and thermal kinetic energy on isolated molecules in a vapour as I outlined in my post just above. [are you prepared to take someone's word for it?] Yes and no. If someone has a habit of dishonesty of course one would be foolish to take their word. Likewise if someone is respected for their honesty and diligence, I'm more likely to take them at face value. I am always skeptical of stuff that is asserted on this or that web site, and if one investigates further and finds that the asserter hasn't published the relevant work (or in this case hasn't published anything for 10 years), makes assertions that are not supported by any evidence, and upon further investigation, finds that the assertions are actually directly contradicted by real world evidence, then it would be foolish not to discount the assertions. One should be skeptical about these things! [Is there some corruption not only from the climate change skeptics but also from the IPCC and other anthropogenic climate change supporters?] Corruption is usually identifiable. Can you identify any IPCC "corruption"? I haven't come across any. That doesn't mean the IPCC are paragons of perfection! If anything the IPCC presentations are somewhat conservative. [It's all very interesting but doesn't everyone within this current issue have an agenda?] I wouldn't have said so. There's clearly a strong agenda position to misrepresent the science amongst certain quarters (you see quite a lot of it from a cohort of posters on this web site). In my experience the only "agenda" the scientists have is to get to the bottom of whatever topic their researching, preferably making some good discoveries along the way and publishing some well-respected and highly-cited papers. [***] Gettelman A and Fu Q (2008) “Observed and simulated upper-tropospheric water vapor feedback” J. Climate 21, 3282-3289. Abstract: “Satellite measurements from the Atmospheric Infrared Sounder (AIRS) in the upper troposphere over 4.5 yr are used to assess the covariation of upper-tropospheric humidity and temperature with surface temperatures, which can be used to constrain the upper-tropospheric moistening due to the water vapor feedback. Results are compared to simulations from a general circulation model, the NCAR Community Atmosphere Model (CAM), to see if the model can reproduce the variations. Results indicate that the upper troposphere maintains nearly constant relative humidity for observed perturbations to ocean surface temperatures over the observed period, with increases in temperature similar to 1.5 times the changes at the surface, and corresponding increases in water vapor ( specific humidity) of 10% -25% degrees C-1. Increases in water vapor are largest at pressures below 400 hPa, but they have a double peak structure. Simulations reproduce these changes quantitatively and qualitatively. Agreement is best when the model is sorted for satellite sampling thresholds. This indicates that the model reproduces the moistening associated with the observed upper-tropospheric water vapor feedback. The results are not qualitatively sensitive to model resolution or model physics.” Brogniez H and Pierrehumbert RT (2007) “Intercomparison of tropical tropospheric humidity in GCMs with AMSU-B water vapor data” Geophys. Res. Lett. 34, Article Number: L17812 Abstract: “We make use of microwave measurements of the tropical free tropospheric relative humidity (FTH) to evaluate the extent to which the water vapor distribution in four general circulation models is faithful to reality. The comparison is performed in the tropics by sorting the FTH in dynamical regimes defined upon the 500 hPa vertical velocity. Because microwave radiation penetrates non-rainy and warm clouds, we are able to estimate the FTH over most of the dynamical regimes that characterize the tropics. The comparisons reveal that two models simulate a free troposphere drier than observed (< 10%), while the others agree with the observations. Despite some differences, the level of agreement is good enough to lend confidence in the representation of atmospheric moistening processes. A climate change scenario, tested on two models, shows a tendency to maintain the FTH to an almost fixed value be it an ascending or a subsiding regime” ',
  7. Conspicously absent from consideration of what could have caused the warming for the 30 year period is ENSO and PDO. Here is a 58 year ENSO chart. http://www.cdc.noaa.gov/people/klaus.wolter/MEI/ts.gif Notice that prior to 1977 La Nina dominates the chart. After 1977 El Nino dominates the chart. The dominance of El Nino corresponds with the temperature rise of the last 30 years. Climate scientist Dr. Roy Spencer has calculated that up to 70% of the temperature rise that we have seen could be accounted for by ENSO and PDO patterns. There also seems to have been a flip in the PDO cycle in the last year or so that could well indicate another 20 years of flat or negative temperature trends. By the way, you may notice that the El Nino dominance in the chart was greatest from about 1977 to 1998. After that the distribution is a little more even. This corresponds well to the flatening of the temperature trend for the last decade. While that point is also challenged in this blog, I have proven it to be true in the relevant section.
    Response: ENSO has been considered as a possible driver of global warming. The El Nino Southern Oscillation does show close correlation to global temperatures over the short term. However, it is unable to explain the long term warming trend over the past few decades.
  8. Now THIS is interesting: Did Early Global Warming Divert A New Glacial Age? ScienceDaily (Dec. 18, 2008) — The common wisdom is that the invention of the steam engine and the advent of the coal-fueled industrial age marked the beginning of human influence on global climate. But gathering physical evidence, backed by powerful simulations on the world's most advanced computer climate models, is reshaping that view and lending strong support to the radical idea that human-induced climate change began not 200 years ago, but thousands of years ago with the onset of large-scale agriculture in Asia and extensive deforestation in Europe. ... http://www.sciencedaily.com/releases/2008/12/081217190433.htm
  9. And in follow up: "Nevle and Bird admit that volcanic activity and a decrease in the sun's intensity probably both played roles in triggering the Little Ice Age. Still, Bird said, human activity was undeniably important." http://www.msnbc.msn.com/id/28353083/
  10. This The_skeptic_who_came_in_from_the_cold.html is an attempt to answer, for a skeptic (not denialist) friend, his proposition that since climate had changed before there was nothing to either explain or worry about. It is an attempt to distinguish between genuine skepticism and malign, planet-hating, denialism. The comment from tommybar "even if C02 is contributing, which it may have/be, a lot has been shown that it's 'greenhouse' ability is a logarithmic function, and that it has already contributed as much as it can" is interesting because it has suddenly started cropping up, in blogs around the world almost simultaneously. Could it be the latest talking point provided for the denialist anti-environment lobby? Funny how they all sing to the same tune (ice caps on Mars, Antarctic ice growing, planet now cooling) at the same time with each new attempt to stack the card deck, shuffle the pea, while distracting the punters.
  11. David; the examples given of extinction events are interesting but not relevent. Sure there were changes in climate that caused species extinctions, but those changes were caused by massive physical forces -catastrophic in scale and duration far beyond what we can do by adding CO2 to the atmosphere. Bear in mind too, that the earth was a very different place then and so was the climate; in truth one could argue that if it wasn't for these events we would not have the climatic conditions we enjoy today.
  12. David I understand what you are saying but disagree that they caused the extinctions. The warming as the agent of extinction is simply false. Life on Earth has always adapted well to increases in heat, this quite clear from the fossil record. Climate changes can and do cause extinctions but from cooling, not warming. Every extinction cited as being caused by GHGs can be shown to have other causes. I agree with Mizimi on this. Name an extinction where warming is blamed and I will give you a more viable explanation for that extinction that has nothing to do with GHGs. This is a violent and dangerous planet. People that refuse to believe that are seriously deluded.
  13. ps Let me rephrase that. "this quite clear from the fossil record. Climate changes can and do cause extinctions but from cooling, not warming." I should have said: "this IS quite clear from the fossil record. Climate changes can and do cause MAJOR extinctions but from cooling, not warming. Minor extinctions happen all the time because some organisms have over specialized and are too sensitive. The small climate changes (which occur normally) weed out those species. It's called Natural Selection."
  14. Well, the Late Permian comes immediately to mind. The period which is my own research speciality is the late Pleistocene. The cold period (Europe) and relatively wet period (Australia) was a time when large mammals flourished. The change over to a warmer and drier time saw the loss of numerous species. This extinction event is going to be mirrored by what is going on now. But more so, because the change which took hundreds, perhaps thousands of years then (ie starting some 25,000 years ago), is going to be replayed in the space of a few decades in the 21st century. I swore I wasn't, on the basis that life, and an equable climate, is much too short, going to argue with denialists any more, but here I am, can't help myself I suppose. BY the way, does anyone still following this thread know what has happened to the owner of this blog? It feels like we are playing around in a deserted house, the owner curiously absent.
  15. David Someone essentially called John a liar (in a nice enough way) in the Arctic melt thread and he has been very quiet since. I side with John but I'm a liar too. The Permian extinction is obviously the most interesting. I'll assume that you have read "Gorgon" already since it is so pertinent. OK, the obvious factor is the Siberian traps. Large volcanic fields erupting for a very long time spewing all sorts of poisons into the atmosphere. But (from Gorgon) the sea extinctions (something like 90%) happened in a different time fram from the land extinctions (Somewhere around 75%). Sorry I don't remember the exact numbers. Well what caused the traps to erupt? In both the PT and KT extinctions we have evidence for very large impactors on the opposite side of the earth preceding the eruption of the traps. The reason for the extinctions is fairly obvious (two incidents and two extinction events, the second event caused by the first). BTW the same actually happened at the KT, Bakker points out that the dinosaurs were already in trouble by the KT event.
  16. ps I am not as familiar with the Pleistocene, I have been studying the Paleocene-Eocene-Oligocene periods recently but have not gotten as far as the Pleistocene. What do you have so far?
  17. pps Calling sceptics "deniers" is the same as calling you an alarmist. I am sure that you don't like it either.
  18. Just to refresh my memory you are talking about an interglacial within the Neogene-Holocene Ice Age? The Pleistocene was the last period prior to the Holocene and prior to H4, correct?
  19. Ok, I am getting caught up. It was a series of glacations and interglacials. Yes I did read about this period to some extent (I have a terrible memory). The chart at Wikipedia is a good refresher. I'll brush up on it.
  20. sorry, i screwed up the link: This should work.
  21. David I knew I had read a little about it. This is from my file. PLos One is down right now so I can't give you a link. But here is the Abstract. Neanderthal Extinction by Competitive Exclusion Banks,et.al Background: Despite a long history of investigation, considerable debate revolves around whether Neanderthals became extinct because of climate change or competition with anatomically modern humans (AMH). Methodology/Principal Findings: We apply a new methodology integrating archaeological and chronological data with high-resolution paleoclimatic simulations to define eco-cultural niches associated with Neanderthal and AMH adaptive systems during alternating cold and mild phases of Marine Isotope Stage 3. Our results indicate that Neanderthals and AMH exploited similar niches, and may have continued to do so in the absence of contact. Conclusions/Significance: The southerly contraction of Neanderthal range in southwestern Europe during Greenland Interstadial 8 was not due to climate change or a change in adaptation, but rather concurrent AMH geographic expansion appears to have produced competition that led to Neanderthal extinction.
  22. Um yes, the Neanderthals are an interesting case since they involve "creatures" with similar culture and lifestyle and bigger brain than us. Clearly the interaction between us and them was complex. Climate change may well have played a role in Neanderthal demise either directly or indirectly, as may interaction with H. sapiens sapiens. But I am talking about the extinction of the megafaunas - in Europe adapted to cold conditions (eg woolly mammoth), in Australia to cool wet conditions (eg Diprotodon). And extinctions due to strikes from space? Dunno. I was once reasonably happy with the dinosaur demise theory, but even that one I have my doubts about now. I reckon CO2 build up with methane release as the planet warms up is a better bet for all of them, but that is just me. But whatever the cause of the past great extinctions, they are really just cautionary tales about what can happen to this planet when something goes awry with the normal stabilising mechanisms. Makes a nonsense of the denialist view that us puny 6 billion humans spewing ever more CO2 into the air couldn't possibly alter the climate. I think we are in for a least the late Pleistocene (yes, pre-Holocene if you like) nastiness, and quite possibly much worse. And you will find that hot climate (plus dry in Australia) causes far more problems to water based life forms than cold climate.
  23. David You must mean the Berkeley paper: Climate Change Plus Human Pressure Caused Large Mammal Extinctions In Late Pleistocene ScienceDaily (Oct. 4, 2004) — Berkeley - A University of California, Berkeley, paleobiologist and his colleagues warn that the future of the Earth's mammals could be as dire as it was between 50,000 and 10,000 years ago, when a combination of climate change and human pressure resulted in the extinction of two-thirds of all large mammals on the planet. LOL - That's from Berkeley back in 2004! I don't know if I would trust them, but I can't access the original paper. That is a shame. There is also an ongoing argument about a couple of impacts right around then, one on land in the northern U.S. (I forget exactly where) and another in the Atlantic near Brasil (again I don't remember exactly where, I'll try to find the articles). I agree when something goes awry with the normal stabilising mechanisms things happen. But it's not something we have a lot of control over. But "causes far more problems to water based life forms than cold climate." I have to disagree with. Read that paper when PLos One comes back online (they are just doing maintenance) and look at the graphs. Both Neandertal and our ancestors took a real nose dive at H4, we were lucky to recover, neandertal wasn't so lucky.
  24. ps This link will take you to PLos One when they are back online. Then just type in "neandertal" in their site search for the paper.
  25. No, I don't mean the Berkeley paper, I mean my own work on Australian mammals, but I'm glad they agree. Seehttp://www.blognow.com.au/mrpickwick/History_Conquerors/ for an extended discussion on Australia and more generally. Whatever happened to the Neanderthals is a separate (though possibly related) issue to what happened to all these big mammals on all the continents except Africa.

1  2  3  4  5  6  7  8  9  10  11  12  13  14  15  16  17  18  19  20  Next

Post a Comment

Political, off-topic or ad hominem comments will be deleted. Comments Policy...

You need to be logged in to post a comment. Login via the left margin or if you're new, register here.

Link to this page


The Consensus Project Website

THE ESCALATOR

(free to republish)


© Copyright 2024 John Cook
Home | Translations | About Us | Privacy | Contact Us