Climate Science Glossary

Term Lookup

Enter a term in the search box to find its definition.

Settings

Use the controls in the far right panel to increase or decrease the number of terms automatically displayed (or to completely turn that feature off).

Term Lookup

Settings


All IPCC definitions taken from Climate Change 2007: The Physical Science Basis. Working Group I Contribution to the Fourth Assessment Report of the Intergovernmental Panel on Climate Change, Annex I, Glossary, pp. 941-954. Cambridge University Press.

Home Arguments Software Resources Comments The Consensus Project Translations About Support

Twitter Facebook YouTube Mastodon MeWe

RSS Posts RSS Comments Email Subscribe


Climate's changed before
It's the sun
It's not bad
There is no consensus
It's cooling
Models are unreliable
Temp record is unreliable
Animals and plants can adapt
It hasn't warmed since 1998
Antarctica is gaining ice
View All Arguments...


Username
Password
New? Register here
Forgot your password?

Latest Posts

Archives

Climategate 2.0 in Context - Solar Warming

Posted on 2 December 2011 by dana1981

One of the Climategate 2.0 emails highlighted by certain parties as "probably devastating" involved a query from Rob Wilson to Tim Osborn in 2005 regarding the solar contribution to relatively recent global warming.  Here is the pertinant portion of Wilson's email, with the quote-mined portion highlighted in cherry red:

"I was always under the impression that, in general, solar changes controlled long term changes in climate and volcanic events caused short term cooling.

I am surprised when you say that volcanic forcing dominates the models - this seems at odds to papers by Lean and Rind etc."

{...}

"Although I agree that GHGs are important in the 19th/20th century (especially since the 1970s), if the weighting of solar forcing was stronger in the models, surely this would diminish the significance of GHGs.

Jeez - I sound like a sceptic - this is not my intension.

I guess, ultimately, what troubles me is that of the myriad of NH recons out there now, they generally show a MWP that is NOT as warm as the late 20th century. I have no trouble with this - however, the solar activity of the MWP (excluding the Oort minimum) is also generally not as high as the recent period. I know correlation does not mean causation, but it seems to me that by weighting the solar irradiance more strongly in the models, then much of the 19th to mid 20th century warming can be explained from the sun alone.

again, am I being overtly simplistic?"

Clearly Wilson is simply inquiring as to the role solar irradiance in the recent global warming.  Note in particular the timeframe he discusses towards the end of the email - the 19th to mid-20th Century.  In fact, as we have previously discussed, solar irradiance did play a significant role in the early 20th Century warming.

In order to determine the solar contribution, we have to start with the solar radiative forcing, which is the change in total solar irradiance (TSI) in Watts per square meter (W/m2) divided by 4 to account for spherical geometry, and multiplied by 0.7 to account for planetary albedo (Meehl 2002).  The albedo factor is due to the fact that the planet reflects approximately 30% of the incoming solar radiation.  As with CO2, we calculate the equilibrium temperature change by multiplying the change in radiative forcing by the climate sensitivity parameter (λ). This is a question of physics, not model weighting:

Solar irradiance hasn't increased by more than 1 to 2 W/m2 over the past 150 years.  Therefore, the global warming due to solar irradiance over that timeframe is approximately 0.15 to 0.3°C (compared to 0.8°C observed surface warming).

Certainly if we artificially weighted solar irradiance more strongly in the models, it could explain more of the early 20th Century warming (although for this exercise to be scientifically valid, we would have to come up with a physical justification for this larger solar weighting).  However, this would not change the human contribution to the global warming over the past 60 years, during which time solar irradiance has actually decreased slightly (Figure 1).
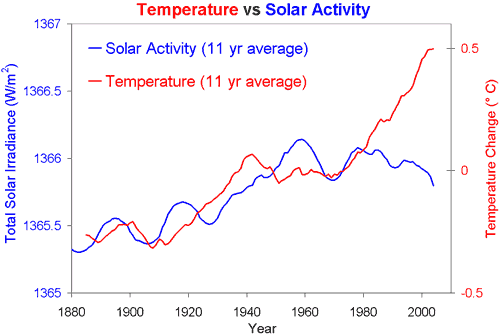
Figure 1: Global temperature (red, NASA GISS) and Total solar irradiance (blue, 1880 to 1978 from Solanki, 1979 to 2009 from PMOD).

In a previous email in the chain, Osborn explained the physics:

"the 1700-present greenhouse gas forcing is more than double the 1700-present solar forcing and hence the warming trend over that period in the model is driven mainly by GHGs."

In a subsequent email, Osborn explained how the forcings are input into the model:

"The forcings for ECHO-G are selected in advance by (1) choosing the strength and time series of solar irradiance variability; (2) choosing the strength and time series of volcanic aerosol variability and converting this to a surrogate time series of solar irradiance reductions, which are then added to (1); and (3) choosing the time series of greenhouse gas concentrations.

Thus (1) and (2) prescribe the forcings to the model - there is no role for the model itself to determine the strength of those forcings."

The bottom line is that Wilson was not suggesting that solar activity is responsible for more warming than we think, or greenhouse gases less, but merely asking the question 'what if models weight solar irradiance more strongly?' because of the historical correlation between irradiance and temperature.

However, the amount of warming attributed to solar irradiance is based on physics.  Moreover, since 1960, solar activity has declined slightly, while the average global surface temperature has increased by more than 0.5°C.  And while we experienced an exceptionally long solar cycle minimum over the past several years, 2010 tied for the hottest year on record.  Thus it's quite clear that recent global warming is not due to the Sun, and the stolen Climategate emails don't even suggest (let alone demonstrate) otherwise.

0 0

Printable Version  |  Link to this page

Comments

Comments 1 to 16:

  1. I don't think David Appell can be regarded as a 'denialist'.
    0 0
    Response:

    [dana1981] Thanks, I shouldn't have assumed.  Text revised.

  2. I personally doubt that the deniers can re-inflate the HOAX balloon - the 20% that believes anything that appears to "prove" that climate scientists are in on a big conspiracy have enough to go on from the first batch, and the rest of us will never fall for this blatant set of lies. I do wonder if giving these trumped up issues airtime helps or hurts - (ie will the myth or the facts survive a casual reading of this post). But I suppose any chance to point out the truth is worth taking.
    0 0
  3. dana : "Solar irradiance hasn't increased by more than 1 to 2 W/m2 over the past 150 years" I guess it is less than these values. In IPCC AR4 , I read : "In terms of plausible physical understanding, the most likely secular increase in total irradiance from the Maunder Minimum to current cycle minima is 0.04% (an irradiance increase of roughly 0.5 W m–2 in 1,365 W m–2), corresponding to an RF[11] of +0.1 W m–2. Krivova et al 2010 gave a higher estimate for 1610-present, 1,25 W/m2 in TSI. But remember the reference base is the great solar minimum of Maunder, so during the XXth century, TSI variance is far lower.
    0 0
  4. skept.fr - there have been a few other studies (i.e. by Lean) that have put the TSI increase over the past 150 years in the 1 W/m2 ballpark. It's certainly no more than 2 W/m2, but I wanted to give an upper limit.
    0 0
  5. Available energy to earth, averaged over surface area is subject to: S * ( 1 - a ) / 4, where S is Solar Irradiance, a is albedo and 1/4 is the ratio of the area of the disc through which sunlight passes to irradiate the surface area of the (roughly spherical )earth. The amount of increased energy from any increase in insolation is considerably less than the reduced amount of energy modeled to leave earth. Still we should recall that ( neglecting ozone absorption for the moment ) sunshine is largely absorbed at the bottom of the atmosphere while GHG forcing is from a reduction of outgoing at the top of the atmosphere. Also that solar irradiance appears to be at a century or more high. Also that whatever the equilibrium energy level was 150 years ago, solar increase alone changed it. Is there a contribution from 150 years of increased sunshine coming back out of the oceans? Further still, we don't know albedo very well or how it varied in the past or how it varies from year to year. IPCC models, lacking anything else to go on, use persistence of the recent high levels for the value of insolation: http://igloo.atmos.uiuc.edu/IPCC/FORCING/solar.constant.png A regression to the mean may be more likely. If that occurs, we will have a case study which should help in evaluating just how significant solar forcing is ( or isn't ).
    0 0
    Response:

    [DB] "Also that whatever the equilibrium energy level was 150 years ago, solar increase alone changed it."

    Straw man.  Multiple factors (forcings and feedbacks) account for the changes in global temperatures over that timeframe.

    "Further still, we don't know albedo very well or how it varied in the past or how it varies from year to year."

    More straw men.  I suggest you research more, pontificate less.

    "IPCC models, lacking anything else to go on"

    IBID.  The models you reference are global circulation models, not something concocted by the IPCC.  Your statement reveals either a lack of knowledge about them or a willingness to deliberately impart false information.

    "A regression to the mean may be more likely."

    Unsupported speculation.  You have a protracted history on this forum of making unsubstantiated allegations and falsehoods.  Cease.

  6. Watcher#5: Nice choice of scale for your solar irradiance graph. However, you miss the details evident in the graph in this post: last 50 years - solar down, warming up.
    0 0
    Response:

    [DB] The paternity for that graphic is here.

  7. CW - so your position is that while obviously the sun hasnt been responsible for warming since 1950, we can nevertheless ignore the GHG problem because we can always hope that the sun will reduce output soon. However, how about you compute what the TOA forcing for a change in irradiance from 1650-1995 corresponds to compared to GHG forcing change since pre-industrial? Now suppose the sun suddenly goes quiet but GHG continue to go up. That would be a help, no question. But the GHG stay in the atmosphere so what do you think happens when solar activity returns?
    0 0
  8. DB#6: Ah yes, the picture is vastly different if your data stops in 2000. Based on the 2nd CW graph, it hasn't changed since then.
    0 0
  9. Muoncounter @6, I assume you are aware that his second graph is the solar forcings as used for projections to 2100 in some group of climate models. Unfortunately ironic (or sarcastic) tone does not come through well on the internet.
    0 0
  10. ClimateWatcher - It would be worth your while to look at the How would a Solar Grand Minimum affect global warming thread. Story in short: "The most likely impact of a Maunder Minimum by 2100 would be a decrease in global temperature of 0.1°C with a maximum reduction of warming by 0.3°C. Compare this to global warming between 3.7°C ... to 4.5°C". Solar variation is being hugely overwhelmed by greenhouse gas changes. You are, IMO and based upon your posting history, blowing smoke. Again. Why is it, considering what obviously represents considerable investment in searching out information such as these insolation values, that you keep hunting for reasons to reject the influences of greenhouse gases?
    0 0
  11. "A regression to the mean may be more likely". Certainly speculation, but I wouldn't call it completely unspported, but rather a speculation that is weakly supported by the common sense idea that the average for the last 150 years is the mostly likely true long term average. I see no reason why unsupported speculation is bad. I have a problem with speculation that is dressed up as fact. E.g. 'The IPCC is incompetent because they chose a continuing high solar value for their models' Personally if I was doing the models I'd probably have run models with both a high and low solar forcing to try and further explore the likely upper and lower range of future temperature change. As further speculation I would expect the upper limit would be unchanged, the most likely case would go down a small amount, and the lower limit would go down a bit more. Or perhaps the IPCC know something about the sun that I don't and continuing high solar levels over the next century are more likely than regression to the mean. Well actually I'm sure they know many things I don't about the sun, but rather something that applies specifically to this situation.
    0 0
  12. Tom C: The point was this CW observation Also that solar irradiance appears to be at a century or more high doesn't look so apparent when the last 10 years of data is included. Nor here: --source
    0 0
  13. Michael Hauber @11, a better idea of mean of Total Solar IRradiance over recent times can be provided by Steinhilber et al's reconstruction of TSI over the Holocene: They show a 0.9 W/m^2 change between the Maunder Minimum and the solar minimum of 1986, and a 0.93 W/m^2 difference between 1986 and the lowest values in the record. The highest values are about half that greater than current values, with the mean slightly below late 20th century values. That represents a variation of less than 0.3 W/m^2 in solar forcing from grand maximum to minimum.
    0 0
  14. CW pontificates a lot but fails to do the legwork to support his pontification: compare actual temperature to TSI directly. And we'll see why: WoodForTrees allows this comparison nicely and shows -shock, horror-: since approx 1980 solar activity and temperature don't correlate at all. But, ofcourse, this has been noticed by mainstream science a long time ago. TSI vs Temp since 1975 Sunspot count vs Temperature since 1880:
    0 0
  15. cynicus I understand your point and you're right in the conclusions. Though, you're first graph is not correct. When you look for the trend in a cyclic signal and you have just a few cycles, you need to carefully consider the end-point effect. If you start and end at different phases of the cycle you may get almost anything you want. Here's is an example.
    0 0
  16. Slightly off topic but the way that the Anthony Watts and Steve McIntyre are hyping Climategate II calls for creative action. I ask that you go to http://climateaudit.org/ and http://wattsupwiththat.com and ask Steve and Anthony to release all their personal e-mails regarding climate change. Please!
    0 0

You need to be logged in to post a comment. Login via the left margin or if you're new, register here.


The Consensus Project Website

THE ESCALATOR

(free to republish)


© Copyright 2024 John Cook
Home | Translations | About Us | Privacy | Contact Us