CO2 lags temperature - what does it mean?
What the science says...
| Select a level... |
 Basic
Basic
|
 Intermediate
|
 Advanced
| ||||
|
CO2 didn't initiate warming from past ice ages but it did amplify the warming. In fact, about 90% of the global warming followed the CO2 increase. |
|||||||
Climate Myth...
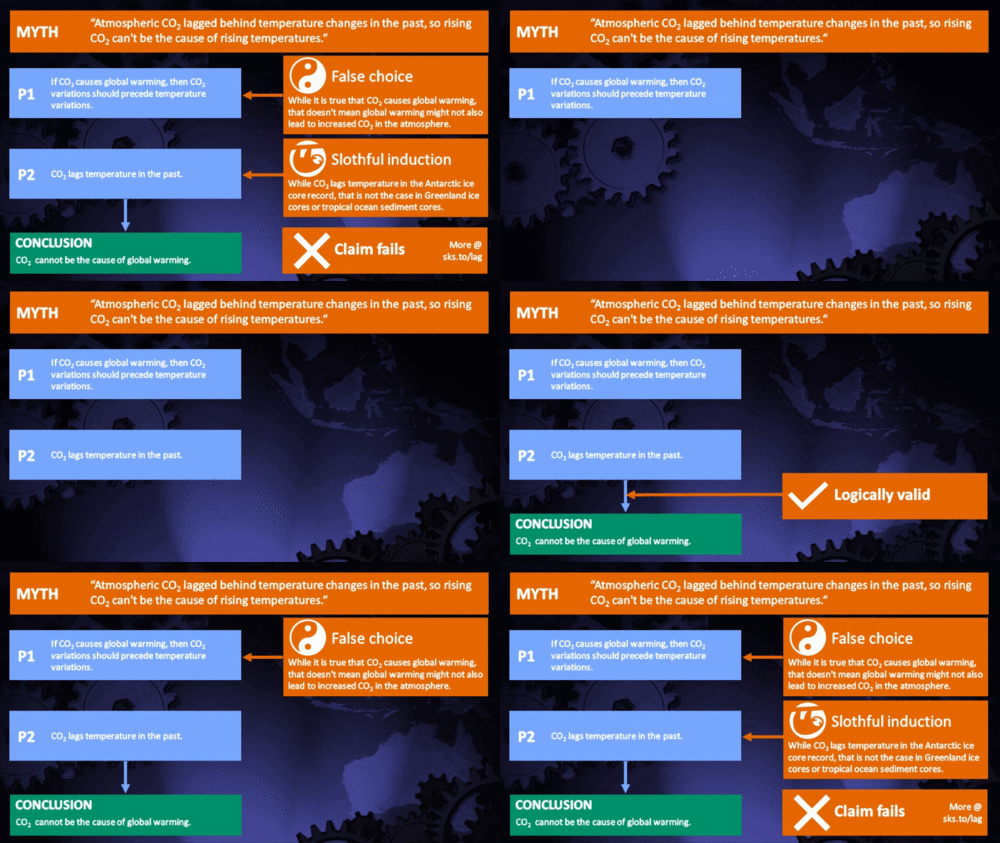
CO2 lags temperature
"An article in Science magazine illustrated that a rise in carbon dioxide did not precede a rise in temperatures, but actually lagged behind temperature rises by 200 to 1000 years. A rise in carbon dioxide levels could not have caused a rise in temperature if it followed the temperature." (Joe Barton, US House of Representatives (Texas) 1985-2019) - Full Statement
At a glance
Antarctic ice-core data today provide a continuous record on temperature and atmospheric composition that goes back for some 800,000 years. The data track the last few glacial periods and their abrupt endings, with rapid transitions into mild interglacials. But in some of the ice-cores, temperature rises first and is followed, a few hundred years later, by rising carbon dioxide (CO2) levels.
Certain purveyors of climate-myths seized on this observation, claiming it to be “proof” that carbon dioxide doesn't cause climate change. Wrong, wrong, wrong. But how? The answer lies in a beer-can.
In fact, you can do this one yourself. You need two cans of any fizzy beer. On a nice summer's day, take one out of the fridge and place it outside in direct sunshine for a few hours. Leave the other where it is. Then open the two at the same time. The warm one will froth like mad, half-emptying the can and making a mess. What is left in the can will be horrible and flat. Conversely, the one straight from the fridge will just give a “pfft” noise and will be pleasant to drink, being cool and fizzy.
What's that got to do with this myth? Well, you have just demonstrated an important point about the solubility of CO2 in water. CO2 gives fizzy drinks their fizz and it is far more soluble in colder water. As the water warms, it cannot hold onto as much CO2 and it starts to degas. Hence that flat lager.
Exactly the same principle applies to the oceans. When global warming is initiated, both land and the oceans start to warm up. On land, permafrost starts to thaw out, over vast areas. Carbon dioxide (and methane) are released, having been trapped in that permafrost deep-freeze for thousands of years. At sea, that “warm beer effect” kicks in. Thanks to both processes, atmospheric CO2 levels rise in earnest, amplifying and maintaining the warmth. That rise in CO2 thereby caused more of the gas to be released, warming things up yet more in a vicious cycle, known as a positive feedback. Other feedbacks kick in too: for example as the ice-sheets shrink, their ability to reflect Solar energy back out to space likewise decreases, so that heat is instead absorbed by Earth’s surface.
The trigger for the initial warming at the end of an ice-age is a favourable combination of cyclic patterns in Earth's orbit around the Sun, leading to a significant increase in the solar energy received by Earth's Northern Hemisphere. That's no secret. Glacial-interglacial transitions are caused by several factors working in combination – triggers and feedbacks. We've understood that for a long time.
And when you think about it, saying CO2 lagged temperature during glacial-interglacial transitions so cannot possibly be causing modern warming is a bit like saying, “chickens do not lay eggs, because they have been observed to hatch from them".
Please use this form to provide feedback about this new "At a glance" section. Read a more technical version below or dig deeper via the tabs above!
Further details
That CO2 can lag behind but amplify temperature during a glacial-interglacial transition was in fact predicted as long ago as 1990. In the paper The Ice-Core Record: Climate Sensitivity and Future Greenhouse Warming by Claude Lorius and colleagues published in the journal Nature in 1990, a key passage reads:
"The discovery of significant changes in climate forcing linked with the composition of the atmosphere has led to the idea that changes in the CO2 and CH4 content have played a significant part in the glacial-interglacial climate changes by amplifying, together with the growth and decay of the Northern Hemisphere ice sheets, the relatively weak orbital forcing and by constituting a link between the Northern and Southern Hemisphere climates."
This was published over a decade before ice core records were accurate enough to confirm a CO2 lag. We now know that CO2 did not initiate the warming from past ice ages but it did amplify the warming. In fact, about 90% of the global warming followed the CO2 increase.
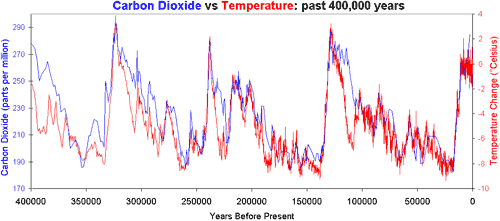
Antarctic ice cores reveal an interesting story, now going back for around 800,000 years. During this period, changes in CO2 levels tend to follow changes in temperatures by about 600 to 1000 years, as illustrated in Figure 1 below. This has led some to disingenuously claim that CO2 simply cannot be responsible for the current global warming. Unsurprisingly, such a claim does not tell the whole story.

Figure 1: Vostok ice core records for carbon dioxide concentration and temperature change.
The initial change in temperature as an ice-age comes to an end is triggered by cyclic changes in Earth’s orbit around the sun, affecting the amount of seasonal sunlight reaching Earth’s surface in the Northern Hemisphere. The cycles are lengthy: all of them take tens of thousands of years to complete.As both land and oceans start to warm up, they both release large amounts of CO2 into the atmosphere, from melting permafrost and from warming ocean water, since CO2 solubility in water is greater in cold conditions. That release enhances the greenhouse effect, amplifying the warming trend and leading to yet more CO2 being degassed. In other words, increasing CO2 levels become both the cause and effect of further warming. Once started, it’s a vicious, self-reinforcing cycle - an excellent example of what science refers to as a positive climate feedback.
Indeed, such positive feedbacks are necessary to complete the shifts from glacial to interglacial conditions, since the effect of orbital changes alone are too weak to fully drive such variations. Additional positive feedbacks which play an important role in this process include other greenhouse gases like methane - you may have seen videos of that gas bubbling up through icy lakes in permafrost country and being ignited. Changes in ice sheet cover and vegetation patterns determine the amount of Solar energy getting absorbed by Earth’s surface or being reflected back out to space: decrease an ice-sheet’s area and warming will thereby increase.
The detailed mechanisms for the above general pattern have of course been investigated. In a 2012 study, published in the journal Nature (Shakun et al. 2012), Jeremy Shakun and colleagues looked at global temperature changes at the commencement of the last glacial-interglacial transition. This work added a lot of vital detail to our understanding of the CO2-temperature change relationship. They found that:
1) The Earth's orbital cycles triggered warming in the Arctic approximately 19,000 years ago, causing large amounts of ice to melt, flooding the oceans with fresh water.
2) This influx of fresh water then disrupted ocean current circulation, in turn causing a seesawing of heat between the hemispheres.
3) The Southern Hemisphere and its oceans warmed first, starting about 18,000 years ago. As the Southern Ocean warms, the solubility of CO2 in water falls. This causes the oceans to give up more CO2, releasing it into the atmosphere.
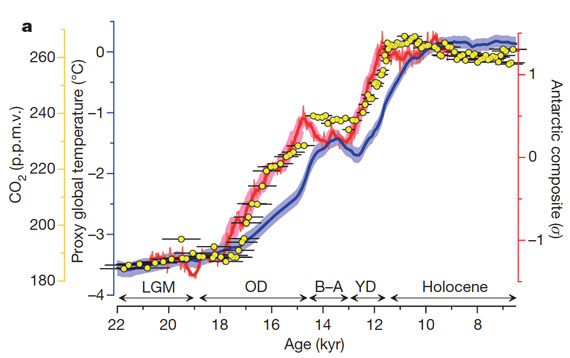
4) Finally, CO2 levels may lag temperature in some ice-core records from Antarctica, but in some other parts of the world the reverse was the case: temperature and CO2 either rose in pace or temperature lagged CO2. Figure 2 demonstrates this graphically and shows how things are never as simplistic as purveyors of misinformation would wish.
Figure 2: Average global temperature (blue), Antarctic temperature (red), and atmospheric CO2 concentration (yellow dots). Source.
Last updated on 14 February 2023 by John Mason. View Archives


 Arguments


Caillon 2003 constrains the CO2 lag to 800 ± 200 years (but again, no error bars):
Stott 2007 finds similar results - a CO2 lag of 1000 ± 300 years. Stott does include 200 year uncertainty on the benthic ages (in fact, Stott's graph includes everything but the kitchen sink):
Without knowing which older studies you're talking about, the most recent studies with up to date (and dare I say the most accurate) data (Monnin 2001, Caillon 2003) paint a similar picture of Southern warming -> CO2 rise -> Northern warming. But if you do know of any pertinent older papers, it'd be great if you could post the links here. And kudos for sticking it to the man :-)
Quietman 'How do we know that the planet isn't returning to Earth Normal or Earth Mean temperature?' Are you seriously proposing a new theory - that the Earth has a memory? Do you have a mechanism? Or a 'setting' to which this 'memory' is adjusted? Is there any peer-reviewed literature as a source? CO2 clearly cannot be meaningless, it has long been known to be infra-red active and remains resident in the atmosphere for a long time, from memory ~33% remains after one hundred years and 20% after a thousand years, but there is a long tail meaning that some will remain for tens of thousands of years, causing significant warming. Inevitably, this alone will affect the net heat balance of the Earth. Of course CO2 is NOT the only GHG and as temperature increases, so does the water vapour, which acts as a positive feedback amplification. But while water vapour is a stronger GHG than CO2, it does not remain in the atmosphere for long. The source of the excess CO2 is explained by the shifting isotopic ratio of the atmospheric carbon. From this it is known to originate from non-biological sources - i.e. fossil carbon: coal, oil & gas. Regarding CO2, the Mauna Loa CO2 readings overlap ice core data during the period 1959-1978. The CO2 readings obtained match perfectly during the overlap. AFAIK, the oldest ice cores are ~ 1000 ky old. Here's one with the source data and references - so that YOU can check its authenticity! Image:Carbon_History_and_Flux_Rev_png and Image:Carbon_Dioxide_400kyr_Rev_png Sorry, but I couldn't locate a version in the p/r literature. I've seen them before, it's just that I couldn't find any. We are clearly performing a global experiment and no-one can be absolutely certain as to the precise outcome, but if it does all go dreadfully wrong, the trouble is that we are INSIDE the test-tube! It would therefore be a really good idea to heed the scientists and stop trying to light the Bunsen burner! Let's cut-back on the use of fossil-fuels, through improved technology, energy conservation & efficiency and renewable energy generation. The economic argument that carbon taxes will damage the US economy is bogus. “As Congress prepares to debate new legislation to address the threat of climate change, opponents claim that the costs of adopting the leading proposals would be ruinous to the U.S. economy. The world’s leading economists who have studied the issue say that’s wrong” http://www.cis.yale.edu/opa/newsr/08-03-19-02.all.html We owe it to the next generation and generations to come to hand over the Earth in the same condition as it was when we received it. Sadly, this will not be the case.
Note - globalwarmingart.com usually cites his sources if you want to track down the original studies where he get the data from.
Quietman, Another thought: Those graphs in my previous post show a rapid upward acceleration of CO2 in recent decades, one that matches the accelerated warming. If what you suggest were true: namely that Earth is [your hypothesis] 'returning' to 'normal', then one would expect an ever decreasing asymptotic approach. Instead, what is seen in the second graph is a rapid departure upwards from the upper bound historic values - the exact reverse of what is expected. Image:Carbon_Dioxide_400kyr_Rev_png Oops! your theory is shot full of holes!