Climate Science Glossary

Term Lookup

Enter a term in the search box to find its definition.

Settings

Use the controls in the far right panel to increase or decrease the number of terms automatically displayed (or to completely turn that feature off).

Term Lookup

Settings


All IPCC definitions taken from Climate Change 2007: The Physical Science Basis. Working Group I Contribution to the Fourth Assessment Report of the Intergovernmental Panel on Climate Change, Annex I, Glossary, pp. 941-954. Cambridge University Press.

Home Arguments Software Resources Comments The Consensus Project Translations About Support

Bluesky Facebook LinkedIn Mastodon MeWe

Twitter YouTube RSS Posts RSS Comments Email Subscribe


Climate's changed before
It's the sun
It's not bad
There is no consensus
It's cooling
Models are unreliable
Temp record is unreliable
Animals and plants can adapt
It hasn't warmed since 1998
Antarctica is gaining ice
View All Arguments...


Username
Password
New? Register here
Forgot your password?

Latest Posts

Archives

How CO2 warming is driving climate

What the science says...

The Nature commentary by Penner et al. on which this argument is based actually says that on top of the global warming caused by carbon dioxide, other short-lived pollutants (such as methane and black carbon) cause an additional warming approximately 65% as much as CO2, and other short-lived pollutants (such as aerosols) also cause some cooling. However, claiming that CO2 has only caused 35% of global warming is a gross misinterpretation and misunderstanding of the paper.

Climate Myth...

CO2 only causes 35% of global warming

CO2 does not account for even a majority of the warming seen over the past century. If other species accounted for 65% of historical warming that leaves only 35% for carbon dioxide. (Doug Hoffman)

In August 2010, Nature published a commentary by Penner et al. which mainly focused on the uncertainty regarding the effect short-lived pollutants (such as aerosols and black carbon) have on the climate. As is often the case, many in the blogosphere misinterpreted and misunderstood the statements and conclusions in the commentary. Not surprisingly, the biggest misinterpretation related to the contribution of anthropogenic greenhouse gases to global warming. Below is the most misunderstood quote, with emphasis on the key word.

"Of the short-lived species, methane, tropospheric ozone and black carbon are key contributors to global warming, augmenting the radiative forcing of carbon dioxide by 65%. Others — such as sulphate, nitrate and organic aerosols — cause a negative radiative forcing, offsetting a fraction of the warming owing to carbon dioxide."

Numerous blogs have (mis)interpreted this statement to mean that carbon dioxide is only causing 35% as much global warming as previously believed. A more accurate reading of the quote is that certain short-lived pollutants cause warming in addition to carbon dioxide - quantitatively, approximately 65% as much warming as CO2. And certain other short-lived species cause a cooling effect which offsets some of this warming.

This is not a new conclusion. The IPCC puts the radiative forcing from CO2 at 1.66 W/m2, compared to the forcing from other greenhouse gases, black carbon, and tropospheric ozone at approximately 1.4 W/m2. Similarly, the negative forcing from aerosols is approximately -1.2 W/m2.


Figure 1: Radiative forcing estimates from the IPCC FAR

Thus if anything, the 65% figure is an underestimate of the contributions of short-lived pollutants to global warming, but this contribution does not change the 1.66 W/m2 radiative forcing from CO2 or the amount of global warming it has caused.

Much ado has also been made about another quote from the commentary:

"Warming over the past 100 years is consistent with high climate sensitivity to atmospheric carbon dioxide combined with a large cooling effect from short-lived aerosol pollutants, but it could equally be attributed to a low climate sensitivity coupled with a small effect from aerosols. These two possibilities lead to very different projections for future climate change."

This statement gets to the main point of the commentary - that there remains significant uncertainty regarding the effect of these short-lived pollutants on the global climate. However, estimates of the planetary climate sensitivity to increasing atmospheric CO2 and other radiative forcings are not solely based on the change in the mean global temperature over the past 100 years. In fact, the climate sensitivity parameter has been estimated through many different methods, including:

  • climate models
  • recent responses to large volcanic eruptions
  • recent responses to solar cycles
  • paleoclimate data
  • data from the last Glacial Maximum
  • and yes, data from the instrumental period

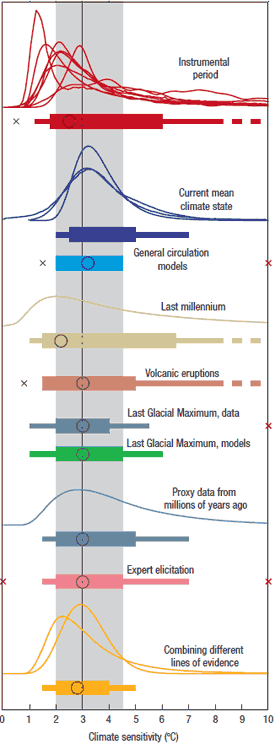
All of these different methods show strong agreement, overlapping in the IPCC climate sensitivity range of 2 to 4.5°C for a doubling of atmospheric CO2 (2xCO2).
sensitivity summary
Figure 2: Distributions and ranges for climate sensitivity from different lines of evidence. The circle indicates the most likely value. The thin colored bars indicate very likely value (more than 90% probability). The thicker colored bars indicate likely values (more than 66% probability). Dashed lines indicate no robust constraint on an upper bound. The IPCC likely range (2 to 4.5°C) and most likely value (3°C) are indicated by the vertical grey bar and black line, respectively (Knutti and Hegerl 2008)

Interestingly, Penner et al. find that whether the climate sensitivity parameter is on the low or high end, reducing anthropogenic emissions of the short-lived warming pollutants would achieve a significant reduction in global warming over the next 50-100 years.  In the red lines in the Figure 3, they employ a climate model with a sensitivity of 5°C for 2xCO2, slightly outside the IPCC likely range.  The blue line is a climate model with a sensitivity of 2°C for 2xCO2, on the lower end of the IPCC range.  Note that even with the lower climate sensitivity, the model shows the planet warming 3°C by 2100 in this emissions scenario (see the figure caption for further details).
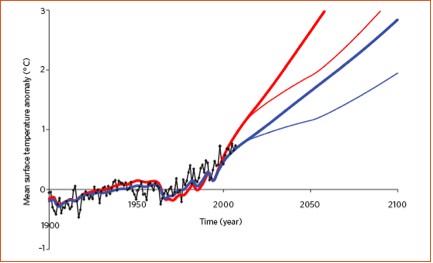

Figure 3: Global mean temperature measurements (black) and projections based on an IPCC scenario with high emissions (A2) for a climate sensitivity parameter of 5°C (upper red) and 2°C (upper blue). Linearly decreasing the total anthropogenic radiative forcing owing to methane, tropospheric ozone and black carbon — starting in 2010 and achieving pre-industrial levels by 2050 — results in significant near-term climate mitigation (lower blue and red curves) (Penner 2010)

Unfortunately, reducing the short-lived cooling pollutants such as aerosols would cause a warming effect of similar magnitude, and so CO2 remains the primary pollutant of concern.  Coincidentally, a group of scientists from NASA GISS just published a paper in Science entitled Atmospheric CO2: Principle Control Knob Governing Earth's Temperature.

Although it is important to reduce the remaining climate uncertainties, such as the magnitude of the impacts of short-lived pollutants, it does not change the fact that CO2 is very likely the driving force behind the current global warming, or that if we double the amount of CO2 in the atmosphere from pre-industrial levels, the planet will likely warm in the range of 2 to 4.5°C.

Last updated on 13 August 2015 by dana1981. View Archives

Printable Version  |  Offline PDF Version  |  Link to this page

Argument Feedback

Please use this form to let us know about suggested updates to this rebuttal.

Comments

Comments 1 to 10:

  1. Continued from comments on the 'human fingerprint in the seasons' thread. #166: "Attributing these observation to a primary cause, which seems to be the intention here, seems problematic." I agree that is a very valid and significant question. In the seasonal fingerprint thread, John cited Braganza et al 2004. They looked at 5 indices pulled from sea surface and air surface temperature data, concluding Over the last 50 years, observed linear trends in the global-mean temperature (GM), the land-ocean temperature contrast (LO), the magnitude of the annual cycle in temperature over land (AC) and the Northern Hemisphere meridional temperature gradient (MTG) are found to be significantly larger than changes expected due to internal variability and changes in solar and volcanic aerosol forcing. ... Consistency between the observed and GS [greenhouse gas plus sulfate aerosol] trends in four different indices suggests that anthropogenic forcing has had a large influence on observed changes during the later part of the twentieth century. Their models include water vapor; however, your question still persists: How much GHG warming is due to water vapor and how much is CO2 and the other nasty gases? For this, look at Schmidt et al 2010. First they make this utterly critical point: The system which is relevant for our discussion of climate sensitivity consists of the atmosphere (winds, temperature, humidity, clouds, etc.) coupled to a simplified upper ocean component that allows SST to vary [Charney, 1979]. In this system, CO2, other trace GHGs, solar variations etc. are forcings, while the changes to internal prognostic variables corresponding to clouds and water vapor (that occur as a function of other changes in climate, which then go on to change the radiative transfer in the climate themselves) will be feedbacks. Among their conclusions: ... given the uncertainties, that water vapor is responsible for just over half, clouds around a quarter and CO2 about a fifth of the present‐day total greenhouse effect. Given that the attribution is closer to 20% than 2%, it might make more intuitive sense that changes in CO2 could be important for climate change. No doubt you're thinking 'Bazinga! He just said CO2 is only 20%!'. However, look next at Lacis et al 2010: This allows an empirical determination of the climate feedback factor as the ratio of the total global flux change to the flux change that is attributable to the radiative forcing due to the noncondensing GHGs. This empirical determination leads then to a climate feedback factor of 4, based on the noncondensing GHG forcing accounting for 25% of the outgoing flux reduction at the TOA for the full-constituent atmosphere. This implies that Earth’s climate system operates with strong positive feedback that arises from the forcing-induced changes in the condensable species. A direct consequence of this combination of feedback by the condensable and forcing by the noncondensable constituents of the atmospheric greenhouse is that the terrestrial greenhouse effect would collapse were it not for the presence of these noncondensing GHGs. It appears that CO2 (and the other noncondensing gases) is the driver of this car; there are four passengers, all urging the driver to go faster. The very excitable Water Vapor is riding shotgun, the back seat is full of Clouds. If the driver jumps out, the car stops because Water Vapor and Clouds don't drive. If the passengers quit yelling 'faster', the car keeps going, just at a more reasonable speed. To take this metaphor one step further, by increasing atmospheric CO2 concentration, we turned what was a very responsible adult driver into a wild and crazy teenager.
  2. This site has very high standards requiring explicit physical mechanisms, yet in the notion that CO2 controls water I have heard nothing but metaphor. Described variously as a "skin", "skeleton", "relentless ratchet", and now designated driver (1.), this control knob implies something more than just a steady supply of radiative forcing. I can understand how CO2 mixed into the stratosphere could act as some sort of lid and as a backstop for escaping photons. It now appears ice and CO2 mix into the mesosphere (although how they get through the ozone inversion is problematic unless they leaked through the holes). In the parts of the absorbtion spectra where CO2 and water vapor overlap water vapor seems to dominate the absorbtion and reduce the effect of CO2. Whither the control?
    Response: [Dikran Marsupial] You raised the point about the overlapping absorption bands of water vapour and CO2 here and I answered it for you here. This is not the first time (to say the least) you have received an answer to a question and ignored it and moved off onto another thread to start afresh. This does your credibility no good at all. Further discussion should return to the thread where the question was initially raised.

    As to CO2 controls water, it influences the amount of water vapour in the atmosphere because the warmer the air, the more water vapour it can hold. If you don't believe me, buy a hygrometer and watch relative humidity fall in winter and rise in summer.

  3. Moderator @ 2. The problem is organizing thoughts to fit the somewhat arbitrary threads. In 42. @ "How do we know CO2?" You replied that at the "top of the atmosphere" there isn't much H2O. I totally agree. I would like to know exactly what you meant by top of the atmosphere, but I wasn't quibbling. Here the same issue emerges in a different context, how CO2 controls water. A good place to evaluate that would be where they exist together in the trophosphere, no? I plead guilty to jumping around. I'm the monkey who eschews knee-jerk responses. Believe me, I read your links and think about your responses. I'm not here to waste my time or yours. Here it strikes me that you may be the one deflecting the issue by jumping to a different thread. Sure, CO2 raises temperature, temperature raises water vapor, water vapor raises temperature further; but temperature also raises CO2. I am holding your control knob, wondering exactly where to plug it in to this cycle, and exactly how it works.
    Response:

    [DB] There are literally thousands of threads here at SkS and none are closed (and I'm not sure if anyone has counted them all).  Some may be dormant or currently inactive, but fresh comments posted anywhere will not be ignored. 

    Since you were directed to specific, more appropriate threads where your questions would be better placed, why not follow those pointers & get the reolution to your questions you seek?

    As for the Control Knob, have you watched this yet?

    [Dikran Marsupial] If you wanted to know what I meant by top of the atmosphere, a good place to have started would be to read the real climate article I linked for your benefit. It explains how the greenhouse effect actually operates, and most of us here would benefit from reading it (I know I did).

    Temperature does cause CO2 to rise (all things being otherwise equal) because a warm ocean can hold less CO2. However, in the current situation, all things are not equal; specifically anthropogenic emissions have cause atmospheric CO2 levels to rise, and higher partial pressure of CO2 in the atmosphere causes increased absorbtion by the oceans (and by the biosphere - it is plant food). This dominates the increase in ocean emissions due to the warming of the oceans to date. The oceans are a net carbon sink, not a source.

  4. I am struggling to understand what you dont understand. This reference to "control knob" is I think a quote from R Alley? If you can point me to where he uses it, I might be able to explain further what is meant. To my mind, CO2 is simply a forcing among others - something like solar and aerosols that can be varied independently of temperature (unlike water vapour). All the forcing are control knobs for climate.
  5. Dikran Marsupial @3. I did read the link you provided and did some further research. It was a real eye opener to understand how the greenhouse effect works in a gas. It's not like your car or a greenhouse. That is why I went so far as to suggest a possible mechanism for CO2 control knob function as a lid in the stratosphere. (I've often wondered why thunder clouds anvil off so sharply when they hit the bottom of the stratosphere. Sure, they are on a moist adiabadic path and the stratosphere is very dry, but there is no dry adiabadic inversion there) How do you know the oceans are a carbon sink and not a source? Because they are acidifying? What if the acidification came from subsurface CO2 via metnane?
    Response: [Dikran Marsupial] Had you read the RC article, you would not have written "In the parts of the absorbtion spectra where CO2 and water vapor overlap water vapor seems to dominate the absorbtion and reduce the effect of CO2." as the article explicitly says that this is not the case (I even gave the relevant quote in my reply on the other thread, and put it in bold so you must have seen it). As for knowledge regarding the oceans being a carbon sink, see the work of Corinne Le Quere (for example). As to carbon being the "control knob", it is actually more like a thermostat (it only becomes a control knob if the natural feedback mechanisms are over-ridden by e.g. fossil fuel emissions), see the book by David Archer reviewed here.
  6. Dikran Marsupial @5. If I had said, "In the parts of the absorbtion spectra where CO2 and water vapor overlap _and where they exist together in the lower troposhpere_ water vapor seems to dominate the absorbtion and reduce the effect of CO2. The abundant H2O vapor is more likely to catch the photon down there, and if it happens to radiate another upward, that one also is most likely to be absorbed by H2O, and so on, like an Austraiian Rules football, until the game reaches an altitude where CO2 predominates and the photons are emitted at a lower temperature.", would you have believed I read the article? Connie Le Quere believes increased up and down welling caused by stronger and poleward migrating westerlies will reduce the oceanic uptake of CO2. An interesting article disagreeing with her at AAAS states a model run showed decreasing uptake to about year 2000 and increasing uptake thereafter. All of this presupposes that the westerlies increase. The recent trend toward polar warming may reduce the gradient that drives the westerlies.
    Response: [Dikran Marsupial] Yes, but that isn't what you wrote, and it is entirely irrelevant to the greenhouse effect that water vapour absorption dominates in the lower trophosphere, because that is not where the Earth's energy balance is determined. Had you written that, I would believe you had read the article, but not understood it. As for the ocean uptake, Le Quere is taking about the saturation of the oceanic reservoir, which (thankfully) hasn't happened yet, note the tense of "will reduce oceanic uptake of CO2". Try this paper (which is an anlysis of what has happened, rather than what is likely to happen), look at Fig 2d, which shows the oceans to be a sink, and that the sink has been deepening over the last 50 years.
  7. Dikran Marsupial @6. As much relief as it is to be exonerated from lying, it is still a disappointment to remain a simpleton for not understanding that a large amount of CO2 essentially sequestered amongst hordes of H2Ov molecules in the lower troposphere is "entirely irrelevant to the greenhouse effect"; particularly as I wasn't discussing the greenhouse effect, but rather possible ways CO2 might contrtol water. I was trying to suggest (however crudely)that the lower troposphere is probably not a good place to look. Thanks for Le Quere 2009. Fig 2d does show a slight trend in increased ocean uptake, but it is from a model simulation, and the unexplained residual (2e) is greater than the trend. I was more interested if Fig 3 where actual measurements show CO2 outgassing in the circum antarctic beltway, the gulf stream, and the Indo Pacific warm pool that has garnered so much interest recently. It shows CO2 uptake in the northern Pacific. Imagine the THC superimposed on this map. The THC redistributes the cold salty Arctic/Atlantic (and the Antarctic) bottom water to the Pacific and Indian oceans. The net SST effect is to warm the Atlantic and cool the Pacific and Indian Oceans. The areas of outgassing in Fig 3 are the warm surface currents of the THC. (IMO the Indo Pacific warm pool is simply a backup of the Pacific return warm current at the restriction of Micronesia) Trunkmonkey prediction: Further data will show that the Indian Ocean, particularly whichever side of the IOD the cold water us upwelling on, will be a sink for CO2.
    Response: [Dikran Marsupial] You asked "How do you know the oceans are a carbon sink and not a source?" the graph shows the ocean to be a considerable sink in absolute terms, the downward trend is a second order issue, so I don't know why you are fixating on the trend. Whenever the line is below zero, the oceans are a sink, whatever the slope of the line may be. You need to learn the basics first, that the oceans are a net sink is pretty basic.
  8. Trunkmonkey...Fig three in that Le Quere et al paper does not depict sources and sinks areas for CO2, but rather the difference in rates of change in CO2 over time in the ocean and atmosphere at those points. For a general map of source and sink areas you'd be better off looking at this. You also have your CO2 sink and source waters mixed up. The THC moves warm salty water to the north Atlantic where it cools and sinks. The North Atlantic is a sink for atmospheric CO2 because, as the Gulf Stream cools on it's northward trek, it absorbs more CO2 from the atmosphere before sinking. Algae also grow there seasonally, taking up CO2 eventually sinking to depth where they decompose. Tropical upwelling regions are sources of atmospheric CO2 because deep water that is cold and has high CO2 warms after reaching the surface, resulting in the release of CO2 to the atmosphere. The only way this doesn't happen is if algae growing on the nutrients contained in that water suck up the CO2 before it has a chance to escape. The deep water has high CO2 because it was cold when it sank (as in the North Atlantic) and because CO2 from respiration of sinking organic matter builds up over time. The fact that the ocean has source and sink regions is largely moot to your question though. Under steady atmospheric CO2, the source and sink regions balance each other - they represents CO2 being shuffled around, nothing more. When atmospheric CO2 increases, that balance between sources and sinks shifts. More CO2 gets absorbed by the mixed layer all over the ocean. More also gets absorbed by cooling surface waters that form deep water. Less CO2 is lost when cold water upwells and warms. The ability of the ocean to absorb more CO2 as atmospheric CO2 concentrations increase is a matter of physical chemistry. You can't get around it without violating some basic law or another. The only serious scientific question (and we're going back to the 1950s, here) was whether the ocean sink could keep up with emissions. The answer was a resounding no. If you absolutely need a telling observation, a warming ocean that is becoming acidic must be absorbing CO2. Normally when the ocean warms its pH increases as it gives up CO2 to the atmosphere. The fact that the ocean is warming and declining in pH is a sure sign that CO2 is following the concentration gradient into the ocean.
  9. Stephen Baines. Thank you. I wasn't aware that it was impossible to directly measure pCO2 en aqueous. Fig 3 in Le Quere et al measures the change in trend in pCO2 the ocean surface versus the atmosphere. I assumed that the positive values meant that ocean pressure was increasing faster than the atmosphere and the gradient would result in outgassing. In both the ocean and the atmosphere trend is everything. Air that is rising and cooling will "outgas" H2O in clouds and rain and air that is sinking and cooling will absorb the same. So it is with the ocean and CO2. Water that is rising and warming will shed CO2 and water that is sinking and cooling will absorb it. As the warm currents of the THC pass through the tropics they continue to warm, although considerable energy is expended in latent heat of vaporization as they evaporate and become more haline. I checked out Takahashi 2009 and Schuster 2009? to try to understand exactly what was being measured in Le Quere Fig 3 and I was astonished how difficult a seemingly simple measurement can be. I'm still not certain I understand it, but whatever it is, the red(positive)areas lie on the warm currents of the THC, would you not agree? I'm not sure what question all this is moot to. I keep getting shoehorned into positions I do not subscribe to. I'm aware that all this is just a CO2 shell game (although I wish carbonate shells would rain down with a vengance to be sequesterd for billions of years). I know the ocean Co2 sink is a sacred cow in this business, but what if the decline in pH were from subsurface CO2 derived from methane? Trunkmonkey say: When the science is settled, scientist not working hard enough!
    Response: [Dikran Marsupial] Just a word of advice, rhetorical phrases such as "I know the ocean Co2 sink is a sacred cow in this business" do not really encourage replies, as it implies closed mindedness on the part of those holding a mainstream view. Likewise your final sentence, there is very little science that is settled (other than that the observed rise in atmospheric CO2 is anthropogenic, that we do know for sure).
  10. There were many ways temperature or other climate features could influence the carbon dioxide level one way or another. Perhaps variations of temperature and of weather patterns caused land vegetation to release extra CO2, or take it up... perhaps the oceans were involved through massive changes in their circulation or ice cover... or through changes in their CO2-absorbing plankton, which would bloom or decline insofar as they were fertilized by minerals, which reached them from dusty winds, rivers, and ocean upwelling, all of which could change with the climate... or perhaps there were still more complicated and obscure effects. Into the 21st century, scientists kept finding new ways that warming would push more of the gas into the atmosphere. As one of them remarked, "it is difficult to explain the demise of the ice sheets without the added heating from CO2 ... this gas has killed ice sheets in the past and may do so again.

Post a Comment

Political, off-topic or ad hominem comments will be deleted. Comments Policy...

You need to be logged in to post a comment. Login via the left margin or if you're new, register here.

Link to this page


The Consensus Project Website

THE ESCALATOR

(free to republish)


© Copyright 2024 John Cook
Home | Translations | About Us | Privacy | Contact Us