


 Arguments


Fast-rising CO2 levels accelerating global warming
What the science says...
Climate Myth...
An exponential increase in CO2 will result in a linear increase in temperature
This logarithmic relationship means that each doubling of atmospheric CO2 will cause the same amount of warming at the Earth's surface. Thus if it takes as long to increase atmospheric CO2 from 560 to 1120 parts per million by volume (ppmv) as it did to rise from 280 to 560 ppmv, for example, then the associated warming at the Earth's surface will be roughly linear. So the question then becomes, how fast do we expect atmospheric CO2 to rise over the next century?
How Fast will Atmospheric CO2 Rise?
The IPCC addressed this question by examining a number of different anthropogenic emissions scenarios. Scenario A1F1 assumes high global economic growth and continued heavy reliance on fossil fuels for the remainder of the century. Scenario B1 assumes a major move away from fossil fuels toward alternative and renewable energy as the century progresses. Scenario A2 is a middling scenario, with less even economic growth and some adoption of alternative and renewable energy sources as the century unfolds. The projected atmospheric CO2 levels for these scenarios is shown in Figure 1.
Figure 1: Atmospheric CO2 concentrations as observed at Mauna Loa from 1958 to 2008 (black dashed line) and projected under the 6 IPCC emission scenarios (solid coloured lines). (IPCC Data Distribution Centre)
In short, following the 'business as usual' approach without major steps to move away from fossil fuels and limit greenhouse gas emissions, we will likely reach 850 to 950 ppmv of atmospheric CO2 by the year 2100. It will have taken approximately 200 years (from 1850 to 2050) for the first doubling of atmospheric CO2 from 280 to 560 ppmv, but it will only take another 70 years or so to double the levels again to 1120 ppmv. This will result in an accelerating rate of global warming, not a linear rate. Under Scenarios A2 and A1F1, the IPCC report projects that the global temperature in 2095 will be 2.0–6.4°C above 1990 levels (2.6-7.0°C above pre-industrial), with a best estimate of 3.4 and 4.0°C warmer (4.0 and 4.6°C above pre-industrial average surface temperatures), respectively.
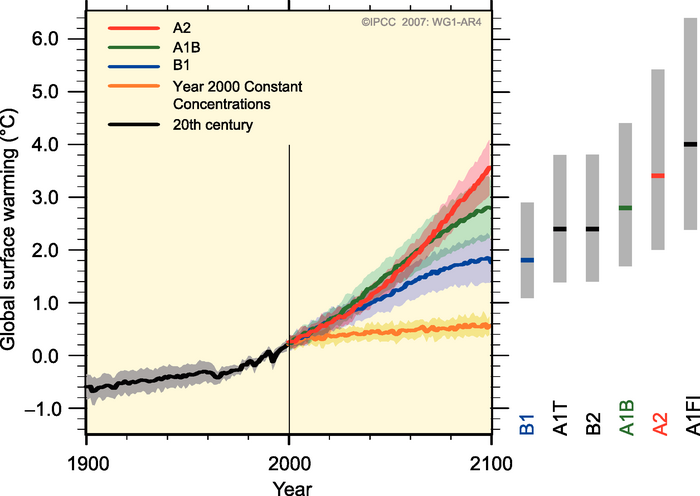
Figure 2: Global surface temperature projections for IPCC Scenarios. Shading denotes the ±1 standard deviation range of individual model annual averages. The orange line is constant CO2 concentrations at year 2000 values. The grey bars at right indicate the best estimate (solid line within each bar) and the likely range. (Source: IPCC).
Life in the Fast Lane
Some skeptics have claimed that these projected amounts of warming have not been borne out in the surface temperature changes over the past decade. But there are many factors which impact short-term global temperatures, which may conceal the long-term warming caused by increasing atmospheric CO2. So if we want to know if the IPCC projections are realistic, rather than examining noisy short-term temperature data, we should examine how much atmospheric CO2 is increasing.
When we look at this data, we find that observed CO2 emissions in recent years have actually been tracking close to or above the worst case (A1F1) scenario.
Figure 3: Observed global CO2 emissions from fossil fuel burning and cement production compared with IPCC emissions scenarios. The coloured area covers all scenarios used to project climate change by the IPCC (Copenhagen Diagnosis).
What Lies Ahead
So if we continue in a business-as-usual scenario, we should expect to see atmospheric CO2 levels accelerate rapidly enough to more than offset the logarithmic relationship with temperature, and cause the surface temperature warming to accelerate as well. Cllaims of a linear increase in temperature ignore that in the 'business as usual' scenario, we are currently on pace to double the current atmospheric CO2 concentration (390 to 780 ppmv) within the next 60 to 80 years, and we have not yet even come close to doubling the pre-industrial concentration (280 ppmv) in the past 150 years. Thus the exponential increase in CO2 will outpace its logarithmic relationship with surface temperature, causing global warming to accelerate unless we take serious steps to reduce greenhouse gas emissions. In fact, to continue the current rate of warming over the 21st Century, we would need to achieve IPCC scenario B1 - a major move away from fossil fuels toward alternative and renewable energy.
Last updated on 28 January 2011 by dana1981.


@ 6, this is most certainly interesting: can't wait for a reply to your post by one fitter than me to make one... but you know I'll be trying to work out a sensible response to it from now until then!
... I believe the relevant term is 'partial pressures' having read through some of the pages of answers and comments given to other myths but I don't really understand what was being said.
This presumes that CO2 is causing the temperature change - and that it's not just a period of (predominantly or entirely) natural warming coinciding with increased emissions since the industrial revolution.
It doesn't matter how much atmospheric CO2 has risen since the industrial revolution if CO2 does not cause temperature to change. The climate changes naturally and always has.
jesscars - Scientists are suckers for 1st law of thermodynamics. If you increase GHG, then you increase the radiation reaching the surface and you can predict exactly the spectrum change associated with it and measure it directly. If you want to invoke some hitherto unnoticed cause, then you have interesting problem of explaining why increased radiation doesnt increase temperature in violation of known physics. Secondly, if you seriously expect someone to accept a natural cause, then you need to explain where this extra energy is coming from. Not the sun, we measure its output directly; not the ocean - it is getting warmer too; no Milankovich - the 65N forcing has been negative for a long time.
Furthermore, CO2 increase in past ages as a result of temperature increase are a very slow feedback from bogs and oceans that wont start happening with current temperature rise for 100s of years (we hope anyway). We can tell that all increase in CO2 concentration is from emissions based on O2 decrease; isotopic composition of the carbon; and straight mass-balance from known burning of fossil fuels. Frankly you are clutching at straws rather than examining the science.
That is not really helpful. When you break it down what it says is... some skeptics might say that what's happening on the ground doesn't reflect the theory, so for that, we use the theory to proove that what didn't happen will happen in the future.
You cant use what we expect to see in the future as a rebuttal against what we haven't seen in the past, that seems like abit of a fallacy.
Crashed @14 ,
Quite right. And it goes in the opposite direction, too ~ some "skeptics" say well-established physics theory (e.g. gravity causing downward acceleration, or CO2 radiational properties causing planetary warming) must be false because whatever-it-is has not yet happened. Or more precisely: has not yet happened "enough" to impress them to a drastic extent.
Rather like the tale of the Optimist who fell off the top of the Empire State Building ~ "25 floors and okay so far . . . 28 floors and okay so far . . . 32 floors and okay so far . . . "
Until the final predictable Splat onto the pavement, the Optimist refuses to make a realistic assessment of the overall situation.
You see that sort of thing very often with "skeptics" ~ the globe isn't warming (enough) . . . the ice isn't melting (enough) . . . the sea-level rise can't accelerate ( because it didn't do so during the previous century). And they turn the logic inside out, to claim this proves AGW & climate science must be fake.
Crashed ~ if you could analyse & explain that sort of stupid thinking, I would be very grateful !
Crashed: That sentence is an attempted summarization. Would it be clearer if it were expanded to "...rather than examining only noisy short-term temperature data, we should remove the effects of those other factors on temperature so we can estimate the effect of CO2 alone, then examine how much atmospheric CO2 is increasing."
I really don't understand this article. I don't doubt that the climate crisis is serious and that we have to do something about it, however, I am a mathematician and the lograithmic relationship between the equilibrium temperature and the increase in CO2, implies that if the CO2 increases exponentially that the expected equilibrium temperature will increase linearly. So I don't understand why the claim "An exponential increase in CO2 will result in a linear increase in temperature" is posted as a myth in this article. I can understand the public misreading the claim to think it means no need, but the fact is that given a finite interval, you can always find a linear function that grows faster than any exponential function on that interval. So the only way to know whether we have a problem or not is to crunch the numbers from the data with appropriate modelling. The evidence is in, we should be alarmed. But I am puzzled by this post.
I just realized that I forgot some words in the sentence that reads "I can understand the public..." The sentence should read "I can understand the public misreading the claim to think it means no need to be alarmed, but the fact is that given a finite interval, you can always find a linear function that grows faster than any exponential function on that interval. So the only way to know whether we have a problem or not is to crunch the numbers from the data with appropriate modelling.
plincoln24 @18,
I think you appreciate that this SkS OP is attempting to address the perception of "exponential growth" and thus the idea that the log relationship between atmospheric CO2 cncentrations and forcing makes such "exponential growth" linear and thus arguably entirely acceptable. I would suggest it is not the easiest of messages.
There are also some real-world considerations with the Log(Exp)=Linear relationship. ♣ There is the impact of any change in the exponential factor driving the CO2 increase (with the OP pointing to that exponent increasing & NOAA AGGI showing CO2 forcing which post-2000 exhibit a doubling-time of 43 years & a decade longer for all-GHG forcing). ♣ There is the transcient effect of the sudden tripling of the GHG forcing back in the 1960s (which all else being equal should provide an accelerating temperature for some decades following). ♣ There is (thus) the impact of non-CO2 forcings as well as natural forcings. ♣ There are the natural feedbacks and their impact on very-long-term warming resulting from an initial forcing, these timescales which are generally considered the factors that will define whether ECS is high or low.