


 Arguments


More research confirming large methane leakage from shale boom
Posted on 11 November 2014 by gws
More research published in 2014 is consistent with the previous notion that the shale boom in the US has been, and likely still is, causing much larger fugitive methane (and higher hydrocarbon) emissions than claimed by the industry.
In a recent publication in Earth's Future, a new journal published by the American Geophysical Union (AGU) dedicated to "global change and sustainability", a German-US team of researchers showed increasing atmospheric methane abundances over two rapidly developing shale areas, the Bakken and Eagle Ford shales in North Dakota and south Texas, respectively. Their methane emissions estimate is based on the difference in atmospheric methane in these areas between the years prior said rapid development, 2006-2008, and during it, 2009-2011.
Mapping methane anomalies
Data for the authors' analyses came from the European Space Agency (ESA) ENVISAT's instrument SCIAMACHY, and is unfortunately not available beyond early 2012, when contact with the satellite was lost. The instrument measured the total amount of methane in the atmosphere, the overwhelming amount of which is in the lower 10-12 km, the troposphere. Based on the resolution of the instrument, and the amount of time the satellite spent overhead, the authors used 3 years of data to get high enough precision for their study. They also accounted for how winds displaced the emitted methane differently between the two study periods. The result is depicted in Figure 1 below.
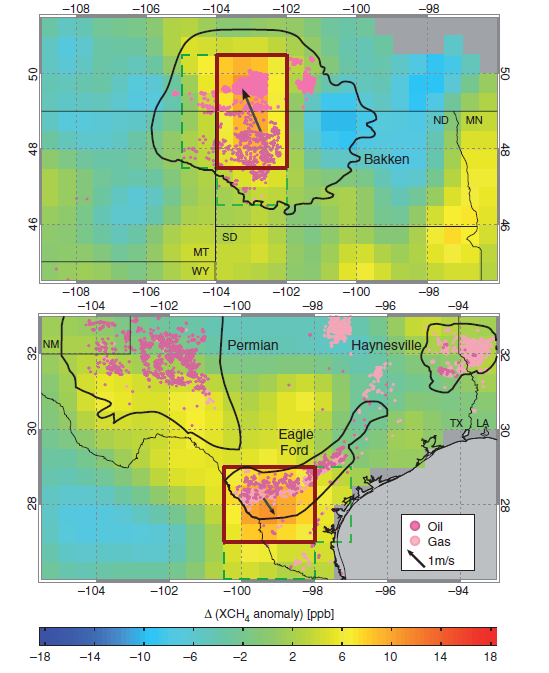
Figure 1: Shown are two latitude-longitude maps of the difference in atmospheric methane abundance (expressed as a mole fraction), or methane anomaly, for the period 2009–2011 relative to the period 2006–2008. The locations of oil and gas wells are shown in pink. The regions used to estimate shale area emissions are red-rimmed. The corresponding regions used to determine the background values are framed by the green dashed lines. Averaged near-surface wind differences between the periods are illustrated by dark grey arrows.
Yellow and orange colors indicate that methane abundance has increased between the periods. The overlap of these regions with the oil and gas wells alongside the slight displacement in accordance with the average wind differences as indicated by the arrows, is a clear sign of the industry's impact on methane. Unlike the recent studies by NOAA, comparisons to the same shale area over time avoids necessary corrections for methane sources other than oil and gas mining activities, since these other sources are not significantly changing in time. That also explains why the authors' methodology does not highlight other shale areas as prominently, since unchanging methane emissions between the compared periods, even though potentially very high, cancel by this methodology.
Comparing shale areas
Not surprisingly, the nature of this type of analysis, particularly a small signal-to-noise ratio (±4 ppb in Fig. 1 is likely noise), leads to a rather large possible range for the integrated emissions estimate. The authors offer this graphic (Fig. 2) as their summary, comparing recently published methane "leakage" rates to their own analysis for the Bakken and Eagle Ford shales:
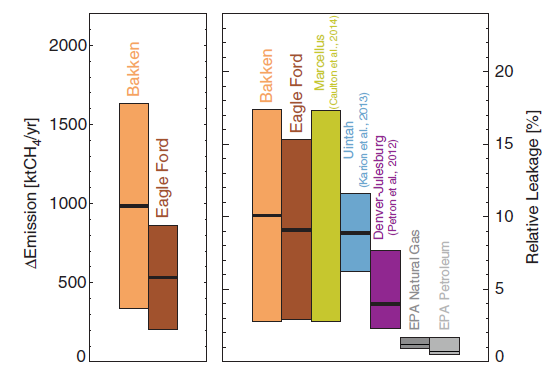
Figure 2 (original caption):Estimated methane emissions are shown for the targeted regions Bakken in light brown, and Eagle Ford in dark brown. Shown are absolute emission increase (2009–2011 relative to 2006–2008) in the left panel, and the leakage rate relative to production in the right panel, in each case together with the 1 σ-uncertainty ranges. For comparison, leakage estimates from previous studies in Marcellus (2012) [Caulton et al., 2014], Uintah (2012) [Karion et al., 2013], and Denver-Julesburg (2008) [Pétron et al., 2012] (yellow, blue, and magenta) are shown together with the EPA bottom-up inventory estimates for natural gas and petroleum systems (2011) [U.S. Environmental Protection Agency, 2014] (grey) in the right pane.
The satellite data analysis work is adding to a number of recent publications outlining that methane emissions from (unconventional) oil and gas exploration are much higher than the industry is claiming. As a result, the US federal government's standpoint that increased natural gas use has been reducing greenhouse gas emissions is becoming more and more questionable.
What is missing from this new work is one of the major differences that distinguishes the Bakken and Eagle Ford shale areas from others in the US: the large amount of continuous, uncontrolled flaring at (tight) oil wells. As recently highlighted in a series of investigative journalism at the San Antonio Express News, the flaring of co-produced ("associated") gas at oil wells is prolific, with annual gas amounts flared exceeding what all of metropolitan San Antonio consumes, according to the journalists. Flaring, and the associated billions of $$ wasted and air pollution created, used to be something visible in Russia, Nigeria, or Iran; but the US has catapulted itself into the top 5 flaring nations within a few years, with still more than one third of gas produced in the Bakken shale area wasted.
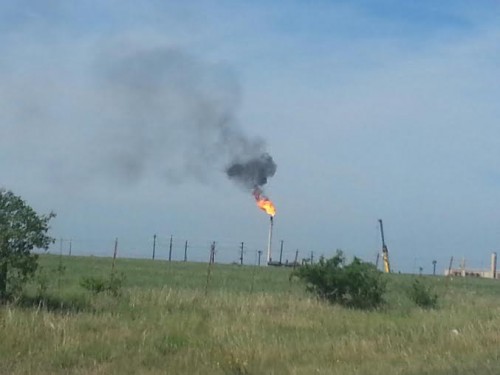
Figure 3: a typical flare in Karnes County, TX, center of the Eagle Ford shale (source).
Comments from the merchant of doubt ... and the experts
At the same time, the industry's front group, energyindepth.org, is becoming more desperate in denying the problem. In their comment on the Earth's Future publication, the author misconstrues the study's results, e.g. by misrepresenting methane emissions with concentrations. In addition, the front group keeps reiterating EPA's industry-based methane emissions estimates, a poor argument in light of what EPA's emission inventory actually means. Equally unsurprising is the front group's repeated attack on the seminal publication by Howarth, Santoro and Ingraffea, as if the claimed refutation of its results somehow invalidates all subsequent findings of high methane emissions. The parallels to Global Warming denial are all too obvious.
Instead, science progresses. Robert Howarth himself reflected on this progress in a recent publication reviewing the findings since their 2011 paper. He concludes by asking
"Is natural gas a bridge fuel? "At best, using natural gas rather than coal to generate electricity might result in a very modest reduction in total greenhouse gas emissions, if those emissions can be kept below a range of 2.4–3.2% (based on [Alvarez et al., 2012], adjusted for the latest information on radiative forcing of methane [34]). ..."
This is especially relevant since another recent study highlights the finding that it is unlikely that increasing natural gas extraction is only used for electricity production. Instead, natural gas is going to replace all other uses of energy, including renewables, and thus its increasing exploitation is not likely to reduce overall greenhouse emissions:
"The impact on CO2 emissions [...] is found to be much smaller (from -2 per cent to +11 per cent), and a majority of the models reported a small increase in climate forcing (from -0.3 per cent to +7 per cent) associated with the increased use of abundant gas. Our results show that although market penetration of globally abundant gas may substantially change the future energy system, it is not necessarily an effective substitute for climate change mitigation policy."


Just an observation at this point, but the atmospheric methane curves had somewhat flattened until about 2007. What began in 2007 at the same time the curve started up again? The shale boom.
This technique is called a "dog whistle" where the heavily indoctrinated key into an entire litany of misrepresentative arguments upon hearing key terms like "Mann" or "hockey stick". It is a dog whislte, because only the heavily indoctrinated have the pavlovian response to a signal that is not heard by rational, interested parties.
If they could marshall enough propaganda dissemination outlets to besmirch the name of "Howarth" as they have Michael Mann, they would be very, very happy about that. Because all later analyses would be jumbled into the first (e.g. Marcott).
tmbtx @1.
A very rough & ready back-of-fag-packet calculation. By 2007, man-made CH4 emissions were 282Mt(CH4) resulting in an increase of 12000ppb. Since 2007, atmospheric CH4 has risen ~50ppb, which would simplistically require an increase in emissions of ~12Mt(CH4) pa. US fracking (2013) produced 10.33 tcf CH4 /48.700 = 212Mt(CH4). So (assuming no decimal point slippage in these calcs) leakage of about 6% production would yield the 12Mt(CH4) pa increase in atmospheric CH4.
Bit too "rough & ready" ...
The atmospheric increase is based on an imbalance between sources and sinks. The historic imbalance was probably ending in the late 80s and it took 2-3 decades, based on methane's atmospheic lifetime, to reach a new equilibrium, about ten years ago. The new imbalance is still being researched, and while it is tempting to prescribe the shale boom as its cause, evidence from atmospheric background stations, shown by Ed Dlugokencky at AGU last December, and available as Nisbet et al. (2014), is mixed. Methane rise in northern mid-latitudes was strong in 2008-09, then again in 2012-13, but not in between.
Even if the 12 Mt/yr CH4 were correct, and that is closer to the current estimate of total US emissions including all sources, that does not necessarily mean that that is the answer just because it matches the global atmospheric increase.
There is a recent review paper here that may be useful to digest for those who want to learn more, and in detail .... Quote:
For all this extra methane being released into the atmosphere, why has its concentration so stubbornly lagged model predictions?
Russ, your question was addressed by me here. If you read the papers I just linked above, you will also find that the methane budget bottom-up estimates, which underlie the IPCC's projections (not predictions), tend to be higher than the top-down estimates (derived from atmospheric measurements), and that difference has not been reconciled yet.
Some work to do.
All I have to say is, Jesus Farking Christ, is industry sloppy.
The only bright light in that study is that the area over the Haynesville Shale shows no emissions bullseye despite that it grew into one of the largest gas fields in the U.S. over the period of the study. Too bad the study authors didn't calculate leakage rates for it too. It would have made an interesting contrast with the Bakken and Eagle Ford, where operators aren't after the gas, but oil and condensate instead.
All in all, it only makes it more urgent for the EPA's methane regs to be implemented sooner rather than later and for those regs to be expanded from gas wells to all wells. Of course, industry will sue, because that's what industry does.
Fugitive emissions from fossil fuel mining are undoubtedly increasing and contribute to some as yet unquantified extent to rising atmospheric CH4. Another bit in the jigsaw which represents the quasi methane budget espoused by the IPCC’s 5AR?
There is no reason to believe that scarcity of tropospheric –OH radicals has anything to do with growth in the level of CH4. Perhaps ongoing increase in the level of atmospheric CH4 has something to do with emissions associated with ocean warming and degradation of permafrost, particularly in Siberia?
Russ R:
Where are the uncertainty bars on the observed methane concentration time series?
Absent those, you can't really say that observed concentrations are below projected ones, since you can't exclude the possibility that the observed and projected spreads overlap.
gws @4.
Absolutely. Rough-and-ready to the power N. I had a go at the numbers with no idea what the result would be. If anything, I expected it to be far higher than 6%. However, that result does perhaps allow some sort of consideration of an upper limit to fugative leaks from fracking. True, the atmospheric CH4 balancing act does contain some big players and they will be noisy. But the numbers do suggest that some of the larger percentages for leaks being talked about (The leakage rates found for Bakken and Eagle Ford in the study discussed here is 9% &10%.) would make fracking itself one of those big players.
gws,
"Some work to do."
It appears we agree on this point.
Composer99,
You should address your question abut uncertainty bars to the IPCC, since it's their chart. Amusing how all of a sudden you grasp at any prospect of uncertainty to avoid accepting a completely obvious conclusion.
What's the word for that sort of thing?
[JH] Keep it civil or loose your privilege of posting on SkS.
Russ R:
You're the one asserting that (1) the IPCC has underestimated CH4 emissions and that (2) the degree of underestimation is significant or meaningful in some vague, ambiguous, can't-quite-spell-it-out-can-you kind of way.
So it's incumbent upon you to provide sufficient evidence to support your assertion.
So instead of playing rhetorical silly buggers, how about providing the figure number or section of the report that the graph appears in.
Composer99,
No... I'm saying the IPCC has overestimated either CH4 emissions, or residence time, or both. The observed methane concentrations (with uncertainty of ±4 ppb as of 2011) are sufficient evidence of this.
Here's the link to the figure:
And the chapter:
And the data table:
Enjoy.
[JH]
Please note that posting comments here at SkS is a privilege, not a right. This privilege can be rescinded if the posting individual treats adherence to the Comments Policy as optional, rather than the mandatory condition of participating in this online forum.
Please take the time to review the policy and ensure future comments are in full compliance with it. Thanks for your understanding and compliance in this matter.
I have a longer follow-up prepared, however global methane concentration is off-topic for this particular thread.
Any suggestions as to an appropriate thread? One of the 'IPCC models vs observations' threads, perhaps?
Russ, you are using a red herring tactic.
While it is true that our knowledge on methane atmospheric sources and sinks is limited in such way that we cannot yet explain in detail why global atmospheric methane is doing what it does, that does not diminish the facts that
Since such tactic is not tolerated here, I suggest you drop it and discuss the main contents of the article instead if interested. Thanks.
Russ wrote: "No... I'm saying the IPCC has overestimated either CH4 emissions, or residence time, or both."
You appear not to understand the difference between projections and predictions. A prediction is a description or depiction of expected future results. A projection is a depiction of future results based on a specific set of assumptions.
The chart you posted in #5 shows projections not, as you incorrectly stated, predictions. If we assume emissions at the A1B level then we get one projection of future atmospheric concentrations, but if we assume emissions at the A2 level then we get a different projection. If X then Y. Not, 'the result will be Z'. Indeed, the description of that chart in the report begins;
"Figure 1.6 | Observed globally and annually averaged CH4 concentrations in parts per billion (ppb) since 1950 compared with projections from the previous IPCC assessments."
Further, the text of the chapter you linked notes that actual emission levels from 1999 to 2006 were lower than the range of past trends used as the basis for projections in previous reports and that emissions are now rising again;
"As discussed in Dlugokencky et al. (2009), trends in CH4 showed a
stabilization from 1999 to 2006, but CH4 concentrations have been
increasing again starting in 2007 (see Sections 2.2 and 6.3 for more
discussion on the budget and changing concentration trends for CH4).
Because at the time the scenarios were developed (e.g., the SRES
scenarios were developed in 2000), it was thought that past trends
would continue, the scenarios used and the resulting model projections
assumed in FAR through AR4 all show larger increases than those
observed (Figure 1.6)."
Thus, everything you claim to be confused about is quite clearly explained in the source you claim to be working from.
CBDunkerson,
Very well... which of the three SRES scenarios shown above (A1B, A2, or B1) aligns most closely with the demographic, socio-economic and techological development path the world has followed since 1990?
Here's your reference: https://www.ipcc.ch/pdf/special-reports/spm/sres-en.pdf
[PS] Fixed link
Russ, I repeat the quotation from the IPCC report;
"Because at the time the scenarios were developed (e.g., the SRES
scenarios were developed in 2000), it was thought that past trends
would continue, the scenarios used and the resulting model projections
assumed in FAR through AR4 all show larger increases than those
observed (Figure 1.6)."
So, none of them aligns with methane emissions since 1990. Of course, you ask which of those scenarios best aligns with other factors... but that is obviously irrelevant to methane levels.
My best guess is that you are trying to 'prove' that the trend in methane emissions relative to economic development decreased for several years. However, as the IPCC report actually says that, I'm not sure what you think you have 'uncovered'.
CBDunkerson,
You're evading the question.
The SRES Scenarios are "If-Then" statements. If the world's population and economies play out a certain way, then emissions will be a certain amount. In your own words:
One again, and for the record, I'm saying that the IPCC overestimated methane emissions (for whatever scenario we can test), or residence time, or both. And they admit that they got the trend wrong.
So, as it stands today, methane is turning out to be not as big a climate issue as we were told it would be.
[JH] You assert that the IPCC admits "that they got the trend wrong" re methane emissions. Please document with specific source reference or references.
JH,
Projections > Observations.
Wrong.
[JH] You link to the pdf of a report that does not include a title page. What is the title of the report and when was it published?
Russ, you made a point, but your comments remain pushing a red herring.
While the natural sources in the global budget dominate, they are less constrained than the man-made sources. The review paper I suggested reading, which was published after the IPCC AR5 report, shows that the global wetland source is the one typically overestimated. Since the projections can only rely on the bottom-up models, and those are overestimating emissions mostly due to the natural wetland source, the projections are too high (models assume the wetland source to increase with increasing T).
The projection for the man-made sources was also slightly overestimated in the past, while the estimate for fossil fuel related emissions remained nearly constant (and the source was likely near constant in teh last 30 years), and one can speculate about why pre-AR5 projections did not take that into account (one reason is that most of this is very new research, not available before 2008). But that is irrelevant with respect to the renewed increase.
Using the fallacy of harking on a point at best remotely related to this article, you are seen as attempting to distract from the facts I outlined above. I consider that trolling and thus will not respond further to that line of "argument".
Moderator Response @21.
The document rather confusingly has the title "Introduction", it being Chapter 1 of IPCC AR5 WG1. I am at a loss as to the relevance of the point the commenter Russ R. is attempting to make. The IPCC themselves describe in that reference that estimates for as-then future CH4 emissions in AR4 were too low. Russ R. presents this as the IPCC being "wrong," saying "methane is turning out to be not as big a climate issue as we were told it would be." Yet I fail to see any "big climate issue" that has been mis-described. Whatever the point he attempts to make, the "issue" Russ R. describes can only amount to an underestimation in climate forcing of some 0.02Wm^-2 which is not what anybody would call "big" in climate terms.
[JH] Thank you for identifying the document. Not all of our readers are climate science-wonks who would recognize the document by merely viewing its content.
Re Russ R's modus operandi: As noted by gws @22, he/she seems to be fishing for red herrings. Some might call that trolling which is prohibited by the SkS Comments Policy.
Russ, yes. Methane emissions have been lower than assumed in the SRES projections.
Congratulations! You are correct!
Of course, we've covered this a few times now, the IPCC reports discuss it in detail, and it is one of the many reasons the SRES projections have been replaced. The assumption that future (at the time) methane emissions would follow past trends was incorrect. Thanks to the Montreal protocols, various CFCs have also had lower emissions than assumed in the SRES scenarios. Advancements in renewable energy are showing that industrialization and other energy use can be achieved without fossil fuels. Ergo, the links between population/technology growth and emissions, which previously were fairly consistent, are breaking down and different assumptions should be modelled.
That does nothing to change the greenhouse impact of methane or the fact that methane levels are now rising again.
UT released the next installment of their larger study with EDF, this time in ES&T; Press release here. One main finding: few large sources dominate the overall source sector (here: pneumatic controllers, liquid unloadings), aka non-normal distribution of sources, consistent with other findings presented in this series.
[JH] For future reference, please spell out names rather than use "naked acronyms" which many of our readers may not be familiar with.
In this particular case:
UT = University of Texas
EDF = Environmnetal Defense Fund
ES&T = Environmental Science & Technology