This is Global Warming - A Lesson for Monckton and Co.
Posted on 13 December 2012 by dana1981
To put it as simply as possible, this is global warming:

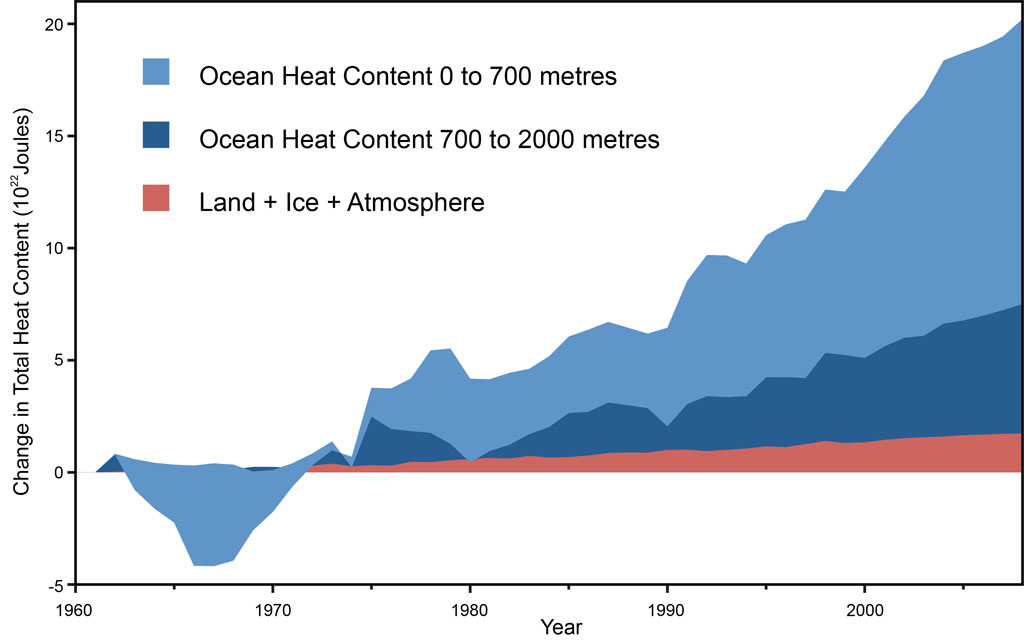
Figure 1: Land, atmosphere, and ice heating (red), 0-700 meter OHC increase (light blue), 700-2,000 meter OHC increase (dark blue). From Nuccitelli et al. (2012).
This figure shows the amount of heat the Earth has accumulated since 1960, most of which has gone into the oceans. The amount of energy accumulating in the oceans over this timeframe is the equivalent of more than two Hiroshima "Little Boy" atomic bomb detonations per second, every second, since 1960. And this global warming shows no signs of slowing.
However, the myth that global warming has magically stopped is a pervasive one, most recently repeated during a rather silly and disruptive stunt in the middle of an important international climate negotiation.
Monckton Misinforms. Again.
Christopher Monckton impersonated a delegate from Myanmar at the 2012 United Nations Framework Convention on Climate Change international meeting in Doha, Qatar. He sat in the Myanmar delegate's seat, was mistakenly called upon to speak, and recited two common pieces of misinformation — that the planet has not warmed over the past 16 years, and that mitigating global warming by reducing human greenhouse gas emissions is more expensive than adapting to the consequences of climate change. Neither point is even remotely true.
Monckton later elaborated on his points in a blog post on one of the many climate contrarian blogs praising his dishonest and disruptive antics, attempting to justify the 'no warming in 16 years' myth by claiming:
"There has been no warming – or, to be mathematically nerdy, there has been no statistically-significant warming."
Being "nerdy" usually means getting the technical details correct; instead, Monckton has gotten the technical details very, very wrong here. A simple example illustrates why.
A Simple Nerdy Statistics Example
Let's say there has been an observed warming trend of 1 degree with an uncertainty of 2 degrees, or in math terminology, 1 ± 2 degrees. In this example, the warming trend is not statistically significant (the uncertainty is larger than the trend). Quite obviously, this does not mean the temperature trend is zero; rather, this means the most likely value is 1, and the possible values range from -1 to +3 degrees.
We cannot say for certain that the temperature trend is positive in this example, but that is most likely the case, and it would be very wrong to claim with any certainty that the true trend is zero. But that is exactly the mistake that Monckton has made here by claiming "there has been no warming". That is simply wrong, as any math nerd will tell you.
Similarly, the measured global surface warming trend over the past 16 years is approximately 0.09 ± 0.13°C per decade according to NASA, as anyone can check for themselves by using the Skeptical Science Temperature Trend Calculator. The surface warming is not statistically significant — again, the uncertainty is larger than the trend, and possible values range from -0.04 to +0.22°C per decade. However, the most likely value is still a positive one, meaning the Earth's surface has most likely warmed 0.09°C per decade, or 0.14°C total for the period of late 1996 thorugh late 2012.
Zero warming is one possibility within the range of uncertainty, but it would take a different statistical test to show that there has been no surface warming over the past 16 years, and that test would fail.
Pielke Sr. vs. Monckton — Earth is 
The Earth isn't flat; it's more than just a surface, and global warming is not accurately represented just by looking at surface temperatures. As climate contrarian scientist Roger Pielke Sr. correctly noted,
"The use of a global annual average surface temperature is an inadequate metric to quantify global warming and cooling."
In fact, over 90% of global warming goes into heating the Earth's oceans (Figure 2).
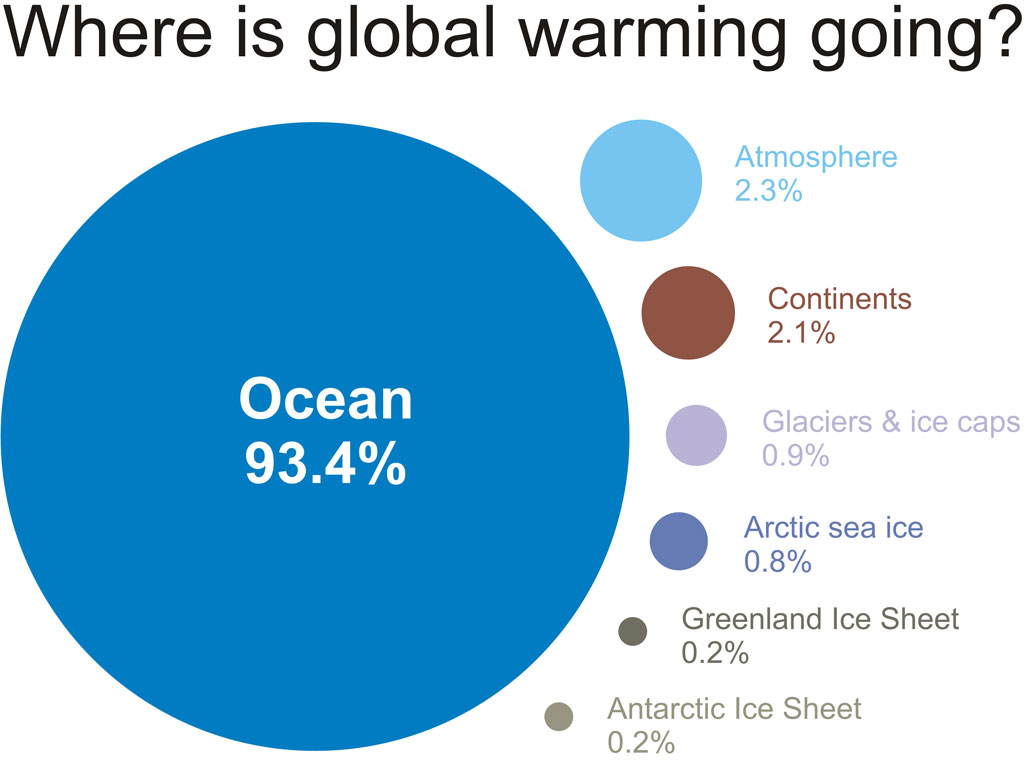
Figure 2: Components of global warming for the period 1993 to 2003 calculated from IPCC AR4 5.2.2.3.
This is why Pielke Sr. also argued that global warming "is best diagnosed by changes in upper ocean heat content". We don't quite agree — we believe that global warming is best diagnosed by considering all warming measurements including both surface warming and ocean heat content, as shown in Figure 1 above. Nevertheless, Pielke Sr. is correct to note that ocean heat content is a critical measure of global warming, as Figure 2 shows. Perhaps he should have a talk with Monckton to correct this Flat Earth thinking.
Monckton vs. Monckton
There is also a fundamental physical reason why we know global warming has not magically stopped: there is a global heat imbalance due to the increased greenhouse effect, and that heat has to go somewhere. In fact, a fellow going by the name of Christopher Monckton previously conceded this physical reality:
"Is there a greenhouse effect? Concedo. Does it warm the Earth? Concedo. Is carbon dioxide a greenhouse gas? Concedo. If carbon dioxide be added to the atmosphere, will warming result? Concedo."
Perhaps that Monckton should have a word with this Monckton, who is denying the physical reality that global warming has resulted from the increased greenhouse effect.
Mitigation is Cheaper than Adaption
Finally, we must briefly address Monckton's second myth, that adapting to the consequences of climate change will be cheaper than mitigation by reducing greenhouse gas emissions. This is an assertion Monckton has been making for a very long time, which we have debunked many times, for example here and here and here. The sole peer-reviewed economics study which Monckton has referenced to support his argument was published by Richard Tol in 2009. Tol is one of the most conservative economists when it comes to estimating future economic damage from climate change. Nevertheless, this is what Tol said in the paper Monckton cited (emphasis added):
"A government that uses the same 3 percent discount rate for climate change as for other decisions should levy a carbon tax of $25 per metric ton of carbon (modal value) to $50/tC (mean value). A higher tax can be justified by an appeal to the high level of risk, especially of very negative outcomes, not captured in the standard estimates"
Thus even the most conservative economists like Richard Tol and William Nordhaus support mitigating climate change by putting a price on greenhouse gas emissions, quite contrary to Monckton's argument. This is because trying to adapt to the consequences of climate change will be trillions of dollars more expensive than avoiding global warming by reducing greenhouse gas emissions (Figure 3). There is simply no credible evidence to the contrary, and yet Monckton continues to repeat this myth over and over again.

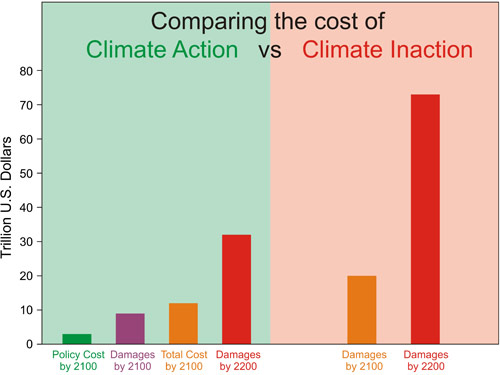
Figure 3: Approximate costs of climate action (green) and inaction (red) in 2100 and 2200. Sources: German Institute for Economic Research and Watkiss et al. 2005
Lessons Learned?
There are two lessons to be learned here. The first is that anybody who claims 'global warming has stopped' does not understand basic math and may be a member of the Flat Earth Society, because they seem to believe that the Earth's surface is an accurate representation of the planet as a whole. In reality, most global warming goes into the oceans, and ignoring the two Hiroshima atomic bomb detonations per second equivalent of ocean heat accumulation over the past half century is quite a large oversight.
The second is that anybody who claims adapting to climate change will be cheaper than preventing it is in denial of the body of climate economics research.
Ultimately Monckton was escorted out of the UN Doha conference by security personnel. Lucky for him that there are no Science Police, for if there were, his misinformation would certainly have earned him a ticket.

Arguments


Every day that passes shows just how delusional he is, and it may be time to treat him just like a troll. Take away his oxygen by ignoring him.
Are the faithful still waiting for Monckton's Miracle Cure for AIDS, MS and (no doubt) the common cold to materialise?
A lecturer at our local university wrote a letter to the Wagga Advertiser pointing out that this was a rather silly thing to do. Monkton of Brenchly replied with a typically arrogant tirade, beginning "A Mr White wrote ..."
Below is a letter I have written in response, which may or may not get published. It has no literary merit but, perhaps, suggests a way in which we should deal with this person.
A Mr Monkton has recently written to your paper (11 December) in response to a letter about Global Warming from Dr Graeme White.
We are indeed fortunate to have the benefit of Mr Monkton’s opinions. As he so ably demonstrated in his letter he has such great expertise in this area that he was able, without the need for evidence, to simply dismiss Dr White’s arguments. In fact we have it on Mr Monkton’s own say so that his expertise in this area ranks with that of Albert Einstein because both of them have written a paper that was not peer reviewed.
But not just expertise in science. He has such a deep knowledge of economics that he can wave away the opinions of the great majority of economists who support carbon pricing, such an all-encompassing understanding of logic that he can spell Aristotle and such mastery of mathematics that no other mathematician can understand his calculations.
Could this possibly be the same Monckton who has variously said that he is a member of the House of Lords, that he is the proud owner of a self awarded Nobel Peace Prize, the discoverer of a single cure for AIDS, colds and influenza and the man who has been able to prove mathematically that Barack Obama’s birth certificate is a fake.
No wonder he has added Dr White to the long list of people who deserve to be sued for ever questioning his obvious truthiness.
We in Wagga are truly blessed that the DLP has been able to attract such an intellectual giant, such a great polymath, such a paragon of the British aristocracy to our humble town.
Thanks for turning my attention to this "Democratic Labor Party" in Wagga. I didn't know about it either. With just one MP in Senate, they cannot make any difference to the political scene. After having invited this monkey clown calling himself a "lord" to perform another silly stunt (like those he performed in Doha and last year in Durban), their rating should drop even lower and we should see them losing the lonely seat soon.
We can ignore Monckton but the unfortunate fact is he seeks and get attention because of his outlandish behaviour, which suits his backers down to the ground.
He is about to tour Australia and New Zealand again so it is most important that his fraudulent science is “again” exposed.
Like malamuddy did, one way to deal with Monckton is to point out the fantastical claims he has made over the years, like swearing out an affidavit claiming he has evidence concerning the birth certificate of the President of the United States.
Indeed, the whole association of US climate denial with Creationism and birtherism is a gift that can keep on giving. It highlights the whole refusual to face evidence and facts that undermine a favoured ideology.
Monkton is an hereditary viscount and therefore perfectly entitled to call himself a lord. However hereditary lords are not automatically members of the House of Lords - they have elections and Monkton has never won a seat.
Monkton likes to conflate the two issues - what a surprise - and wave his passport around to prove he is a viscount.
How's that Monckton Cure for AIDS doing?
Lord Monckton:
"I've discovered a cure for HIV!"
~ ~ ~ ~ ~ ~ ~
Though it sure would be fascinating to see the Lord's email exchanges with the blokes who have financed that fancy looking website.
~ ~ ~ ~ ~ ~ ~
(sniped ad hominen)
I don't expect you to do requests, but I have to say a post testing the 'no warming for 16 years' hypothesis would really useful. Deniers play tricks with words, and 'no statistically significant warming' has morphed into 'no warming'. A go to reference to demonstrate that fails would be really useful.
Thanks for the R Pielke snr quote. Conflating surface temperatures with global warming is the corollary to 'no warming' and is all the rage amongst deniers at the moment.
From about 1940 to 1970 there was global cooling due to the widespread presence of sunlight-reflecting aerosols in the atmosphere.
As such I expect the net energy content of the Earth was decreasing during that time frame.
By 1970 increased environmental regulation, combined with the overpowering of the aerosol forcing by greenhouse forcing - and voilà! Warming.
Also the dips around 1980-83 and 1990-93 correspond to the eruptions of Mt El Chichon in 1982 and Mt Pinatubo in 1992. The data has a pentadal (5 year) smoothing so that spreads out the effect a bit.
As for ENSO ocean heat exchanges, I don't know that the data resolution is good enough to see that. Especially since it's a 5-year running average, so it's somewhat smoothed out.
These are comments in "Vote for a Carbon Tax" (from CP) copied into a local paper's blog.
http://www.athenstalks.com/vote-carbon-tax?page=1#comment609478
@catman: From the linked article (this article):
"Similarly, the measured global surface warming trend over the past 16 years is approximately 0.09 ± 0.13°C per decade according to NASA, as anyone can check for themselves by using the Skeptical Science Temperature Trend Calculator. The surface warming is not statistically significant — again, the uncertainty is larger than the trend, and possible values range from -0.04 to +0.22°C per decade. However, the most likely value is still a positive one, meaning the Earth's surface has most likely warmed 0.09°C per decade, or 0.14°C total for the period of late 1996 thorugh late 2012.
Zero warming is one possibility within the range of uncertainty, but it would take a different statistical test to show that there has been no surface warming over the past 16 years, and that test would fail"
Am I misinterpreting this? Do these two paragraphs basically say, "we don't have statistical proof of warming, but that doesn't mean it isn't getting warmer"??? "most likely warmed 0.09C" Not even a tenth of a degree, and only "most likely" at that. Hell, I wasn't even denying the idea of temperature increases, but this is making me wonder more about that.
When I looked into the data supporting global warming a while back, I came away convinced of two things: average global temperature has risen since 1958; and average global CO2 has risen since 1958. Figuring out which is cause or consequence of the other seemed speculative. Further speculation seemed necessary to affirmatively say that human activity has created warmer climates.
This link offers perhaps the most compelling evidence for global warming:
http://www.skepticalscience.com/empirical-evidence-for-global-warming.htm
However, there is still no direct link between human activity and temperature. It is all peripheral: A has increased since time x. B has increased since time x. B is proven to trap heat. Therefore, humans have affected the increase in A. That doesn't add up.
Also, one has to enter the debate under the pretense of one specific time period: 1958 - to present. CO2 records prior to 1958, or otherwise prior to "industrialization" are measured using polar ice core air bubbles. This scientist argues that such methods of measurement are inaccurate:
http://www.john-daly.com/zjiceco2.htm
Additionally, if you look at year-by-year comparisons of average temperatures and average atmospheric CO2, you will see disproportionate peaks and valleys between the two. That is to say that years with exceptionally high CO2 levels do not always coincide with high-temp years. Year-by-year, it's hard to make the connection. But if you take the averages over the past 50 years you get the matching hockey stick graph.
And that's assuming that the polar ice core measurements are true, despite the aforementioned argument that the displacement of water in ice makes the measured levels skewed.
Again, I think it's a no-brainer to go with solar, hydro and nuclear (though the last one isn't my favorite). However, creating new taxes will neither solve the problem in time to save the Earth, nor will it actually push anyone to renewable sources. Until fossil fuel sources become so scarce that the cost skyrockets the shift probably won't happen. If these companies get taxed for carbon emmissions, they will just keep on keepin' on and pass the buck to the consumer. Kinda like smokers do with cigarettes.
[DB] Perhaps you must have overlooked this recent post, still visible at left in the listing of recent posts:
http://www.skepticalscience.com/agu-2012-solving-climate-problem.html
Additionally, some of the authors over at Skeptical Science have published posts on personal solutions that the everyday person can do:
http://www.skepticalscience.com/Evidence_That_Demands_a_Response.html
http://www.skepticalscience.com/news.php?n=848
http://www.skepticalscience.com/Climate-Solutions-by-Rob-Painting.html
http://www.skepticalscience.com/Climate-Solutions-by-Daniel-Bailey.html
Suggestion: less attitude and less kvetching; better dialogue is engendered with better attitudes and comment construction.
More Arctic melting? Less temp difference between equator and northern waters? More energy dumping into Atlantic storms so wetter UK summers? or is just going to reach some pressure point and blow?
Are there any predictions? papers exploring hot seas?
I'm off to do agricultural work in the heart of climate vulnerable Bangladesh- cyclone numbers appear to be much the same year on year and where I'm going it floods every year- sometimes twice from spring melts and monsoons [but this increase may be due to poor river management]. So what are the trends for warmer seas?
Thanks if you can direct me.
Jules
I was more curious on the larger physics level- will surface temperatures suddenly catch-up with accelerated warming in the coming decade? Or -will the seas just keep absorbing the heat? Are there physical limits?
One personal observation is more ocean warming 'seems' to correlate to reduced ENSO activity. To a layman this seems back to front- I really am speaking from ignorance here- but ENSO 'appears' to be a balancing out of heat build up- energy in energy out- so why has the last 16 years been so quiet.
Monckton has misrepresented himself as a member of the house of lords, a nobel laureate, Margaret Thatcher's science advisor, an expert on climatology, and now a diplomat from Myanmar.
He also promises to release his miracle cure for Graves’ disease, multiple sclerosis, influenza, herpes simplex VI, AIDS, and who knows what all else any day now if people will just keep sending him more money to help 'bring it to market'.
So... in what way is he not a professional con man? A snake oil salesman. Flimflam artist. Scammer. Swindler. Grifter.
I'm assuming there must be something which does separate him from those categories because he's never been arrested for it, but darned if I can puzzle out what it is.
So far, you act as if you believe in AGW ("Help! Can someone please straighten out this (possibly) local skeptic?") and yet what you do instead is to repeat a series of lame, flawed denial memes. The two approaches don't fit together. So which is it?
Beyond that, you could learn more about all of this yourself, without the need for me or anyone else to direct you. This entire site is built on a database of denial lies (politely called "arguments") and clear, explanatory rebuttals. Use the links and the search boxes, and learn about this stuff yourself, before posting embarrassing nonsense.
[P.S. If I sound ticked off, I am, because the "oh, I believe in AGW, but I have this skeptic friend, and what about..." approach to placing misleading comments is getting very, very tiring.]
"will surface temperatures suddenly catch-up with accelerated warming in the coming decade?"
Temperature increase follows the forcing agent nature and trajectory. For global temps, we are currently on an accelerating trajectory because GHGs (mostly CO2) are. So, I guess the answer is likely 'yes', with the caveat that local temps are not global temps.
"will the seas just keep absorbing the heat?"
there is, to first degree, no reason to think that the distribution of increasing heat content (see Fig. 1 above) will change
"Are there physical limits?"
yes and no; mostly on CO2 abundance due to buffering by the ocean and its contact with carbonate rocks, but that won't stop possibly catastrophic warming.
Not sure what you meant by "ENSO ... last 16 years been so quiet". We had more La Ninas instead of El Ninos, is that what you meant?
The ENSO question for me is the 'apparent'[I use that just because what appears to a layman to be this or that is neither here nor there] increased frequency of cool la ninas and no hot el ninos. I am sure someone will correct me but if the ocean has heat how come it is not on the heat[or having more intense] el ninos cycle. The first question is really what will happen to ocean heat- is it a heat sink that will give up its energy- will it just continue to absorb more energy- will it mainly just defrost the Arctic? [btw I am familiar with the CO2-ghg- surface temp data].
The ENSO is best described as an aperiodic variation, somewhat chaotic in nature: it doesn't cycle back and forth at regular intervals, and there are significant stretches more heavily El Nino as well as La Nina.
The Southern Oscillation Index (SOI) is perhaps our longest direct observation of the ENSO; it is defined as the difference between sea surface air pressure anomalies at Tahiti and Darwin. Note that in the SOI higher values are La Nina's, and lower values are El Nino's - flipped relative to the more common representations:
[Source]
It should be clear from this that the recent prevalence of La Nina's is not at all unusual - the 1990's, for example, consisted mostly of El Nino's, while much of the 1950's through 1970's La Nina was more common.
Boiling off the ocean (equivalent to a runaway GHE) is very unlikely to happen for several reasons, such as
1. Unless positive feedbacks to anthropogenically emitted CO2 are larger than expected, FF derived CO2 forcing and associated T changes are limited to FF "availability",
and
2. ocean carbonates are buffering atmospheric CO2 over 1000s+ of years, so as long as an ocean is present with sedimentary carbonates (such as at depth), CO2 uptake into it slows (and limits) atmospheric increase
Problem is, neither of these limits is likely to limit atmospheric CO2 to a level palatable to today's society and environment, hence the concern.
"The 16-year temperature stasis that has now occurred must be explicitly faced."
and:
"one might argue that the relatively weak warming signal from CO2 has been overlain by three recent natural influences: in late 2001 we entered a ~30-year cooling phase of the ~60-year cycle of the ocean oscillations; the current ~11-year solar cycle displays near-unprecedentedly weak solar activity, implying the possibility of a Dalton or even Maunder minimum in the coming decades; and there has recently been a double-dip La Niña."
So, for arguments sake i'll make a perhaps bold assumption that the above quotes are believable.
That means that with 3 theoretically cooling influences referred to currently in play, we are in a "temperature stasis", not measurably cooling as i would expect.
The question is then, what's keeping us warm if not CO2 and what happens when CO2 levels are higher than now, and there is strong solar activity, and we are in a warming phase of the 60 year cycle of ocean oscillations, and there is an El Nino??
Thinking things through viz. climate is not Monckton's forte.
I believe you have hit the nail on the head with:
which Monckton clearly has not let disturb his mind.
I find these "16-year" claims simply appalling, personally. I would like to point out certain aspects of the data:
[Source, using HadCRUT4]
The last 16 years or so appear rather flat (at least for HadCRUT data, not so much for GISTEMP), but 16 years is too short a time period for statistical significance. A quick check is to look at the trends for 17 or for 15 years, and note significant differences - a sign of a not too robust conclusion.
Even more importantly, consider that last 16 years (cherry-picked to start with a very strong El Nino, ending with several La Nina's) with respect to the rest of the data. The 22 year trend 1975-1997 is ~0.16°C/decade. If you include the data to the present, if you include the 16-year "no-warming" trumpeted by Monckton, the 1975-present trend is 0.17°C, a higher trend than that of the first 22 years!
In other words, if you look at enough data for significance, you see that even the claimed "no warming" data is still showing an accelerating trend - and that Moncktons claim is simply an artifact of deliberately cherry-picking from the noise.
And for the 90th time, surface temp is about the least useful of measures of global warming (Hadley in particular). Show me the parallel hiatus in OHC (steady as she goes) and global ice mass loss (loss accelerated).
Next, lets compute the trend from 1997 (the start of the "hiatus"), which turns out to be 0.090 ±0.232 °C/decade (2σ). This is clearly not statistically significant as a zero trend lies within the confidence interval.
However, the long term trend of 0.138 °C/decade also lies well within the confidence interval, so the observations are also consistent with there having been no hiatus in warming, but just steady warming at 0.138 °C/decade with some perturbations superimposed on it due to e.g. ENSO.
Furthermore, the long term trend of 0.138 °C/decade is closer to the estimated trend than a zero trend is, so the continuation of the long term trend is marginally more consistent with the observed trend than a hiatus.
Essentially Monckton is making a statistical error in thinking that the lack of statistically significant warming implies that there is statistically significant evidence for stasis. The statistics are equivocal, they rule out neither a continuation of the underlying warming trend, nor the existence of a hiatus in warming. The difference between the scientific mainstream and the skeptics on this is that mainstream scientific opinion on AGW is not predicated solely on a 16 year trend (there are many other lines of evidence e.g. OHC and a lot of basic physics), whereas the existence of a hiatus is predicated pretty much purely on the lack of a statistically significant warming.
60 years before 1998 it was 1938, so i'd say that was in the last "cooling phase of the ~60-year cycle of the ocean oscillations".
from a chart here:
it looks to me like around then we were also, broadly speaking, in a similar stage of low or decreasing solar activity.
So, for arguments sake i will assume that the decade following 1938 has similar conditions in regard to solar and ocean "cycles" to what Monkton is claiming for the 1998 to now period.
from a chart here:
It appears that the temperature records show a quite rapid cooling over a decade or so. That's something i have seen on a lot of the charts depicting temp in the 20th century.
Regardless of how different people treat the data, that didn't happen post 1998. Implies to me that there is some other factor at play now compared to then and the warming effect increased of CO2 levels would seem to be one of the candidates.
My conclusion from this and reading other people posts here on this issue that really do make sense to me: Lord Monkton is perhaps not quite as smart as he thinks he is, and the most polite thing i can say about it is that he has rather blatantly shot himself in the foot with his published justifications for "16 years with no warming".
There seems to be a certain amount of moving of goalposts going on here: for years we were beaten over the head with the hockeystick, which, is I believe, a surface temperature graph, only to be told now that ocean warming is far more significant. The arguments for this above look plausible.
But ocean warming seems always to be expressed as change in heat content. I'm wondering what these figures for the extra heat content translate into as a temperature rise. My guess is it's quite a bit less than the surface temperature anomaly. Then , considering the area and depth of the seas, isn't this data vulnerable to measurement and calibration problems? Just what are the error bars on ocean warming?
This is why objective tests of statistical significance are a useful sanity check. In this case, the observations don't rule out the existence of a plateau, but they don't rule out a continuation of warming at a constant rate either. This is most probably simply due to the fact that there is too little information over that period to be able to draw any strong conclusion either way. In fact, for so short a period, it isn't really all that surprising that there should be the occasional plateau. So the best thing to do is to keep an open mind about it, but also to consider all of the relevant information.
As to hockey sticks, I suspect that it would be difficult to produce as good a proxy for ocean heat content as we can for surface temperatures, which is why we don't have (AFAIK) an ocean heat content hockey stick. We can only draw conclusions from the data we actually have, so there is no goal post shift there, just that we have modern data for OHC, but not for pre-industrial OHC.
Could you kindly tell me exactly who has been beating you over the head with "the hockey stick?" The only places I ever see it mentioned are denial factories like WUWT and climateaudit. They go on and on about it as if it is the foundation of all of climate science.
I don't even see it mentioned anywhere else -- certainly not in the main stream media, very rarely here at SkS, etc.
The world has moved on. Ocean heat content is soaring. Arctic ice melt, total ice mass loss, global temperature observations, extreme weather events, TOA imbalance measurements, paleoclimate sensitivity studies... all of this and more has been going on.
Hockey stick? Not so much. If you've been beaten over the head with the hockey stick, which was created way back in 1998/1999 (13 years ago) as one graphic in one paper on paleoclimate, as evidence of an issue which is no longer a question in the debate (i.e. whether or not global temperatures have been warming at an unusual rate since 1979), then it speaks more about the web sites and media that you (as "not a denialist") have been visiting and watching, than it does about the actual progress and position of the science today.
Cooling Down the Fears of Climate Change
Evidence points to a further rise of just 1°C by 2100. The net effect on the planet may actually be beneficial.
(-snip-).
A version of this article appeared December 19, 2012, on page A19 in the U.S. edition of The Wall Street Journal, with the headline: Cooling Down the Fears of Climate Change.
Cooling Down the Fears of Climate Change.
Evidence points to a further rise of just 1°C by 2100. The net effect on the planet may actually be beneficial
Summary:
Observations now allow accurate forecasting of ratio of warming / CO2 buildup. IPCC will publish the new estimates which are 1-1.5 degree C for a doubling of CO2 over the next 100 years vs. 3+ degree C in former IPCC models. No need to do anything to prevent this.
Neither Ridleys claims on sensitivity nor his feelings about "beneficial" are supported in the actual literature, and I can only suspect that he and Lewis have misread the various publications, including the IPCC AR4 and the (pre-publication draft) AR5.
I would suggest reading climate sensitivity is low to see what the science says - ~3C/doubling of CO2 - and positives and negatives of global warming regarding the impacts. Those are summaries; read the primary literature linked therein for details.
Rather than taking (IMO) what are just ideological polemics as gospel...