


 Arguments
Software
Resources
Comments
The Consensus Project
Translations
About
Support
Arguments
Software
Resources
Comments
The Consensus Project
Translations
About
Support
![]()
![]()
![]()
![]()
![]()
![]()
![]()
![]()
![]()
![]()


![]()


Latest Posts
- Skeptical Science New Research for Week #13 2025
- Climate skeptics have new favorite graph; it shows the opposite of what they claim
- Sabin 33 #21 - How does production of wind turbine components compare with burning fossil fuels?
- China will need 10,000GW of wind and solar by 2060
- 2025 SkS Weekly Climate Change & Global Warming News Roundup #12
- Skeptical Science New Research for Week #12 2025
- Climate Fresk - a neat way to make the complexity of climate change less puzzling
- Sabin 33 #20 - Is offshore wind development harmful to whales and other marine life?
- Do Americans really want urban sprawl?
- 2025 SkS Weekly Climate Change & Global Warming News Roundup #11
- Fact brief - Is waste heat from industrial activity the reason the planet is warming?
- Skeptical Science New Research for Week #11 2025
- Visualizing daily global temperatures
- Sabin 33 #19 - Are wind turbines a major threat to wildlife?
- The National Hurricane Center set an all-time record for forecast accuracy in 2024
- 2025 SkS Weekly Climate Change & Global Warming News Roundup #10
- Fact brief - Is Greenland losing land ice?
- The Cranky Uncle game can now be played in 16 languages!
- Skeptical Science New Research for Week #10 2025
- Climate Adam: Protecting our Planet from President Trump
- Sabin 33 #18 - Can shadow flicker from wind turbines trigger seizures in people with epilepsy?
- Cuts to U.S. weather and climate research could put public safety at risk
- 2025 SkS Weekly Climate Change & Global Warming News Roundup #09
- Fact brief - Are high CO2 levels harmless because they also occurred in the past?
- Skeptical Science New Research for Week #9 2025
- Is CO2 plant food? Why are we still talking about this?
- Sabin 33 #17 - Does low-frequency noise from wind turbines cause 'wind turbine syndrome'?
- Electric vehicle adoption is stumbling, but still growing amid geopolitical clashes
- 2025 SkS Weekly Climate Change & Global Warming News Roundup #08
- Skeptical Science New Research for Week #8 2025
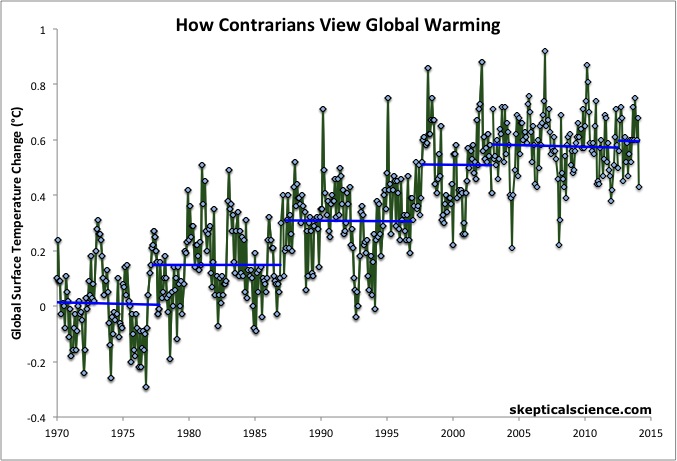
The Escalator
For a video version with data updated through 2016, click here.
For a GIF-version with data including 2022, click here.
One of the most common misunderstandings amongst climate contrarians is the difference between short-term noise and long-term signal. This animation shows how the same temperature data (green) that is used to determine the long-term global surface air warming trend of 0.16°C per decade (red) can be used inappropriately to "cherrypick" short time periods that show a cooling trend simply because the endpoints are carefully chosen and the trend is dominated by short-term noise in the data (blue steps). Isn't it strange how six periods of cooling can add up to a clear warming trend over the last 4 decades? Several factors can have a large impact on short-term temperatures, such as oceanic cycles like the El Niño Southern Oscillation (ENSO) or the 11-year solar cycle. These short-term cycles don't have long-term effects on the Earth's temperature, unlike the continuing upward trend caused by global warming from human greenhouse gas emissions.
The data (green) are NASA GISS monthly global surface temperature anomaly data from January 1970 through December 2014, with linear trends for the short time periods Jan 1970–Oct 1977, Apr 1977–Dec 1986, Apr 1987–Oct 1996, Aug 1997–Dec 2002, Jan 2003–Jun 2012, and Jul 2012–Feb 2014 (blue), and also showing the far more reliable linear trend for the full time period (red).
Note: the concept of the Escalator (as well as the term 'going down the up escalator') was first proposed by Bob Lacatena.
SkS Resources that use this Graphic
- Global Surface Temperature: Going Down the Up Escalator, Part 1
- Going Down the Up Escalator, Part 2
- Still Going Down the Up Escalator
- Climate of Doubt and Escalator Updates
- Climate of Doubt Shines a Light on the Climate Denial Movement
- Temperatures Continue Up the Escalator
- Did Global Warming Stop in 1998, 1995, 2002, 2007, 2010? (intermediate)
- Did Global Warming Stop in 1998, 1995, 2002, 2007, 2010? (basic)
- The Big Picture
- The BEST Summary
- Temporarily Frozen Planet, Permanently Frozen Objectivity
- Updating the Climate Big Picture
- A Big Picture Look at Global Warming
- Global Warming: Trend and Variation
- Lessons from the Whitehouse-Annan Wager
- NASA scientists expect more rapid global warming in the very near future (part 1)
- The Latest Denialist Plea for Climate Change Inaction
- Richard Alley's Escalator
- Unpicking a Gish-Gallop: former Greenpeace figure Patrick Moore on climate change
- Vanishing Arctic Sea Ice: Going Up the Down Escalator
- Pielke Sr. Misinforms High School Students
- Fred Singer - Not an American Thinker
- Misleading Daily Mail Article Pre-Bunked by Nuccitelli et al. (2012)
- Michaels Misrepresents Nordhaus and Scientific Evidence in General
- Cherrypicking to Deny Continued Ocean and Global Warming
- UK Secretary of State for the Environment reveals his depth of knowledge of climate change (not!)
- 4 Hiroshima bombs worth of heat per second
- The climate change policy discussion I wish Andrew Neil would have on BBC
- Arctic sea ice delusions strike the Mail on Sunday and Telegraph
- How to use short timeframes to distort reality: a guide to cherrypicking
- Does the global warming 'pause' mean what you think it means?
- The 2012 State of the Climate is easily misunderstood
- In pictures: cutting edge climate science, communication, and kittens from the 2013 AGU conference
- 2013 in Review: a Productive Year for Skeptical Science
- Climate scientist Dessler to US Senate: 'Climate change is a clear and present danger'
- Sen Whitehouse Schools Sen Inhofe about Global Warming on the Senate Floor
- Global warming made 2014 a record hot year – in animated graphics
Images
Printable Version | Back to Graphics by Skeptical Science
|
|
Skeptical Science Graphics by Skeptical Science is licensed under a Creative Commons Attribution 4.0 International License. |


THE ESCALATOR

(free to republish)