


 Arguments


Are glaciers growing or retreating?
What the science says...
| Select a level... |
 Basic
Basic
|
 Intermediate
| |||
|
Most glaciers are retreating, posing a serious problem for millions who rely on glaciers for water. |
|||||
Climate Myth...
Glaciers are growing
“[R]eports are coming in from all over the world: for the first time in over 250 years, glaciers in Alaska, Canada, New Zealand, Greenland, and now Norway are growing.”(JamulBlog)
At a glance
Glaciers are wonderful things, as any high mountain-climber will agree. Trekking up a glacier at sunrise to reach the start of a climb is one of the truly awesome experiences in mountaineering. They also act as vast cold-storage facilities, capturing and holding winter snowfall. People, animals and crops in the valleys below benefit from this meltwater supply when the warmer season arrives. That makes them really important. So let's take a look at what makes glaciers tick.
Glaciers form when perennial snow-cover starts building up, year upon year. Freeze-thaw cycles and compaction gradually turn the accumulated snow into glacial ice. The process takes years and for the glacier to survive, conditions need to remain cold, with a continual ample supply of new snow, year in year out, over the decades.
Because a glacier is a slow-moving river of ice with its motion driven by gravity, it will typically exhibit a distinctive set of physical features. There will be the break-line along which it pulls away from its headwall. This is marked by a system of large crevasses that divide the moving ice below from the static ice above.
Crevasses also form in the moving part of the glacier where the ice undergoes flexure and splits. Such features are commonest where a glacier is flowing over uneven ground or is rounding a bend. Where a glacier encounters a major steepening in its downhill course, it will break up into a chaotic system of unstable, crevasse-bounded blocks known as an ice-fall.
For a glacier to be stable, snowfall needs to be in balance with 'ablation'. Ablation is the term that covers the ways in which a glacier loses its snow and ice. If the glacier is going to endure, snow gain clearly has to be at least equal to ablation. Forms of ablation include surface melt, meltwater run-off, strong winds blasting snow away, sublimation (solid to vapour direct transition) and avalanches. In addition, ablation can also occur within and beneath a glacier. When meltwater is running along beneath the ice, it acts as a lubricant, so the glacier's flow may suddenly speed up, or surge, as it's called.
With any glacier, its status in terms of whether it is gaining or losing mass is termed its 'mass balance'. Mass balance is a mathematical expression of whether a glacier is retreating or advancing. It is based on various careful and long established measurement techniques, Unfortunately, mass balance measurements tell us that a very high percentage of Earth's mountain glaciers are in retreat. It is wrong to single out the few glaciers that are growing in the face of the overall trend of steep decline, in order to argue there is no global warming. It's the scientific sin of cherry-picking.
Please use this form to provide feedback about this new "At a glance" section, which was updated on May 27, 2023 to improve its readability. Read a more technical version below or dig deeper via the tabs above!
Further details
Compared to the great ice sheets of Antarctica and Greenland, mountain glaciers make up a small fraction of global ice volume. The figure is less than 1%: if they all vanished the resulting amount of global sea level rise would be around 0.32 metres. Of much greater importance is their role as freshwater storage reservoirs and their potential loss represents a serious threat to countries where this water supply is regarded as vital.
Glaciers occur in the higher mountain ranges worldwide and at lower altitudes in the higher latitudes, meaning they exist within a range of climatic conditions. The processes that determine their behaviour over time are recorded on an ongoing basis, both on the ground and remotely via satellites and as our understanding of such things improves, we are able to model that behaviour with greater and greater accuracy.
Mass balance of glaciers is measured through a variety of techniques. Direct glaciological methods include deployment of ablation stakes, graduated rods inserted several metres into an augered hole in the ice. The distance from the top of the stake to the surface of the ice is recorded and then the site is revisited at regular intervals for repeat measurements to see how much ablation has occurred. In the accumulation zone, above the Equilibrium Line Altitude, snow pits and snow probing are utilised to find out the amount of accumulation in a similar, regular manner.
To figure out the mass balance of a glacier, regularly-spaced traverse lines, with regular-spaced stakes or pits, are set out across its width. These data are then combined with independent geodetic surveys, using tools like the satellite-based Global Positioning System – GPS – and is collated and published by the World Glacier Monitoring Service (WGMS).
Monitoring glaciers has a long pedigree. Collection of data about ongoing glacier changes began in 1894, with the foundation of the International Glacier Commission at the 6th International Geological Congress in Zurich, Switzerland. Back then, the focus was on the idea that long-term glacier observations would give insight into processes of climatic change, but of a different kind - the formation of ice ages. As can be imagined, the goals of international glacier monitoring have since evolved and expanded.
The WGMS took over the curation of such data - standardised observations on changes in mass, volume, area and length of glaciers with time - in 1986. Within the data, it is not surprising that the highest information density is with regard to the Alps and Scandinavia, easily accessible to Europeans for over a century so that long and uninterrupted records are available. But in more recent decades, data coverage has spread around the world, so that the highest quality glacier observations are ongoing, continuous and long term.
Today, the WGMS is pushing towards reaching global coverage from space-borne geodetic surveys. These geodetic observations can provide geodetic mass changes over decadal to multi-annual time periods but are hampered at shorter time scales by the required density conversion. The glaciological method is able to fill this gap by providing mass-balance observations with annual or seasonal resolution.There are 30 glaciers in 9 different mountain ranges that have seen special attention, having been continuously measured since at least 1950 and are considered 'reference glaciers'. Figure 1 shows the annual mass change of reference glaciers monitored since 1950.
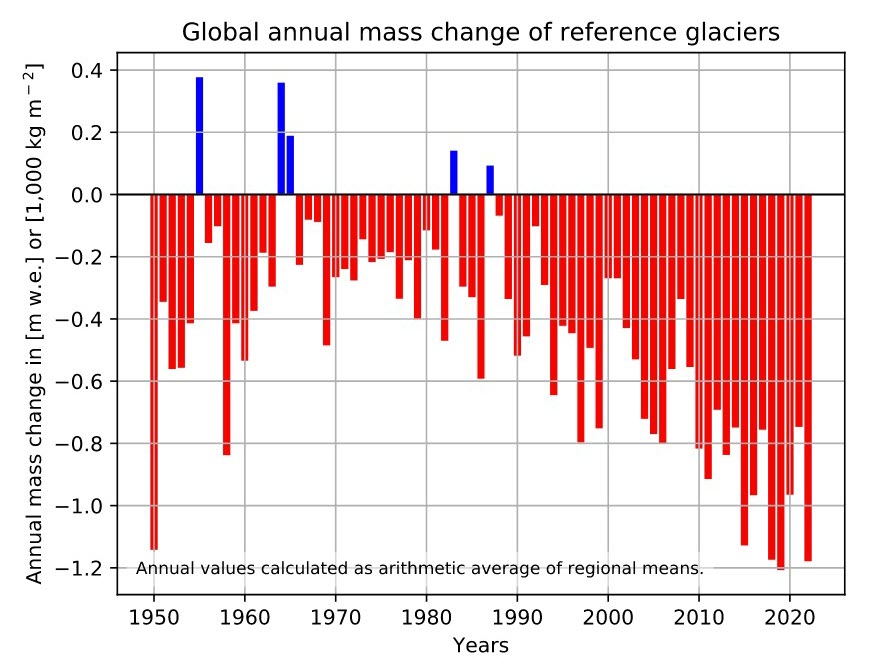
Figure 1: Annual mass balance of reference glaciers with more than 30 years of ongoing glaciological measurements. Annual mass change values are given on the y-axis in the unit meter water equivalent (m w.e.) which corresponds to tonnes per square meter (1,000 kg m-2). Source: WGMS (2021, updated and earlier reports).
As a consequence of all this work, the answer to, “are glaciers growing or retreating?” is not only clear but definitive and based on the scientific literature. Globally, glaciers are losing ice at a rapid rate (fig.1). There are still situations in which glaciers advance: these are confined to parts of the world with high enough precipitation to keep accumulation in a predominant position over ablation. In these cases, the advances may continue where warming leads to increases in precipitation and therefore glacier ice accumulation, such as displayed in part of southwestern Norway during the 1990s (Nesje et al. 2008). The long term trend though is that most mountain glaciers are shrinking worldwide (figure 2).
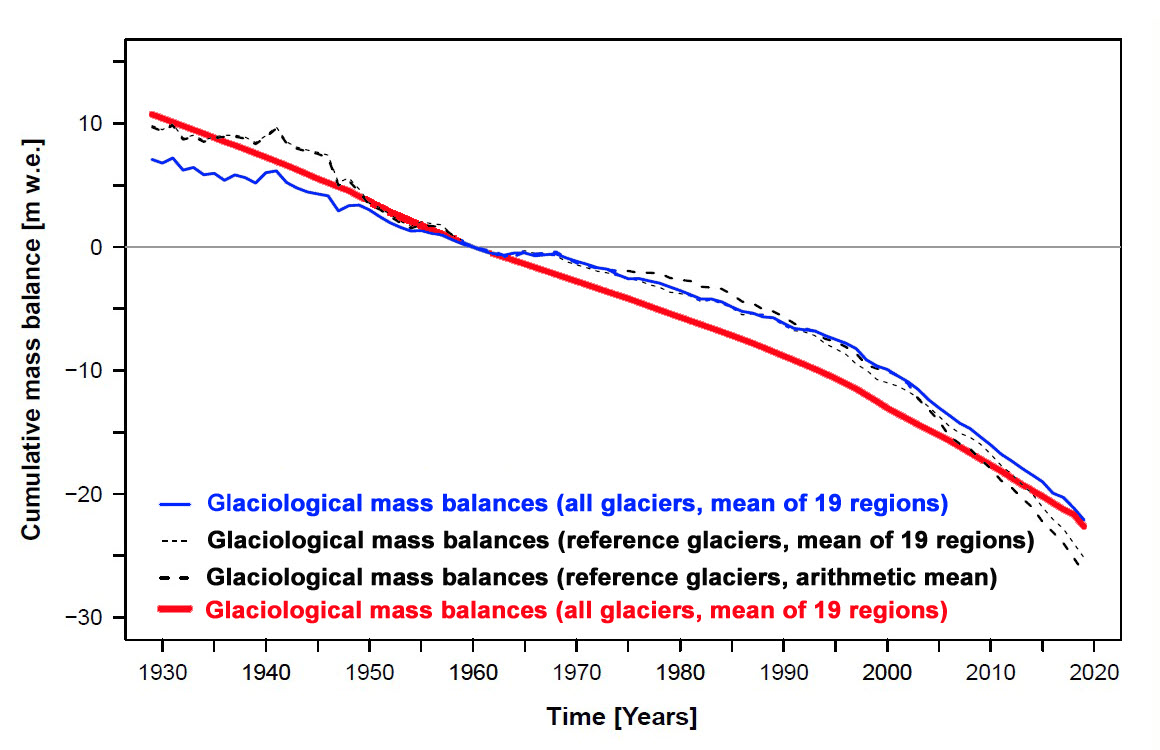
Figure 2: Global averages of observed mass balances from 1930 to 2019. Cumulative annual averages are relative to 1960. Geodetic balances were calculated assuming a glacier-wide average density of 850 kg m-3. Graph adapted from WGMS Global Glacier Change Bulletin, No. 4, 2021, available here (PDF, 36 Mb).
Through such detailed work, it is now possible to estimate glacial retreat for almost all of them worldwide. Since 2000, glacier retreat was the predominant pattern in the Southern Andes, New Zealand, Alaska, Central Europe, and Iceland. By 1990, glaciers had already lost 7 to 28% of their 1901 mass and the decade 2010-2019 saw the highest recorded glacier mass loss since the beginning of observations. The amount? Some 267 billion tonnes per annum (Hugonet et al. 2021). There are even signs of ice-loss starting to take over in some ranges where, up to now, the glaciers were holding their own, such as the Karakoram (Hugonnet et al. 2021 op cit).
Changes in glacier properties are in most cases predominantly caused by variations in both temperature and snowfall, since without sufficient snow they cannot gain mass and ablation takes control of the situation. That looks to be the case for the years to come, even if we curb our emissions enough to stabilise temperatures: there's a time lag between temperature rise and glacier response, so that there are decades of retreat baked-in under any emissions pathways.
Like other climate topics, changes to glaciers are best examined in a global and multidecadal manner. Misinformers have sought to spread confusion here with one of their favourite techniques - cherry-picking from the much smaller number of individual glaciers that are advancing – in other words ignoring those long-term trends. Diversions such as these do not address the most important question here: what is the real state of glaciers globally?
Last updated on 18 June 2023 by John Mason. View Archives


[DB] Nice Gish Gallop. This thread is on 'Are glaciers growing or retreating?'; please stay on-topic to ensure your comments do not get deleted.
For the casual reader, appinsys is well-known to be a site of active disinformation on matters related to climate and climate change. The other graphics that Nik provides to further his narrative are of unknown provenance and should be regarded as questionable.
A reliance on primary sources is best.
[DB] There simply is no evidence to support that assertion. And much to the contrary (example here).