Climate Science Glossary

Term Lookup

Enter a term in the search box to find its definition.

Settings

Use the controls in the far right panel to increase or decrease the number of terms automatically displayed (or to completely turn that feature off).

Term Lookup

Settings


All IPCC definitions taken from Climate Change 2007: The Physical Science Basis. Working Group I Contribution to the Fourth Assessment Report of the Intergovernmental Panel on Climate Change, Annex I, Glossary, pp. 941-954. Cambridge University Press.

Home Arguments Software Resources Comments The Consensus Project Translations About Support

Twitter Facebook YouTube Mastodon MeWe

RSS Posts RSS Comments Email Subscribe


Climate's changed before
It's the sun
It's not bad
There is no consensus
It's cooling
Models are unreliable
Temp record is unreliable
Animals and plants can adapt
It hasn't warmed since 1998
Antarctica is gaining ice
View All Arguments...


Username
Password
New? Register here
Forgot your password?

Latest Posts

Archives

How do human CO2 emissions compare to natural CO2 emissions?

What the science says...

Select a level... Basic Intermediate

CO2 Emissions from human activities increased dramatically after the Industrial Revolution and are the main reason for the increase in atmospheric CO2 concentration since the Industrial Revolution.

Climate Myth...

Human CO2 is a tiny % of CO2 emissions

“The oceans contain 37,400 billion tons (GT) of suspended carbon, land biomass has 2000-3000 GT. The atpmosphere contains 720 billion tons of CO2 and humans contribute only 6 GT additional load on this balance. The oceans, land and atpmosphere exchange CO2 continuously so the additional load by humans is incredibly small. A small shift in the balance between oceans and air would cause a CO2 much more severe rise than anything we could produce.” (Jeff Id)

Nature emits and absorbs CO2 to and from the atmosphere, with emissions and absorptions largely in balance before the Industrial Revolution. As depicted in Figure 1, CO2 emissions come from a variety of sources, including human activities, land use changes, vegetation respiration, volcanoes, and ocean release. CO2 sinking sources include weathering, photosynthesis, increased uptake by plants, and ocean absorption.

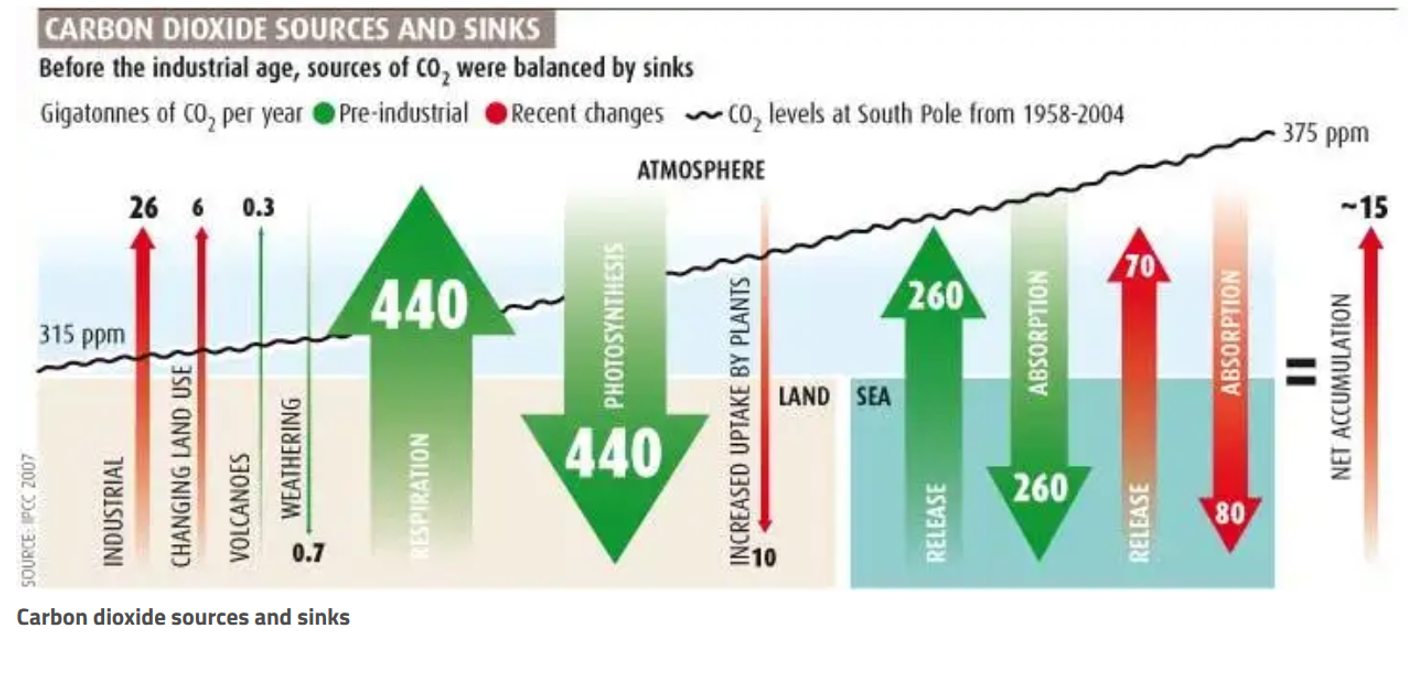
Figure 1. CO2 sources and sinks with pre-industrial fluxes in green and the recent changes shown in red (Brahic 2007).

In Figure 1, the green arrows show natural emission and absorption with the ocean and land respectively. This demonstrates that natural emissions and absorptions were largely in balance before the industrial revolution. Atmospheric CO2 levels and human CO2 emission significantly increased after industrial revolution. As Figure 2  shows, the recent increase in atmospheric CO2 is unseen in the past 800,000 years and as will be explained below, must be caused by human activity.

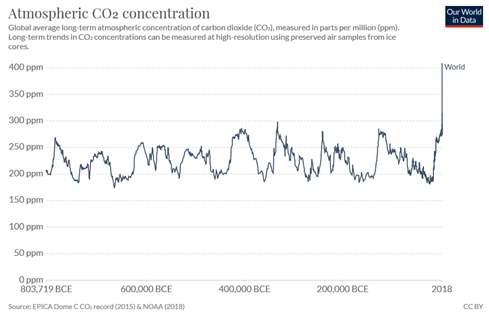
Figure 2. Average concentration of carbon dioxide (CO2) in the atmosphere, measured in parts per million (ppm) from 803,719 BCE to 2018 (data source: NOAA)

Climate myth commits fallacy of oversimplification

One climate myth argues that human CO2 emissions are tiny compared to natural CO2 emissions. This myth oversimplifies the carbon cycle by ignoring that without human influence, natural CO2 emissions are balanced by natural CO2 absorptions. Nature was in balance - we upset the balance. Many lines of evidence confirm that the human role in atmospheric CO2 - observations including atmospheric CO2 measurements, ocean CO2 measurements, and isotope data show that human CO2 emissions are the cause of this increase in atmospheric CO2.

How do scientists know this?

How can scientists be sure that the human CO2 emission (e.g., burning fossil fuels) is responsible for the increase of CO2 in atmosphere? Scientists normally propose many explanatory theories to explain phenomenon and use real-world observations to validate them. It's not easy to prove an explanation is right, but it is easier to prove an explanation is wrong. Before coming to the conclusion that human CO2 is the cause, scientists have investigated other possible explanations, all of which have been ruled out by observational data. This section will list some of the theories, including the ocean one that is also mentioned in the myth.

(1) Could oceans have caused the increase in CO2?

The scientific evidence is clear that since the industrial revolution, the ocean has been absorbing more CO2 than it has been emitting. The partial pressure of carbon dioxide (pCO2) in ocean water is trending upwards since 1990 and the pH value is trending downwards accordingly (Figure 5). DeVries et al (2017) found that the ocean CO2 uptake rates have been growing over the past decade. Meanwhile, decreasing pH reflects that the ocean is absorbing more CO2 from atmosphere. According to the conservation of mass, the ocean CO2 is increasing, so carbon somewhere must be decreasing. Since the atmospheric CO2 is also increasing, the increased carbon must come from other sources.

The reaction between CO2 and seawater forms carbonic acid (H2CO3) which immediately dissociates to form bicarbonate ions (HCO3-) and hydrogen ions (H+). As the concentration of hydrogen ions increases, the water becomes more acidic and the pH value becomes lower (Figure 3).

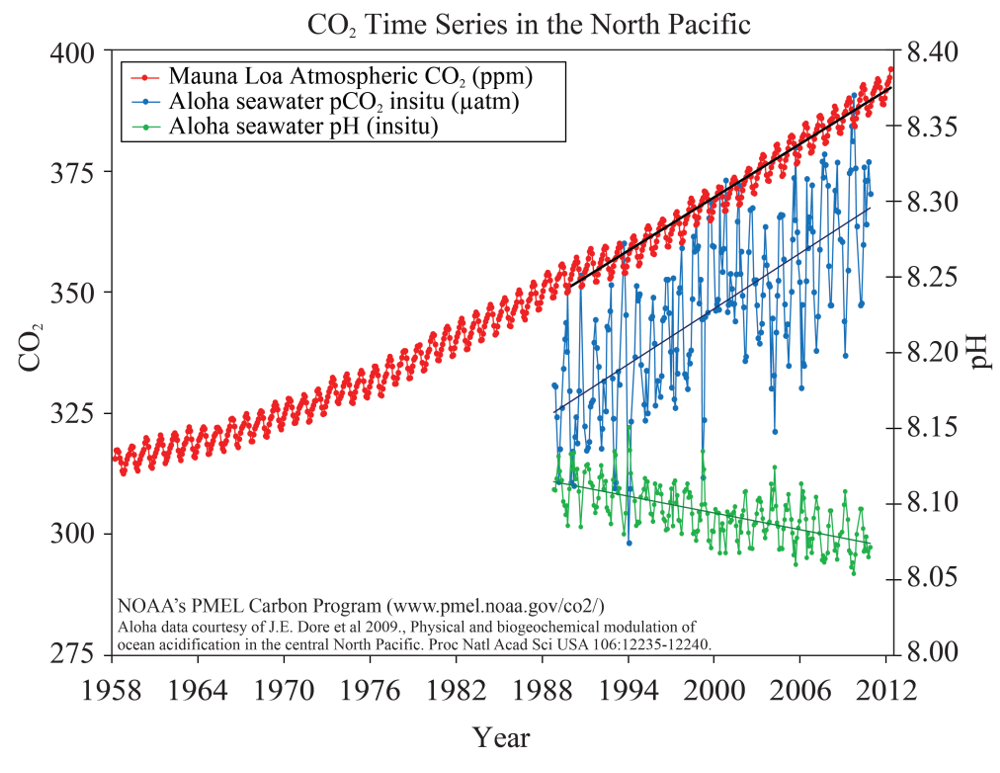
Figure 3. CO2 time series in the North Pacific.

(2) Could land use changes have caused the increase?

Plants absorb CO2 via photosynthesis and produce O2. But human-caused land cover changes are dramatic, especially in the past century, result in deforestation and other changes that reduce the CO2 absorption capacity of the land. Houghton et al (2012) estimated that the net flux of carbon from land use and land cover change accounted for 12.5% of anthropogenic carbon emissions from 1990 to 2010. The Intergovernmental Panel on Climate Change (IPCC) 2019 report concluded that human-caused forest and land use (FOLU) changes contribute to the CO2 emissions (Fig. 4). According to IPCC 2019 report, FOLU CO2 emissions (land use change-related emission in Fig. 1) are around 6 Gt per year, which is smaller than CO2 emission from fossil fuel burning.

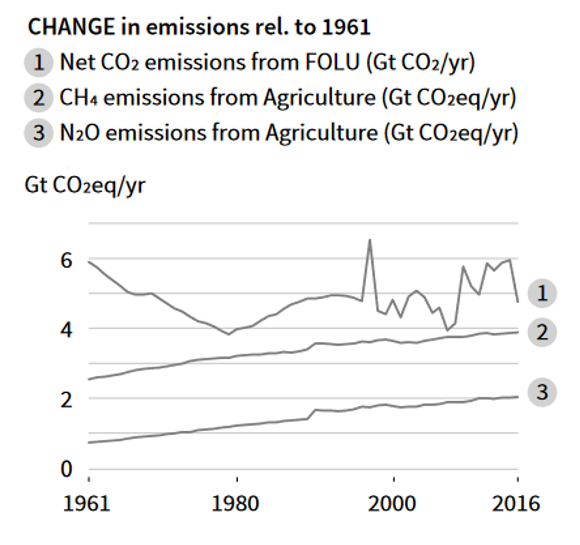
Figure 4. Net CO2 emissions from change of FOLU: forest or land use (IPCC Climate Change and Land 2019 Report).

(3) Could volcanoes have caused the increase?

Some argues that the extra CO2 might come from volcanoes. This is very unlikely because CO2 levels over the past 50 years show no significant increase after large volcano eruptions. It is very unlikely that volcanoes are the major cause for the unprecedented increase in atmospheric CO2.

Another human fingerprint: decreasing oxygen

The decrease of atmospheric oxygen is an evidence indicating that the increase in atmospheric CO2 is due to combustion of fossil fuels. Burning fossil fuels takes gas and oxygen and produces CO2 and water. If human CO2 emissions are the major reason, atmospheric oxygen (O2) should decrease accordingly because of the consumption by chemical combustion. Just as we expected, O2 has been decreasing since we’ve started measuring oxygen levels in the atmosphere (as shown in Fig. 5).

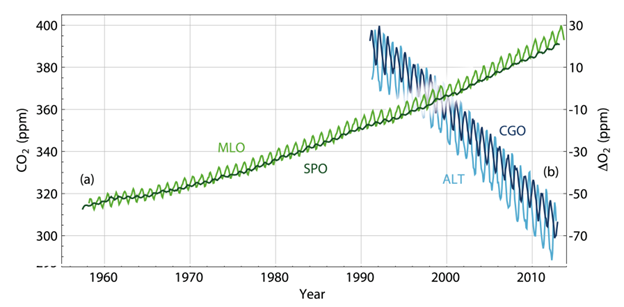
Figure 5. CO2 and O2 trends (light green curve shows the CO2 data collected at the Mauna Loa Observatory Hawaii; the dark green curve is O2 data collected at the South Pole Observatory).

Isotope fingerprints point to human sources

Different sources of CO2 have their own unique isotopic fingerprints. CO2 from the fossil fuel burning doesn't have carbon 14 (14C), and CO2 from terrestrial plants has less carbon 13 (13C) than from the ocean. Since fossil fuels are derived from ancient plants, they also have less 13C isotopes. Isotope data from ice cores show that since 1800, the carbon 13 in atmosphere have decreased, which means the extra CO2 in atmosphere came from fossil burning (Fig. 6).

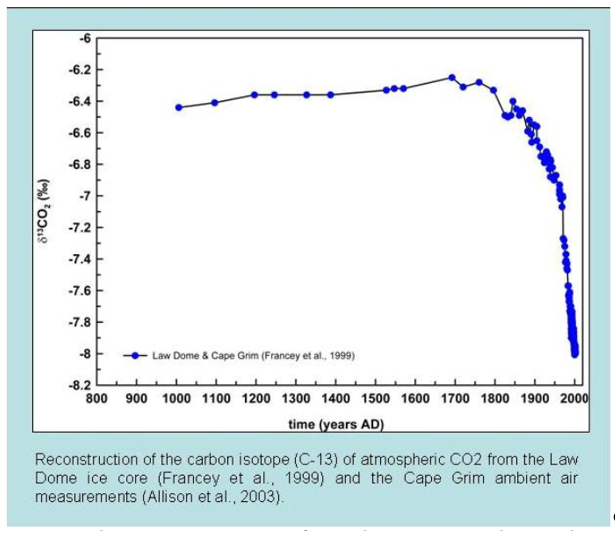
Figure 6. Carbon isotope measurements of atmospheric CO2 from the Law Dome ice core (Francey et al. 1999) and the Cape Grim ambient air measurements (Allison et al. 2003)

Conclusion

The myth that human CO2 emissions are tiny compared to natural CO2 emissions oversimplifies, ignoring that natural emissions are balanced by natural absorptions. After reviewing the evidence, scientists have concluded that human-caused CO2 to be mainly responsible for the increase in atmospheric CO2 after the industrial revolution.

Last updated on 14 November 2020 by jensensun. View Archives

Printable Version  |  Offline PDF Version  |  Link to this page

Argument Feedback

Please use this form to let us know about suggested updates to this rebuttal.

Further reading

Real Climate goes in-depth into the science and history of C13/C12 measurements.

The World Resources Institute have posted a useful resource: the World GHG Emissions Flow Chart, a visual summary of what's contributing to manmade CO2 (eg - electricity, cars, planes, deforestation, etc).

UPDATE: Human CO2 emissions in 2008, from fossil fuel burning and cement production, was around 32 gigatoones of CO2 (UEA).

Denial101x video

Here is the relevant lecture-video from Denial101x - Making Sense of Climate Science Denial

Comments

1  2  3  4  5  6  7  8  9  10  11  12  13  14  15  16  Next

Comments 1 to 25 out of 381:

  1. Some additional ball park figures. According to http://en.wikipedia.org/wiki/Carbon_dioxide 385 ppm corresponds to 3e12 tons of CO2 in the atmosphere, so we get: year ppm tons 1970 320 2.49E+12 2005 385 3.00E+12 5.06E+11 increase apparently the manmade carbon flux has risen from 4E+09 to 8E+09 tons from 1970 to 2005 so on average a flux of 6E+09 for 35 years is 2.10E+11 tons which is 42 % of the total increase and 7 % of the current total atmospheric CO2. That begs the question, what is the cause of the other 48 % ? And how can a manmade increase of 7 % be the main reason for a global increase in temperature?
  2. "That begs the question, what is the cause of the other 48 % ?" The 5.06E+11 are tons of CO2 The (estimated) 2.10E+11 are tons of C which give 2.10*11/3 = 7.70E+11 tons of CO2. So, the net increase in the atmosphere is lower than the "manmade carbon flux". The difference have been taken up by mainly the oceans. "And how can a manmade increase of 7 % be the main reason for a global increase in temperature?" The pertinent figure would not be 7% (btw raised to 26% if C is converted to CO2) but 65/385 = 17%. However such reasoning is still not pertinent since the effect of CO2 is logarithmic and not linear. The preindustrial CO2 contributes to natural greenhouse effect (33°C) and the additional CO2 to enhanced greenhouse effect.
  3. The schematic is misleading. Firstly, it is not representative of the actual processes going but only shows a snapshot in time. Secondly, there is no CO2 balance in biomass input/output: CO2 is constantly being locked up/ released at varying rates so there is no dynamic equilibrium. In (geologically)ancient times CO2 concentrations were as high as 6000ppm...for a long time high enough to preclude oxygen breathers evolving...until sufficent CO2 was locked up by plant life ( the oceans would have been more or less saturated) and O2 levels raised by algae and cyanobacteria. There is no balance! Check out the Oxygen Cycle.
  4. So warming oceans release CO2 ( or absorb less, the end result is the same) thus causing a further rise in temperature which feeds back and so on. Except the glaciers/ice-caps start to melt and lower the ocean T and slow down ( or maybe halt) feedback. Evaporation increases and more heat is lost to space in the upper atmosphere. Land Biomass begins to pick up. Oceanic CO2 release decreases the acidity of sea water and carbonate fixing biota do better and lock up more CO2 allowing more CO2 to enter the oceans. The climate has demonstrated historically that it is very stable despite quite large changes in the sub-systems modulating the Heat in - Heat out process. Life has equally demonstrated it can cope with large climatic changes and that it actually prefers it to be warmer.............
  5. Some crude sums......... 85 - 90% of the 33C elevation of GMT is due to W.vapour. Thus the GG's are responsible for 10-15% (3.3 - 5C) MM CO2 emissions are ~27E9 tons so allowing for MM CH4 emissions (3.0E9tons CO2 equivalent), total MM GG's are around 30.0E9tons (2005) Total atmospheric CO2 = 3.0E12 tons (2005) Thus MM GG contribute 1% of 3.3-5C (.033-.05C) To double total atmospheric CO2 content from 3.0E12 to 6.0E12 solely from MM CO2 @ current increase of 30.E9/a requires 200years. (385ppm to 770ppm assuming all CO2 remains in atmosphere - wrong but never mind). Assume direct lineal warming effect (wrong but never mind)GG's would then contribute to a further GMT rise of 3.3-5C over 200 years. This is 1.65-2.5 C /century. or .17 - .25C/decade. GISS data for land/Oceans: 1980-1990 show a rise of .15C 1990-2000 show a rise of .15C 2000-2007 show a rise of .10C GISS data for met. stations: 1980-1990 show a rise of .15C 1990-2000 show a rise of .19C 2000-2007 show a rise of .12C So it looks like we can expect GMT to rise from around 14 to 15.5 by 2107 Numbers are fun.
  6. According to NOAA data (not their agenda-biased, thanks to Hansen, narrative reports), for the first 7 months of 2008 the AVERAGE GLOBAL TEMPERATURE IS LOWER than the average from 2000 thru 2007 by an amount equal to 13.5% of the total linearized increase during the 20th century. Since 2000, the CARBON DIOXIDE LEVEL HAS INCREASED by 13.6% of the total increase since the start of the Industrial Revolution.
  7. Dan: That suggests CO2 increase = Temp decrease; could it be the AGW's have got it back to front? (tongue firmly in cheek). But now of course it will be the sun ( no sunspots) whereas before it was NOT the sun. It's like pinning down mercury drops...the harder you try the more it splits up into smaller and smaller particles. I don't think anyone rejects that CO2 is a GG; but that is a whole different ballgame to suggesting it is causing global warming on a scale that we should be concerned with.
  8. The point is that added atmospheric carbon dioxide has no significant influence on average global temperature. Examination of the temperature data of the last and prior glaciations from NOAA as determined from Vostok ice cores reveals that temperature trends reversed direction irrespective of carbon dioxide level. This proves that there is no net positive feedback. Climatologists, who apparently don't know how feedback works don't realize this. Unaware of their ignorance, they impose net positive feedback in their GCMs which causes them to predict substantial warming from carbon dioxide increase. Without feedback, the GCMs do not predict significant Global Warming. Other assessments from entirely different perspectives also determine that there is no significant net positive feedback. They can be seen at http://www.climate-skeptic.com/2008/01/index.html and http://www.weatherquestions.com/Roy-Spencer-on-global-warming.htm
  9. Dan: The real problem is that the climatologists are only too happy to research positive feedback and include it, but treat negative feedback as inconsequential, even though, as you point out, their own data clearly shows there are very strong negatives at work. And each time something in the overall system starts a +ve trend, something else wakes up and starts a -ve one. the system has had millions of years to evolve sub-systems to damp oscillations and maintain climate within life supporting limits. Also, nobody is really sure that we know what all the influencing factors are, so the model at the moment is like a cardboard box on wheels. (not a even a Ford let alone a Ferrari)
  10. Another point on the schematic: It is estimated 90%+ of the earth's CO2 is locked up in ocean sediment http://earthobservatory.nasa.gov/Library/Phytoplankton/ and that process is STILL going on....so how can there be any kind of a balance as the graphic indicates? The only way you can 'force' equilibrium like that is totally ignore other factors which simply destroys the basis of the argument.
  11. Re #10 Mizimi That's a massive non-sequiter unfortunately. It also contains an essential fallacy. The 90% of the Earth's sequestered carbon ISN'T "locked up in ocean sediments"...90% of the earth's sequestered carbon was originally DERIVED from ocean sediments (and is now oil/natural gas and so on...) Of course we know very well that the evidence indicates that the system described in the graphics in the top article is more or less in balance. This refers to the short term carbon cycle which describes the recycling of non-sequestered carbon through the biosphere, as well as some elements of the longer term carbon cycle involving slow sequestration of carbon and its reintroduction to the biosphere through (largely) ocean sedimentation of carbon fixing life-forms and volcanic activity, respectively. This is readily apparent in the paleoCO2 record. In the short term (last 10000 years), atmospheric CO2 has maintained a relatively steady CO2 concentration (270 ppm +/- 10 ppm)... e.g. http://www.ipcc.ch/pdf/assessment-report/ar4/wg1/ar4-wg1-spm.pdf lower resolution data indicate that this sort of level has been in the atmosphere for the last 20-odd million years before the 20th century (i.e. 180-350 ppm; the low values occurring during glacial periods). e.g. Pearson, PN and Palmer, MR (2000) "Atmospheric carbon dioxide concentrations over the past 60 million years" Nature 406, 695-699. So that equilibrium in the short/medium term carbon cycle exists and is readily apparent. Obviously once one starts digging up and burning carbon sequestered out of the cycle for many 10's and 100's of millions of years, the equilibrium is abruptly perturbed, and as we're seeing atmospheric CO2 levels are shooting upwards. Incidentally, which "other factors" that are being "totally ignored" were you thinking of Mizimi?
  12. Depends what you define as 'short', 'medium' or 'long'. Yes, atmospheric CO2 levels have risen in the last 50 years or so....is this short or medium? Climate-wise I suggest it is very short. Paleoproxy data shows atmospheric CO2 rising and falling by very much greater levels over longer periods of time. The system is clearly never in equilibrium. 'More or less in balance' is a cop out. How much out of balance does it have to be before you consider it not in equilibrium? How does all that CO2 locked up as carbonate sediment compare to the oil/gas/coal deposits? And that form of sequestration is still going on. Human population is expected to grow from 6 to 9 billion by 2100...which equals (roughly) 540 million tons of carbon locked up in people for say, 60 years? And yes, people die, but the release of carbon back to the environment is not immediate. No dynamic system can be in equilibrium...
  13. "More or less in balance" isn't "a cop out". There's a pretty good understanding of the short term and medium term carbon cycle that dominates the carbon flux between the atmosphere and biosphere, and on longer periods, the atmosphere and terrestrial environment. So to answer your first question: ["How much out of balance does it have to be before you consider it not in equilibrium?"] If atmospheric CO2 levels haven't varied much more than about 20 ppm (maybe 30 ppm according to some plant stomatal index analyses) around 280 ppm for the last 10,000 years before the 20th century, one can conclude that the system has been more or less in balance. It's not "a cop out" to state the obvious. The flux of carbon into the atmosphere has been reasonably closely balanced by the flux out of the atmosphere for vast periods of time before the 20th century. And if one considers the 10 million years before the 20th century, the atmospheric CO2 seems to have been pretty much near equilibrium. So if one considers only the interglacial periods, the atmospheric CO2 was below or around 300 ppm during this entire period according to the proxy record: e.g. Pearson, PN and Palmer, MR (2000) "Atmospheric carbon dioxide concentrations over the past 60 million years" Nature 406, 695-699. M. Pagani et al. (2005) "Marked Decline in Atmospheric Carbon Dioxide Concentrations During the Paleogene", Science 309, 600 – 603. T. K. Lowenstein and R. V. Demicco (2006) "Elevated Eocene Atmospheric CO2 and Its Subsequent Decline" Science 313, 1928. R. M. DeConto et al (2008) "Thresholds for Cenozoic bipolar glaciation" Nature 455, 652-656 Note that it's worth distinguishing the interglacial and glacial periods here, since the shift of atmospheric CO2 down to around 170-180 ppm during glacials is similarly part of the short term carbon cycle that relates to the distribution of carbon between the terrestrial biosphere, oceans and atmosphere. In this case it's the temperature-dependent element of the cycle and its response to very slow insolation variation (Milankovitch cycles). So we can talk about being "near equilibrium" or "more or less in balance" in quite explicit terms: (i) On the timescale of 1000-10,000 years, the relatively fixed amount of ACCESSIBLE carbon distributing between the atmosphere, oceans and biosphere has maintained an atmospheric CO2 concentration that has undergone relatively little variation (the overall variations during 1000's of years of the order of the changes now occurring in about a decade). (ii) on the timescale of 10 million years the longer term carbon cycle involving the sedimentation of carbon as carbonates in the deep oceans and the slow release of carbon from ocean plate subduction and volcanic activity has also been more or less in balance. The atmospheric CO2 record of the last 10 million years suppoorts that conclusion. (iii) On top of the equilibrium carbon distributions of the carbon cycle on the millions of years timescale, insolation variations (Milankovitch cycles) cause very slow requilibration of CO2 between the atmosphere and ocean/terrestrial environments. Now something quite different is happening. A massive store of excess carbon inaccessible to the carbon cycle for many 10's of millions of years is being rapidly reintroduced into the system in an extraordinarily short time period. Not surprisingly the atmospheric CO2 concentration is rising very rapidly indeed. The atmospheric CO2 concentration is out of equilibrium (there's a large nett flux into the atmosphere from previously long-sequestered sources), and the atmospheric CO2 concentration is being driven up towards some new equilibrium concentration. And the above also address your second question: ["How does all that CO2 locked up as carbonate sediment compare to the oil/gas/coal deposits?"] That's not quite a relevant question. Considering carbonate sediments and their formation, the long term paleoCO2 record of the last 10 million years or so indicates that carbonate sedimentation has been pretty much in balance with the return of CO2 from subducted carbonate back through volcanoes into the atmosphere. ...where the "out of balance" element has arisen is the awesomely rapid oxidation and return to the atmosphere of massive stores of carbon previously sequestered out of the short and medium carbon cycles for 10's and 100's of millions of years. Note that dynamic systems CAN be in equilibrium. In general they fluctuate around equilibrium states. Of course one can raise semantic issues about the extent to which a particular fluctuation constitutes a departure from equilibrium. But it's quite easy to be explicit and define exactly what one means by the particular equilibrium in question.
  14. Dynamic: Characterized by continuous change, activity, or progress: a state of non-equilibrium. Equilibrium: . A condition in which all acting influences are canceled by others, resulting in a stable, balanced, or unchanging system. 'Dynamic equilibrium' is thus an oxymoron. Climate is a dynamic system and fluctuates,(sometimes quite severely as history shows)and for man's purposes we would like those fluctuations to be constrained within certain limits. To my knowledge, nobody has defined what those limits should be. (??) Neither do we have the ability to alter in any meaningful and expiditious way the major active components in the system without causing ourselves serious economic problems....it will be interesting to see what effect the current global economic crisis has on fossil fuel consumption, CO2 concentrations and GMT.
  15. Not really Mizimi, Let's not get confused by semantics! Playing with words doesn't change reality. A thermostat is effectively a "dynamic equilibrium". Have a think about how a thermostat works to maintain the temperature in a room at an equilibrium temperature.
  16. A thermostat 'cycles' around a predetermined temp within defined limits; design limitations normally restrict this to 2C. So, for example, a simple heating system will show a more or less sinusoidal curve around the setpoint with an offset of around 2C. This curve can be limited by the use of predictive electronics, but not completely negated. Electronic and compressed air temperature controllers modulate continuously as the detected temp fluctuates and provide closer control, BUT still show a sinusoidal fluctuation around the set point even though much lower than a conventional thermostat (industrial standards of around 0.5C). There is no equilibrium. Semantics is about the meaning of words; once you start to misuse words then communication is degraded. Better to invent a new word than to misuse an existing one..and science is historically pretty good at inventing new ones.
  17. Not really Mizimi... Our understanding of the natural world is not defined by one individual's ignorance! If you don't know very much about a topic why not make an effort to inform yourself befoe sounding off? Try googling "dynamic equilibrium". Far from being an "oxymoron" it's a fundamental descriptor of phenomena that involve the summation of a number of (opposing) processes whose net effect constitutes a balance to an extent that is further definable by the amplitude of variation around the equilibrium position. When applied to reversible chemical reactions the variation around the equilibrium (concentration of reactants and products, for example) can be small small. When applied to Earth processes it can be somewhat larger.. ...it would be foolish to "invent a new word" for such a well-characterized phenomenon as "dynamic equilibrium". The temperature in a room that results from the opposing forces of heat loss and heat input controlled by a thermostat is an example of a "dynamic equilibrium". If one needed further description of the nature of the fluctuations around the equilibrium one could explore/measure these. Likewise with the Earth's atmopheric CO2 concentration. For millions of years the earth's atmospheric CO2 concentration has been in dynamic equilibrium between the forces of volcanic influx into the atmosphere and the efflux from weathering and carbonate "fixing" (supplemented during the last couple of million of years with glacial cycles that temporarily perturb the equilibrium CO2 concentration downwards during glacial periods). In other worlds, since the atmospheric CO2 concentrations haven't varied very much during this period as far as we can tell (apart from the ice age excursions), the evidence indicates that the atmospheric CO2 levels have been in "dynamic equilibrium" (until recently, when they've started progressing upweards at a very very fast rate). Incidentally your misinformed request for semantic rigour on the subject of equilibria is rather out of keeping with your craven acceptance of the most ludicrous and blatant tosh on plaeotemperature data or pre-present atmospheric CO2 data, and so on. You need to come to some decision about where your "standards" lie science/evidence-wise, and then apply these across the board!
  18. "Likewise with the Earth's atmopheric CO2 concentration. For millions of years the earth's atmospheric CO2 concentration has been in dynamic equilibrium...." So what is the 'equilibrium position' of CO2 over these millions of years? 200ppm? 1500ppm? 4000ppm?
  19. It hasn't been far-off 300 ppm (generally a bit lower)for millions of years (around 20 million years), apart from the glacial periods of the past few million years when atmospheric CO2 dropped towards 180 ppm. That's what the evidence indicates. see papers cited in post #13 above...
  20. The paleo temp record at http://www.climateaudit.org/?p=835 indicates SST's ranging over 5C for the past 1.3 million years during which time the CO2 level has been 'more or less' around 300ppm. Air temps would have ranged even further. How do we reconcile this?
  21. come on Mizimi, pay attention... My post #19 was very short and easily readable. Surely you can't have missed the phrase: "....apart from the glacial periods of the past few million years when atmospheric CO2 dropped towards 180 ppm." btw I made a tiny typo in post #19. "(around 20 million years)" should have read "(around 10 million years)" consistent with my post #13.....
  22. chris, You say: "And if one considers the 10 million years before the 20th century, the atmospheric CO2 seems to have been pretty much near equilibrium." It appears that you are not up to date on the IPCC science. It has been higher in the past couple of million years. Chapter 6 Palaeoclimate http://www.ipcc.ch/pdf/assessment-report/ar4/wg1/ar4-wg1-chapter6.pdf "6.3.1 What is the Relationship Between Carbon Dioxide and Temperature in this Time Period? Pre-Quaternary climates prior to 2.6 Ma (e.g., Figure 6.1)were mostly warmer than today and associated with higher CO2 levels." http://www.ipcc.ch/graphics/graphics/ar4-wg1/jpg/fig-6-1.jpg It seems as though you have your facts wrong.
  23. chris, You say: "And if one considers the 10 million years before the 20th century, the atmospheric CO2 seems to have been pretty much near equilibrium." It appears that you are not up to date on the IPCC science. It has been higher in the past couple of million years. Chapter 6 Palaeoclimate http://www.ipcc.ch/pdf/assessment-report/ar4/wg1/ar4-wg1-chapter6.pdf "6.3.1 What is the Relationship Between Carbon Dioxide and Temperature in this Time Period? Pre-Quaternary climates prior to 2.6 Ma (e.g., Figure 6.1)were mostly warmer than today and associated with higher CO2 levels." http://www.ipcc.ch/graphics/graphics/ar4-wg1/jpg/fig-6-1.jpg It seems as though you have your facts wrong.
  24. "As for human CO2 emissions, about 40% is being absorbed, mostly by the oceans. The rest remains in the atmosphere. As a consequence, atmospheric CO2 is at its highest level over the past 800,000 years (Brook 2008). A natural change of 100ppm takes 5,000 to 20,000 years. The recent increase of 100ppm has taken just 120 years." Hang on a minute. Where are you getting THAT from? How are you assuming that? I've never found a CO2 proxy record that comprehensive? If we had such a record we could bring this racket to a close with a bit of luck. What are you going on for that hyper-confident statement? Is it the ice-cores? Or is it just some bogus model that someone plugged into the computer. Obviously if humans have contributed to higher levels thats a good thing. THAT is what the science says. And it doesn't say anything else.
  25. We don't want the ocean to absorb all the CO2. If the oceans absorb it all the rest of the biosphere cannot get the benefit out of it. It would be a great tragedy if the oceans were just absorbing it all. But the good news is as you say. The oceans are only absorbing some of the excess. Thats good luck. Only a complete retard would say otherwise.

1  2  3  4  5  6  7  8  9  10  11  12  13  14  15  16  Next

Post a Comment

Political, off-topic or ad hominem comments will be deleted. Comments Policy...

You need to be logged in to post a comment. Login via the left margin or if you're new, register here.

Link to this page


The Consensus Project Website

THE ESCALATOR

(free to republish)


© Copyright 2024 John Cook
Home | Translations | About Us | Privacy | Contact Us