


 Arguments


What is the link between hurricanes and global warming?
What the science says...
| Select a level... |
 Basic
Basic
|
 Intermediate
| |||
|
There is increasing evidence that hurricanes are getting stronger due to global warming. |
|||||
Hurricanes aren't linked to global warming
“According to the National Hurricane Center, storms are no more intense or frequent worldwide than they have been since 1850. […] Constant 24-7 media coverage of every significant storm worldwide just makes it seem that way.” (Paul Bedard)
At a glance
Hurricanes, Cyclones or Typhoons. These are traditional terms for near-identical weather-systems. The furious storms that affect the tropics have a fearsome reputation for the havoc they bring. Such storms are driven by the heat of the tropical oceans, where sea surface temperatures vary by just a few degrees Celsius and are almost always in the high twenties. Hurricane formation can only take place at such temperatures.
In the Atlantic, for example, a tropical storm-system begins life as a developing wave of low pressure tracking westwards out of Africa. Offshore in the tropical Atlantic, the warmth of the ocean's surface drives intense evaporation. That warmth and moisture provide the fuel for thunderstorm development.
Most such waves simply carry clusters of disorganised showers and thunderstorms. But in some, the storms organise into rain-bands. Once that happens, low-level warm and moist air floods in towards the low pressure centre from all compass points. But it does so in an inward spiralling motion. Why? That's due to the Coriolis Effect. Because the Earth rotates, circulating air is deflected to the right in the Northern Hemisphere, resulting in a curved path. In the Southern Hemisphere the air is deflected to the left. The effect is named after the French mathematician Gaspard Gustave de Coriolis (1792-1843), who studied energy transfer in rotating mechanical systems, such as waterwheels.
The other essential ingredient required to form and keep a hurricane going is low wind shear. Wind shear is defined as winds blowing at different speeds and in different directions at different heights in the Troposphere - the lower part of our atmosphere where weather occurs. For a hurricane, wind-shear of less than 10 knots from the surface to the high troposphere is perfect.
With those ingredients in place, an organised cluster of thunderstorms may spin up into a tropical depression. If conditions favour further development, a tropical storm will form and then strengthen into a hurricane. A hurricane has a minimum constant wind speed of 119 kilometres per hour (74 mph). The most intense Category 5 storms have sustained winds of more than 252 kilometres per hour (157 mph). Highest winds are typically concentrated around the inner rainbands that surround the hurricane's eye.
So, given the above, what will a warmer world result in?
It's a bit of a mixture due to the number of variables involved. The number of storms reaching Category 3-5 intensity is considered to have increased over recent decades. That's because warmer sea surface temperatures give a storm more fuel. Hurricane Beryl of June-July 2024 is a good example. It intensified from a mere tropical depression to a major hurricane in less than 48 hours and was the first recorded storm to reach Category 4 in the month of June. It was also the earliest Category 5 by some 15 days. In contrast, the number of individual systems in a given year appears to have decreased although the jury's still out on that. But one thing is a lot more certain. Extreme rainfalls.
There's a simple, memorable formula that describes how warmer air can carry more moisture: 7% more moisture per degree Celsius of temperature increase. Hurricanes already dump vast amounts of rain: in a warmer world that amount will only increase. Allowing further warming to take place simply makes an already bad situation worse.
Please use this form to provide feedback about this new "At a glance" section. Read a more technical version below or dig deeper via the tabs above!
Further details
The current research into the effects of climate change on tropical storms demonstrates the virtues and transparency of the scientific method at work. It also rebuts the oft-aired conspiracy-theory that scientists fit their findings to a predetermined agenda in support of climate change. They must be exceptionally good at it if that's the case. Normally a single Presidential term does not pass without various people leaking various things that would preferably be kept quiet. In the case of climate change, for this conspiracy theory to be even half-correct, they would have needed to keep it going without fail for two whole centuries! File under 'impossible expectations'.
In the case of storm frequency, there is no consensus and reputable scientists have two diametrically opposed hypotheses about increasing or decreasing frequencies of such events. The IPCC's Sixth Assessment Report (AR6) therefore ascribes 'medium confidence' on the frequency of tropical systems remaining the same or decreasing a little. That basically means "we don't entirely know at the moment".
The background to these inquiries stems from a simple observation: extra heat in the air or the oceans is extra energy, and storms are driven by such fuel. What we do not know is whether we might see more storms as a result of extra energy or, as other researchers conclude, the storms may grow more intense. There is a growing body of evidence that since the mid-1970s, storms have been increasing in strength, and therefore severity. Looking forward, in a world that continues to warm, even more energy means storms will be more destructive, last longer and make landfall more frequently than in the past. AR6 gives increasing intensity a 'likely'. Because this phenomenon is strongly associated with sea surface temperatures (fig. 1), it is reasonable to expect that the increase in storm intensity and climate change are linked.
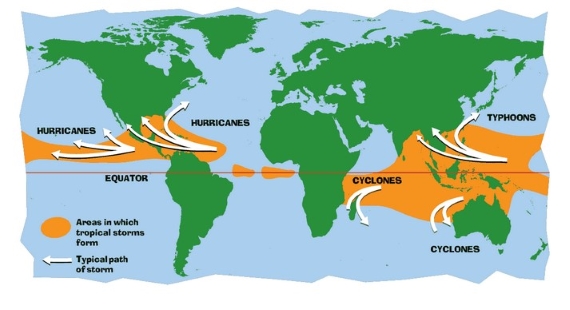
Fig. 1:the warm (and warming) tropical seas are the spawning-ground for hurricanes. Graphic: NASA.
Winds are just one impact of a hurricane: the other is flooding, from two key sources: firstly, storm surges and secondly, extreme rainfalls.
Like any deep area of low pressure, hurricanes have a sizable bulge of sea beneath their eye, accompanying them as they track along. This bulge - the storm surge - forms due to the phenomenally low pressure at the centre of such a storm, that may even fall below 900 millibars in some cases.
Damage caused by a storm surge is dependent on its size, forward speed, sea bed topography, coastal land altitude, whether it strikes at low or high tide and the size of the tide, controlled by the tidal cycle. Spring tides are the biggest and don't just happen in the spring: they occur twice a month. A worst-case scenario occurs where the following factors combine:
- the sea-bed abruptly changes landward from deep to shallow
- the coastal land is low-lying and populous
- the surge hits at high water on a spring tide
- the storm's central pressure is exceptionally low i.e. a Category 5 system
- the storm's forward motion is rapid
If that combination occurs, the damage can be tsunami-like in its effects. A trend towards more intense storms making landfall in a warmer world is therefore a matter of major concern. Add rising sea levels into the mix and one can clearly see the future potential for big trouble due to such surges.
Rainfall is the second source of misery and destruction in tropical systems and in most cases is the leading one. It's worth quoting directly from AR6 with regard to intense rainfalls:
"The average and maximum rain rates associated with tropical cyclones (TCs), extratropical cyclones and atmospheric rivers across the globe, and severe convective storms in some regions, increase in a warming world (high confidence)."
A simple formula (the Clausius-Clapeyron relation) expresses how warmer air is able to transport more moisture. The increased capacity is 7% more per degree Celsius of air temperature increase - something that's been understood since the 1850s. Provided a tropical system has access to increased heat and moisture as it tracks over Earth's ocean surface, it's guaranteed to drop more rainfall in a warmer world. The same principle explains why such systems start to disperse after landfall: that heat and moisture supply gets cut off and they lose their energy-source.
Note that the IPCC makes specific reference to rainfall rates. This is very important. If an inch of rain falls over 24 hours you might see rivers slowly going into spate. But if that same amount falls in just half an hour, you see news headlines regarding properties affected by flash-flooding.
So to conclude, there are things that are almost certain with regard to hurricane frequency, severity and impacts, but there are other things about which we don’t know for sure yet. What can we conclude? About hurricane frequency – not much; the jury is still out. About severity, they do seem to be packing stronger winds. About impacts, stronger winds, faster intensification and a trend of increasingly-severe flooding all seem likely.
With regard to the contested hypotheses about absolute frequency of tropical storms and climate change, we can say that these differing hypotheses are the very stuff of good science, and in this microcosm of climatology, the science is clearly not yet settled. It is also obvious that researchers are not shying away from refuting associations with climate change where none can be found. We can safely assume they don’t think their funding or salaries are jeopardised by publishing research into a serious problem that does not in some way implicate climate change!
Last updated on 3 July 2024 by John Mason. View Archives

 One thing is sure. To choose 1972 for a starting point of the analysis (as in Fig. 2 above) is utterly misleading.
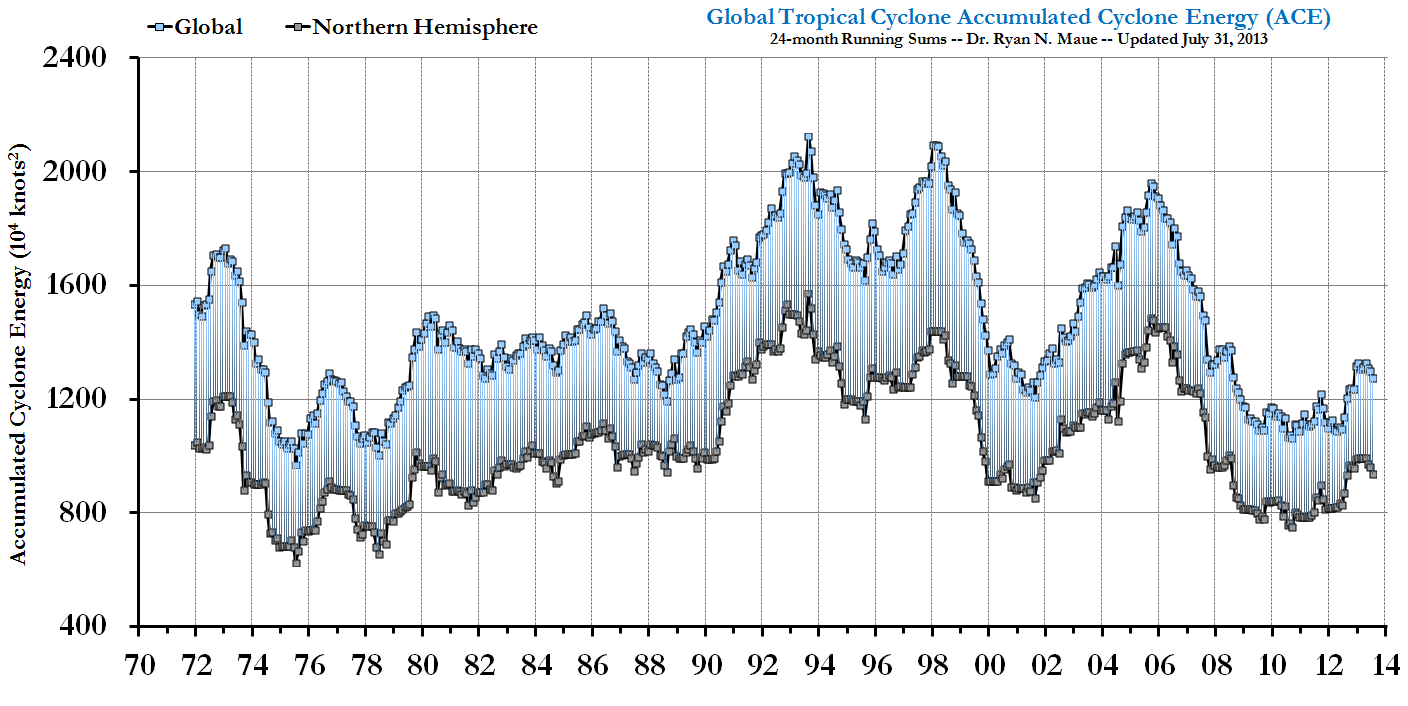 "With 2010 being a globally »hot« year, we saw the fewest number of global tropical cyclones observed since at least 1970."
 which is complicated, but seems to be vaguely increasing over time, especially since the 1920s.
The conclusion in prior threads was this particular aspect of the science isn't settled. So 'no connection whatsoever' is hardly warranted.
And then there are those nasty Pacific storms... this is about global warming after all.
which is complicated, but seems to be vaguely increasing over time, especially since the 1920s.
The conclusion in prior threads was this particular aspect of the science isn't settled. So 'no connection whatsoever' is hardly warranted.
And then there are those nasty Pacific storms... this is about global warming after all.
 If anything, there's a weak negative correlation between temperature anomaly and ACE. That is, there's no need to be scared about would-be supercanes.
Named storms is crap. Before the satellite era tropical storms not making landfall were seldom named because they could easily go unnoticed.
This is why hurricanes making landfall in the US of A are important for century scale histories. They are extremely well documented. If not by scientists, then by insurance companies for sure.
If anything, there's a weak negative correlation between temperature anomaly and ACE. That is, there's no need to be scared about would-be supercanes.
Named storms is crap. Before the satellite era tropical storms not making landfall were seldom named because they could easily go unnoticed.
This is why hurricanes making landfall in the US of A are important for century scale histories. They are extremely well documented. If not by scientists, then by insurance companies for sure.
 The lower caption states expected ACE range is mainly above 175% of median, which reflects the high likelihood of a very active season (also called hyperactive). Note that a 'high-activity era' started in 1995 and now the bars are red.
And that brings us back to Masters' review of the 2010 season, cited in #22 above. Even better, here's link to a video retrospective: The Hyperactive Hurricane Season.
The lower caption states expected ACE range is mainly above 175% of median, which reflects the high likelihood of a very active season (also called hyperactive). Note that a 'high-activity era' started in 1995 and now the bars are red.
And that brings us back to Masters' review of the 2010 season, cited in #22 above. Even better, here's link to a video retrospective: The Hyperactive Hurricane Season.


Climate Myth...