


 Arguments


Climastrology - curve fitting planetary movements
What the science says...
Trying to blame global warming on planetary movements is little more than 'climastrology' and curve fitting. There is no physical evidence that planetary movements influence the Earth's temperature.
Climate Myth...
It's planetary movements
"The solar system oscillates with a 60-year cycle due to the Jupiter/Saturn three-synodic cycle and to a Jupiter/Saturn beat tidal cycle...About 60% of the warming observed from 1970 to 2000 was very likely caused by the above natural 60-year climatic cycle during its warming phase" (Loehle and Scafetta)
In a paper published in The Bentham Open Atmospheric Science Journal, two "skeptics", Loehle and Scafetta (L&S), perform a curve fitting exercise, trying to match global temperature changes using a very simple model involving cycles which they claim are caused by planetary movements. L&S describe their methodology in the paper:
"The model was fit by nonlinear least squares estimation using Mathematica functions, with phase and amplitude free but period fixed as above."
In other words, they let the parameters vary freely without any physical constraints, and fit the curve as best they could. They suggest the first two terms represent astronomical cycles:
"The solar system oscillates with a 60-year cycle due to the Jupiter/Saturn three-synodic cycle and to a Jupiter/Saturn beat tidal cycle"
How exactly these Jupiter and Saturn orbital cycles are supposed to impact the Earth's surface temperature is left unexplained, and thus their model has no physical basis in reality. A fundamental problem with the L&S model is the assumption of significant effects of 20 and 60 year astronomical cycles on the Earth's temperature. Aside from failing to provide a physical mechanism through which Jupiter and Saturn could impact the Earth's temperature, as Riccardo has previously noted, the mere existence of a 60 year cycle in the Earth's surface temperature depends on the choice of trend to begin with. By fitting certain polynomials to the global temperature data, we can find a residual with a 60 year cycle, but only with certain curve fitting choices. Those curve fitting choices must first be justified.
However, instead of first subtracting off the underlying trend and seeing what's left, L&S start their exercise under the assumption that the 20 and 60 year cycles are present, and then fit the temperature data as best they can with those cycles (with no physical constraints). After they conduct this curve fitting, they see what's left and attribute the remainder to human effects. This is not a scientific approach, it's simply curve fitting (a.k.a. "graph cooking" and "mathturbation") at its worst.
There may be a 60 year cycle in the global climate, perhaps related to an oceanic cycle like the Pacific Decadal Oscillation. However, in order to explain the warming of both the oceans and atmosphere, there must be an external forcing at work, which may be why L&S invoke these mysterious astronomical cycles. But the fact remains that they have failed to provide a physical mechanism through which these cycles could impact the Earth's climate.
L&S use a model with a very simple formula:
You may be able to guess how their model will perform just by examining this formula. The first two terms are their proposed plantary oscillations of 60 and 20 year periods, respectively. The third term will produce a linear warming trend, and the fourth is simply a constant. So this model will produce a linear warming trend with two natural oscillations superimposed on top of it.
L&S tweaked the parameters to fit the temperature curve without doing any further testing, but we can test it for them by running their model backwards in time and comparing to reconstructed temperatures. Because of the linear term, you might expect the model to match the observations back to the Little Ice Age (LIA) and then rapidly diverge from observations. If so, you would essentially be right (Figure 1).
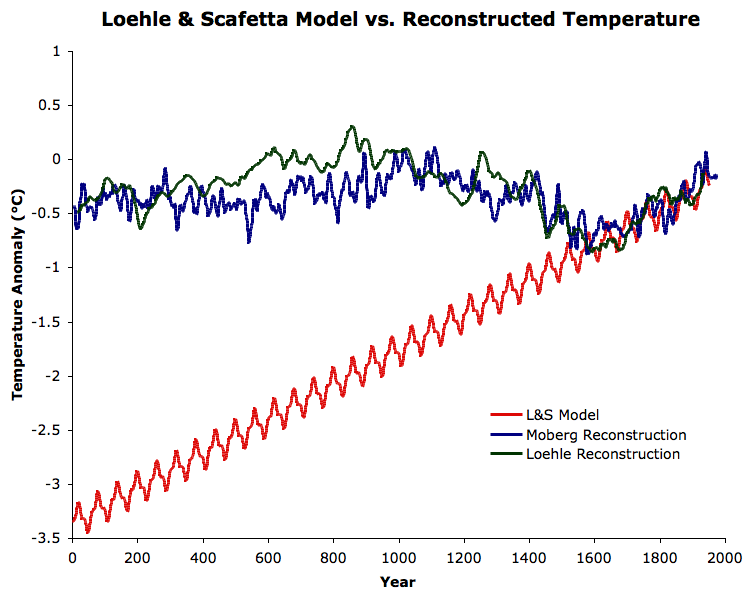
Figure 1: The L&S Case 2 model projected backwards in time (red), compared to the Moberg et al. (2005) millennial northern hemisphere temperature reconstruction (blue) and the Loehle (2008) millennial global temperature reconstruction (green).
Talk about a divergence problem!
Loehle is generally most well-known for his millennial global temperature reconstruction using non-tree ring proxies. Although the paper was published in Energy & Environment, which is not considered a peer-reviewed journal, considering that Loehle was the lead author on L&S, we felt it would be worthwhile to see if Loehle's model matches his own temperature reconstruction.
The L&S model matches the reconstructed temperature trends reasonably well back to the 17th century, but fails miserably to match prior temperatures. Moreover, the 60 year cycle in the L&S model matches up extremely poorly with the Moberg reconstruction (Figure 2), and even with Loehle's own reconstruction (Figure 3).
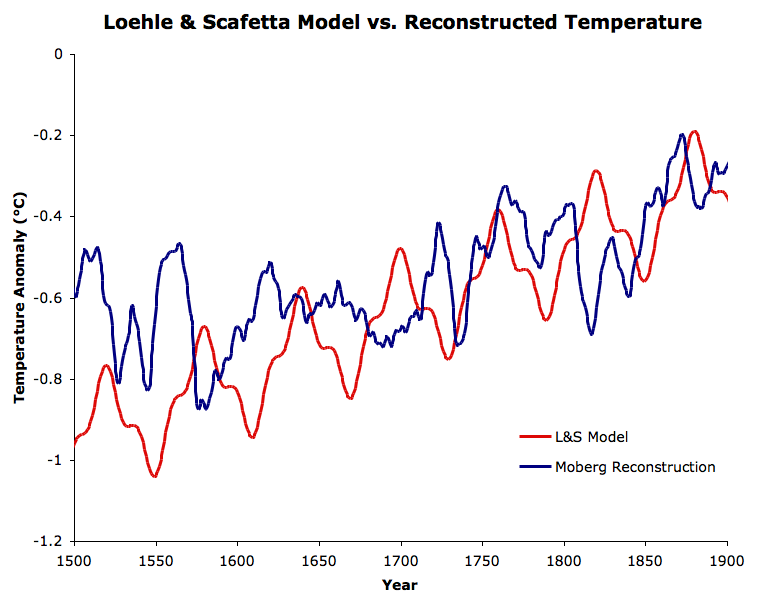
Figure 2: The L&S Case 2 model projected backwards to the period 1500 to 1900, compared to the Moberg et al. (2005) milennial northern hemisphere temperature reconstruction.
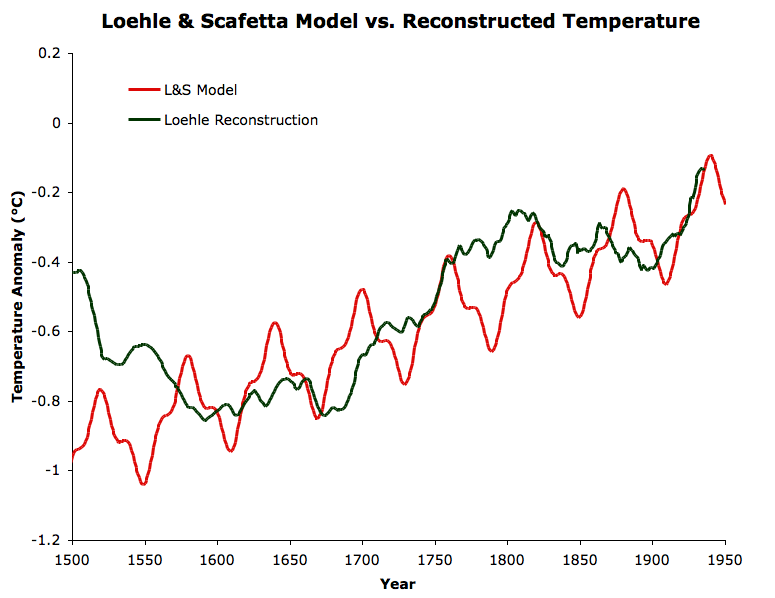
Figure 3: The L&S Case 2 model projected backwards to the period 1500 to 1900, compared to the Loehle (2008) milennial global temperature reconstruction.
Several times between 1500 and 1900, the L&S model is anti-phase with both reconstructions, with the peak of the 60 year cycle matching a trough in temperature. Thus we see that although L&S have gotten lucky and matched the temperature trend a few centuries into the past, the 60 year cycle which is the basis of their paper is nowhere to be found in the temperature data.
Fitting a curve with a simple model using physically unconstrained parameters is simply not a scientific process, as illustrated in its failure when put to the hindcasting test. In fact, the assumed 60 year cycle which was the basis of the L&S model doesn't even show up in Loehle's own millennial global temperature reconstruction - a glaring contradiction.
You could just as easily conduct this sort of curve fitting exercise using the number of pirates, canoes, and pantaloons in southern Spain. L&S are guilty of a major error in the abstract of their paper:
"About 60% of the warming observed from 1970 to 2000 was very likely caused by the above natural 60-year climatic cycle during its warming phase."
Correlation is not causation; all L&S have demonstrated in their unphysical curve fitting exercise is a correlation between their cycles and global temperature. If I find a correlation between Spanish pirates and pantaloons and global temperature, that doesn't mean these variables are causing global warming. If you want to draw a conclusion like L&S have, you need to identify the physical mechanism through which your variables are causing a global temperature change, identify a realistic physical range that this effect can have on the temperature, and then run your model.
Without a realistic physical basis, like Spencer before them, all L&S are doing is playing pointless curve fitting games, and using their results to draw unsubstantiated conclusions. Climastrology is not real science, and planetary movements are not causing global warming.
Last updated on 20 November 2011 by dana1981. View Archives


Before they changed the name to "technical analysis" to fool the unwary, hucksters used a similar "curve fitting exercise" to ensnare investors. It was called 'chartism'. But once so many economics textbooks had debunked 'chartism', they change the name to something sounding more respectable, not to be confused with genuine financial time-series analysis.
But I see no campaign as successful as the past campaign against chartism to persuade the public this "Jupiter/Sun Gravity Model". Forbes has jumped on this bandwagon, too. Worse yet, Scaffeta got his chartism published in a supposedly "peer reviewed" journal.
I haven't done the calculations myself, but it seems to me that a quick back of the envelope calculation of the force on Earth due to Jupiter and Saturn even at it's peak would show that they can't even lift a feather, far less influence the Earth's orbit and therefore climate. Why the 'peers' of the peer reviewed journal never did this calculation is a mystery to me. It should be a cause of disgrace for them, too.
Reviewers who give a pass to garbage like this need to be outed and publicly humiliated.
Likeitwarm @Elsewhere,
You link to comment presented in Semi (2009-unpublished) 'Orbital resonance and Solar cycles' specifically p48 which says:-
This is all about a "wave" in the Scalar sum of Angular momentum and the page also presents a NOTE saying:-
I think I would have to agree with this NOTE. Angular momemtum is considered maintained in a closed system and any heat-related effects that may work beyond a close system (the sun loses 130 trillion tons of mass a year through nuclear fusion) wouldn't make a great deal of difference to that, processes which themselves may show variation but again not significantly even if the sun's position relative to the solar-system's barycrentre were a factor (which Semi [2009-unpublished] asserts is when peak Scalar Sum of Angular Momentum occur).
Further to the NOTE, Semi (2009-unpublished) also does not set out this as an overall finding as it is unmentioned in either the abstract or conclusions.
Of course, that does not stop the swivel-eyed denialists. I note one of the two papers referencing Semi (2009-unpublished), Holmes (2018) 'Thermal Enhancement on Planetary Bodies and the Relevance of the Molar Mass Version of the Ideal Gas Law to the Null Hypothesis of Climate Change ' is cites Semi (2009-unpublished) as apparently showing "Yoshimura is in evidence throughout the climate system, and in proxy records, on all time-scales," (Yoshimura [1978] being cited to support a 55-year barcentric solar-system cycle but with zero actual mention of Earthly climate in that paper).
MA Rodger, #2
Even though I think I'm in over my head, to put it in layman's terms ... So, even though there is a correlation between Semi's 934 year cycle and warm and cool periods of our climate, there is no effect on our climate? I guess we'll see if it starts getting colder in 2100, but I won't be here. Thanks for the explanation.
It's important to note that it's unlikely anyone here will be alive in 2100 to see what transpires after that point. Decisions we make today must be made on what the best available science tells us is likely to happen.
As far as science goes, I wouldn't put much credence on a paper that claims that the modern tech boom is a product of solar cycles.
Likeitwarm, while the Sun can influence the Earth’s climate it isn’t responsible for the warming trend we’ve seen over the past few decades. The Sun is a giver of life; it helps keep the planet warm enough for us to survive. We know subtle changes in the Earth’s orbit around the Sun are responsible for the comings and goings of the ice ages. But the warming we’ve seen over the last few decades is too rapid to be linked to changes in Earth’s orbit, and too large to be caused by solar activity.
One of the “smoking guns” that tells us the Sun is not causing the recent warming of Earth’s surface and ocean comes from looking at the amount of the Sun’s energy that hits the top of the atmosphere. Since 1978, scientists have been tracking this using sensors on satellites and what they tell us is that there has been no upward or downward overall trend in the amount of the Sun’s energy reaching Earth.
A second smoking gun is that if the Sun were responsible for global warming, we would expect to see warming throughout all layers of the atmosphere, from the surface all the way up to the upper atmosphere (stratosphere). But what we actually see is warming at the surface and cooling in the stratosphere. This is consistent with the warming being caused by a build-up of heat-trapping gases near the surface of the Earth, and not by the Sun getting “hotter.”
Scientists have quantified the warming caused by human activities since preindustrial times and compared that to natural temperature forcings.
Changes in the sun's output falling on the Earth from 1750-2011 are about 0.05 Watts/meter squared.
By comparison, human activities from 1750-2011 warm the Earth by about 2.83 Watts/meter squared (AR5, WG1, Chapter 8, section 8.3.2, p. 676).
What this means is that the warming driven by the GHGs coming from the human burning of fossil fuels since 1750 is over 50 times greater than the slight extra warming coming from the Sun itself over that same time interval.
https://science2017.globalchange.gov/chapter/2/#fig-2-3
The reality is, over the past 6 decades of significant global warming, the net energy forcing the Earth receives from the Sun had been very slightly negative. As in, the Earth should be cooling, not warming, if it was the Sun driving the observed warming of the past 6 decades. Does this mean the Sun is dimming? No. Over the centuries, the Sun’s output waxes and wanes between more active periods of time, like during the 1950s and 1960s, and periods when it is very quiet for decades like in the1600s (called a Grand Solar Minimum). However, the difference between the more active periods and the quieter periods isn’t very great and is not by itself long enough or great enough to propel Earth’s climate into either a runaway heating (like happened on Venus) or into an “snowball Earth”. Overall, the Sun has increased its output by roughly 10% per billion years of its life.
https://climate.nasa.gov/faq/14/is-the-sun-causing-global-warming/
https://www.climate.gov/news-features/understanding-climate/climate-change-incoming-sunlight
"brightening of the Sun is unlikely to have had a significant influence on global warming since the seventeenth century"
https://www.nature.com/articles/nature05072
What this means, in plain English: the warming caused by the greenhouse gas emissions from the human burning of fossil fuels is 6 times greater than the possible decades-long cooling from a prolonged Grand Solar Minimum.
Even if a Grand Solar Minimum were to last for a century, global temperatures would still continue to warm. Because the Sun is not the only factor affecting global temperatures on Earth.
https://agupubs.onlinelibrary.wiley.com/doi/full/10.1029/2010GL042710
https://agupubs.onlinelibrary.wiley.com/cms/asset/6dbf95a2-e322-4c92-838a-faf4dd77fa93/grl26938-fig-0002.png
https://agupubs.onlinelibrary.wiley.com/doi/10.1029/2011JD017013
https://agupubs.onlinelibrary.wiley.com/cms/asset/50198c16-0139-4e49-a7f2-e3e66e3af759/jgrd17754-fig-0006.png
https://agupubs.onlinelibrary.wiley.com/doi/full/10.1002/grl.50361
https://agupubs.onlinelibrary.wiley.com/cms/asset/a4f99608-109a-410d-99e6-d1c80799bccc/grl50361-fig-0002-m.jpg
https://agupubs.onlinelibrary.wiley.com/doi/full/10.1002/grl.50806
https://agupubs.onlinelibrary.wiley.com/doi/full/10.1002/2014JD022022
https://www.nature.com/articles/ncomms8535
https://www.nature.com/articles/nature21364
https://www.swsc-journal.org/articles/swsc/abs/2017/01/swsc170014/swsc170014.html
https://academic.oup.com/astrogeo/article-abstract/58/2/2.17/3074082
https://iopscience.iop.org/article/10.3847/2041-8213/aaa124/meta
https://www.atmos-chem-phys.net/18/3469/2018/
https://www.sciencedirect.com/science/article/pii/S0277379118307261
https://www.nature.com/articles/s41561-019-0402-y
https://journals.ametsoc.org/doi/abs/10.1175/JCLI-D-19-0059.1
https://climate.nasa.gov/blog/2953/there-is-no-impending-mini-ice-age/
https://www.nasa.gov/press-release/solar-cycle-25-is-here-nasa-noaa-scientists-explain-what-that-means
The human forcing is now the dominant forcing of climate, dwarfing all natural forcings combined. Even that from the Sun.
Likeitwarm @3,
You appear to be wanting to convert Semi's assertions into something more than they merit.
Semi says that the Scalar Sum of Angular Momentum (which even Semi brands as as "nonsense") "seems to match the climatologic events" and also "roughly correspond to human civilization thriving" (although I would suggest Semi demonstrates a pretty poor grasp of the chronology of "human civilisation").
From that rather weak relational description you are asserting there is a "correlation" (your assertion because Semi does not go so far). And if you examine the data that you assert is correlated (as shown in Semi's Fig 81 on p50), it is far from convincing. And it gets worst. Note the Moberg et at proxy data only reaches to 1979, since when NH temperatures have risen by +1.3ºC. Semi strangely omits the vertical scaling from his graphics, but a quick look at Moberg et al shows his smoothed 2000-year NH proxy reconstruction has a full range of 0ºC down to -0.7ºC meaning if the last 40 years were plotted onto that Fig 81, the NH temperature trace wouldn't just be off the graph, it would be off the page!!
So I would strongly caution you to ignore all ideas of there being something 'matching' or 'corresponding' shown and certainly not any correlating.
MA Rodger @6
Well, I guess that I have perpetrated a case of correlation does not imply causation. I've heard that a lot. I had a thought on that, doesn't that same principal apply to a rise in temperature just happening to correlate to a rise in CO2? Which is it, CO2 causing the rise in temperature or the rise in temperature causing the rise in CO2 or niether?
Likeitwarm... No, because there is a definable mechanism for CO2 being the cause of warming. We know CO2 is a long-lived, non-condensing greenhouse gas. We know that other greenhouse gases, like water vapor, are feedbacks (short-lived, condensing GHG's) that respond to changes in temperature.
You kind of have to look at the whole puzzle, not just the isolated bits.
Likeitwarm : if I may add to Rob Honeycutt's comment :-
Your thinking seems muddled and confused.
A rise in temperature can cause a rise in atmospheric CO2. And a rise in CO2 can cause a rise in temperature (the last 200 years being an excellent example of that . . . and you can find other examples in the paleo history). But I suspect you already knew that.
Just to put things in perspective : the planetary temperature has been falling gradually for about 4,000 years ~ a fall of roughly 0.7 degreesC. The recent Medieval Warm Period [MWP] and the Little Ice Age [LIA] have been very small blips (around 0.3 degrees up or down) on that background decline. So the MWP and LIA have been insignificant in comparison with the overall trend since the peak of the Holocene.
But the modern temperature has now risen far above the MWP and is probably even slightly higher than the previous plateau of the Holocene ( 5-10,000 years ago ). And it is still rising fast. The onset of next major ice age (glaciation) was due in around 15-25,000 years' time . . . but is now postponed far beyond that time span.
Sadly, the movement of the planets Jupiter and Saturn have nix to do with the Earth's climate. But they may have some influence on your personal life, Likeitwarm ~ if you yourself believe in Astrology. (Are you a Cancer or a Capricorn perhaps . . . or more likely a Taurus ? Or perhaps all three ? )
Correlation does imply causation. In fact, correlation is necessary for causation. It's just not sufficient.
To further add to Rob's comment, the time scales in which CO2 causes a tempaerature rise, and a temperature rise causes a CO2 rise are very different.
For a temperature rise to cause a CO2 rise, you need to wait while ecosystems and oceans slowly adapt to the temperature rise - hundreds to thousands of years.
CO2 rising from fossil fuel combustion is taking only decades to cause a rise in temperature.
Time scales are important.
Likitwarm @7,
The intervening comment provides answer to the direct question you pose.
I think it should be added that this correlation you invoke certainly does not imply any causation. This is not because it is but an instance of coincidental curve-fitting, but simply because there is no correlation.
The measure of Scalar Sum of Angular Momentum which provides one side of the corelation is in the words of its creator "nonsense" while the other side (already a very poor fit for a correlation,) is but one version of the measure and additionally incomplete in its presentation. Note the prediction of the creator of the graphic.
The "current warming rate" presented runs up to 1979. Has the post-1979 warming rate 'slowed down'? It hasn't. It has done the exact opposite and has been doing so for forty years. Thus the complete presentation of this second side of the correlation results in a very very bad fit.
Then you do tell us @3, "I think I'm in over my head." You apprear to be correct with that statement.