


 Arguments


Climate change set to fuel more "monster" El Niños, scientists warn
Posted on 23 September 2015 by Guest Author
This is a re-post from Roz Pidcock at Carbon Brief
The much-anticipated El Niño gaining strength in the Pacific is shaping up to be one of the biggest on record, scientists say. With a few months still to go before it reaches peak strength, many are speculating it could rival the record-breaking El Niño in 1997/8.
Today, a new review paper in Nature Climate Change suggests we can expect more of the same in future, with rising temperatures set to almost double the frequency of extreme El Niño events.
Supersizing
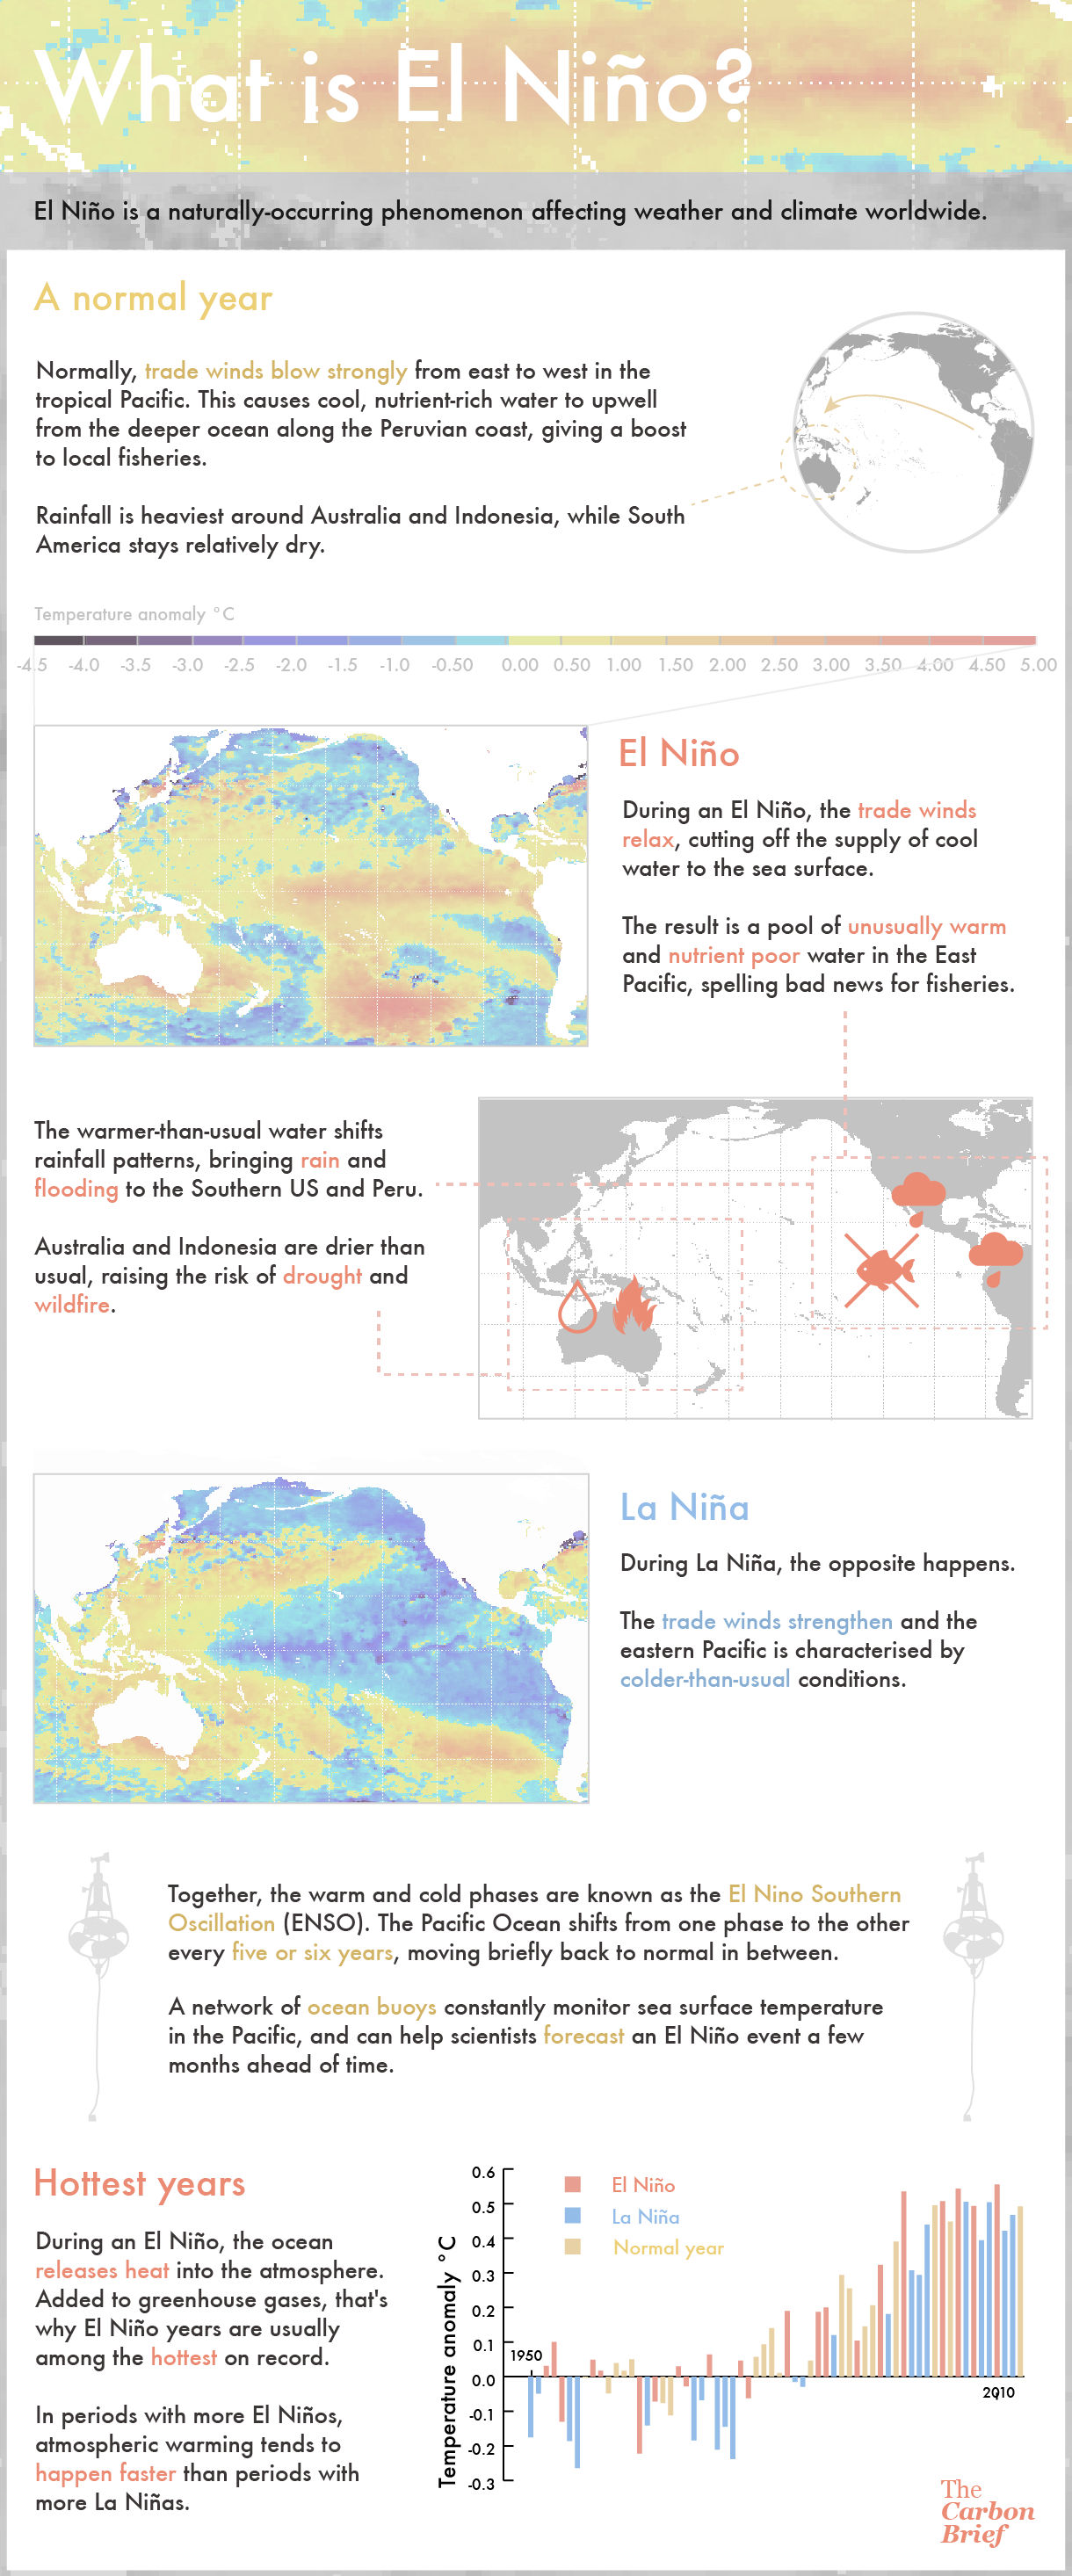
Every five years or so, a change in the winds causes a shift to warmer than normal sea surface temperatures in the equatorial Pacific Ocean - known as El Niño.
Together with its cooler counterpart, La Niña, this is known as the El Niño Southern Oscillation (ENSO) and is responsible for most of the fluctuations in global weather we see from one year to the next.
Last week, US scientists confirmed they expect "a strong El Niño" to peak in the next few months. The event brewing in the Pacific is already "significant and strengthening", said the statement from NOAA's Climate Prediction Centre.
The latest temperature maps, released today, confirm parts of the tropical Pacific are up to 3C warmer than the long term average (dark red in the map below).
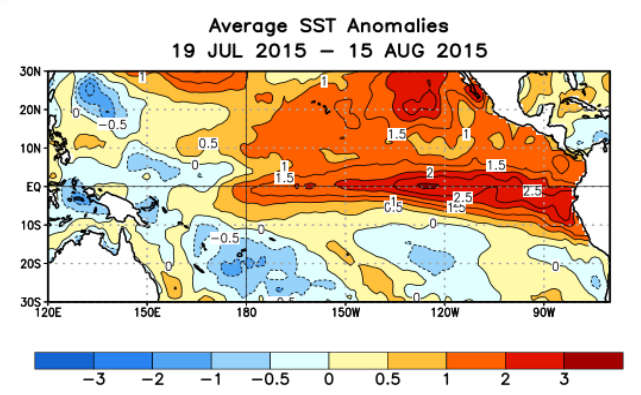 Sea surface temperature anomalies in the Tropical Pacific over the last four weeks. Source: Climate Prediction Center/NCEP, NOAA
A separate comment piece in the same journal explains how scientists have been left scratching their heads over why El Niño has reemerged with such vigour after a false start last year.
An El Niño first looked to be on the way back in Spring 2014, only for it to inexplicably fizzle out, explains the comment piece's author, Dr Michael McPhaden from the US National Oceanic and Atmospheric Administration (NOAA).
The scientific community was fooled for a second time when El Niño unexpectedly flared upagain in 2015, says McPhaden. Calling this behaviour "doubly perplexing", McPhaden adds:
"[T]he much-ballyhooed El Niño, though moribund, was not completely dead. Surprisingly, it came roaring back with renewed vigour during the first half of 2015."
Prof Kim Cobb, co-author on the first of the two articles today and paleoclimate expert at Georgia Institute of Technology, tells Carbon Brief watching El Niño evolve has been "nothing short of thrilling."
'Blurry crystal ball'
The quest to understand how El Niño and La Niña work has attracted a lot of scientific interest. But there are other important reasons to study them.
During an El Niño, Australia, Indonesia, the Philippines, South Africa and Northeast Brazil tend to experience drought while Southern California, the southern US East equatorial Africa, western South America and Southeastern South America tend to see flooding, McPhaden tells Carbon Brief. The Atlantic hurricane season tends to quieten down, while the number of Pacific hurricanes and cyclones grows.
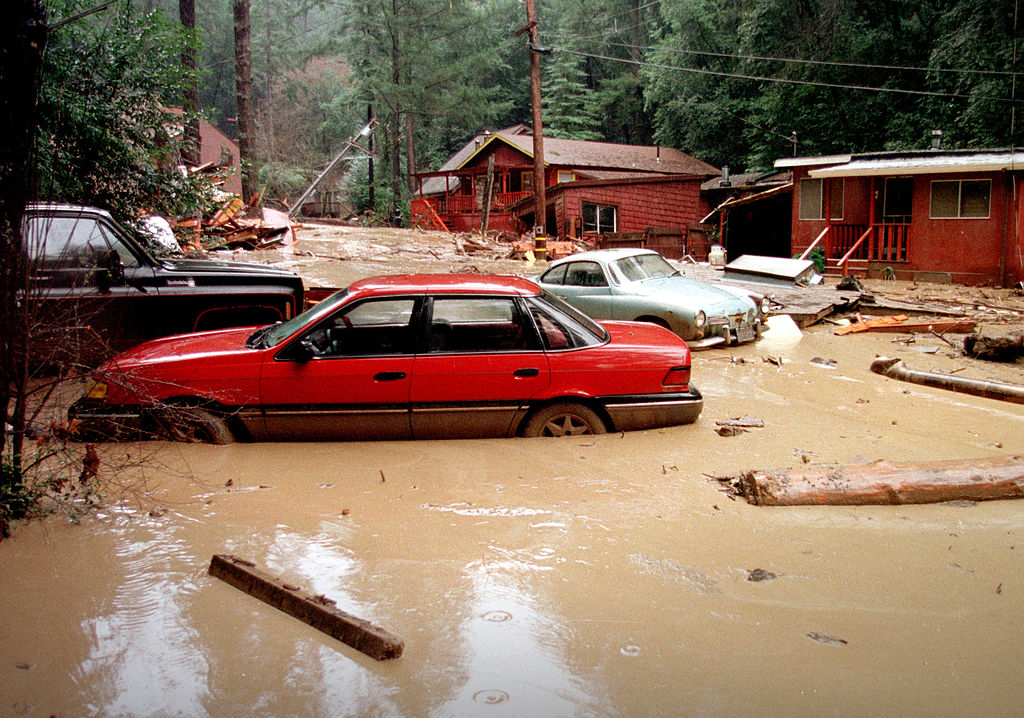
El Niño storms in 1998 caused the Rio Nido mud slides in northern California, damaging houses and cars. Credit: Dave Gatley | Wikimedia.
Because of their potentially serious impacts, there is a huge societal pressure to better predict when an El Niño or La Niña event will occur and how strong it will be. But predicting El Niño's response to climate change isn't simple, McPhaden tells Carbon Brief:
"Our crystal ball is blurry when it comes to how El Niño and its impacts may change in the future."
The new research, which McPhaden was not involved in, reviews all the available scientific evidence on ENSO and climate change, concluding that extreme El Niño events will happen more often as the climate warms.
If emissions stay very high, the authors expect extreme El Niño events with impacts similar to the one in 1997/8 will almost double in frequency by the end of the century, from about once every 28 years today to once every 16 years.
As the climate warms, the scientists also expect to see an increase in extreme La Niña events. As the authors say in the paper:
"ENSO-related catastrophic weather events are thus likely to occur more frequently with unabated greenhouse-gas emissions."
Soul searching
How El Niño and La Niña events might change in response to climate change is one of the most compelling questions in today's climate research today, says McPhaden in his comment piece.
On much shorter timescales, what caused last year's El Niño to fizzle out only to re-emerge with such force is equally fascinating. Why forecasts and expectations fell so wide of the mark has led to a fair amount of soul searching among scientists, says McPhaden.
"Many El Niño experts were fooled by these developments, both when the widely anticipated monster El Niño went into steep decline and again when it re-ignited with such startling intensity."
One thing El Niño scientists have probably learned is not to take anything for granted. McPhaden concludes:
"We've learned a lot but it continues to surprise us. Nature has a way of humbling you when you assume you know more than you do."


Hello,
What makes that coupling with the atmosphere is good or not?
Thanks!
My prediction is that, if indeed this turns out to be a humdinger of an el nino, the deniers will say that it's all due to short term variability and nothing can be inferred from it. Ignoring the fact that they use the cherry-picked 1998 as their starting date for the "pause".
Might be a good idea to refute this argument before they try it on?
I agree, Wol. We need to be ready for a decade or more of "Global warming stopped in 2016!".
Just curious...what causes the La Nina trade winds? Do they just happen or are they being drawn toward the warmer (presumably rising) air over the western Pacific? And do they subside during an El Nino or is air rising off the warmer eastern Pacific causing air to be sucked off the Americas, pushing any humid air away from the coast?
Or is it always a lot more complicated than that?
[Rob P] Check out this video from the UK's Met Office. Yes it's a simplification, but I think it's at the appropriate level for a general audience.
Ogemaniac @3, not that quickly. We will first be served with about five years of "it was only because it was a record breaking El Nino" which climate scientists will have "malliciously ignored". Only after that five year break will we start copping the "it hasn't warmed since" meme again.
I'm still of the opinion this is not a huge El Nino but more like 1982 one. Background has gone up so anomalies look huge, ok. Not too sure we'll see much of the argument about 2016, though. Maybe they'll divert to the pollution argument about coral bleaching.
[Rob P] - 1982/83 was a super El Nino, along with 1972/73 and 1997/98. As for coral bleaching, sea surface temperatures along the eastern Australian coast seem to be building already, which may signal trouble ahead for the Great Barrier Reef.
Rob P inline @6, 72-73 was not a super El Nino based on either the SOI (first graph) or MEI (second graph), although 82-83 certainly was:
jyh @6, while concern about temperature increases due to global warming inflating ENSO indices is a reasonable concern, it is not relevant to either the Southern Oscillation Index (SOI) and or the Multivariate ENSO Index (MEI). In particular, the SOI is an index of the air pressure difference between Tahitii and Darwin. This in turn relates causally to the strength of the trade winds, which in turn relate causally to the El Nino/ La Nina oscillation. Because the SOI is a temperature measure, it is not going to be inflated by the impact of global warming.
The MEI is a conjoint index of six variables, two relating to temperature, two relating to wind velocity, and the others relating to air pressure, and to cloudiness respectively. However, even the temperature indices used are measures of the variability of tropcial sea surface (or air) temperatures over the entire tropical Pacific. As global warming will effect the entire area approximately equally, it will not show up in the measure of variability. Ergo, quite appart from the dilutting effect of the other four indices, the MEI will not be distorted by the effects of global warming.
Having said that, it is not clear that the current El Nino will be a super El Nino. According to the MEI (and purely temperature based indices), it already is. Based on the SOI, it is only on the verge of developing into one (but may not worsten). In either event, we should expect warming temperature until at least December, and possibly March - even if the SOI immediately starts rising.
[Rob P] - See Hong et al (2014). They define it as exceeding two standard deviations in the Nino3 index. IIRC Mojib Latif and others published a recent paper on super El Nino and used a different standard altogether.
And recent published literature, based on climate modelling, does project an increase in the magnitude of ENSO events because of the warming of the ocean. That might be worth a blog post or two explaining why this is so.
Wol @2 Ogemaniac @3 Tom Curtis @5 But but we counter the 0.00 warming 2016-2032 gambit with the warming 2019-2032 defence (at least, you do. I could counter in a seance). I've been doing it since I saw Monckton's (?) hoot at WUWT. It's +0.00/decade GMST 1996-10 to 2014-10 (WUWT) but then it's +0.12/decade GMST 1999-02 to 2014-10 (moi). Since 1999-02 is more recent than 1996-10 this shows clearly that "global warming" has increased since 1996-10 and furthermore 1.2 degrees / 0.0 degrees = an infinite rate of increase. I love this nonsense that they do. Science gets really tedious with lots of "studying" and "analysis" and "thinking" and stuff, but this entirely other stuff is great fun.
Somebody at sks 1-2 years ago plotted GMST with differing symbols for the El Nino, La Nina & ENSO-neutral years. I looked at it a bit and it raised a question (at the end of this).
If you plot the El Nino years only, which are 1966, 1969, 1973, 1977, 1978, 1980, 1987, 1995, 1997, 1998, 2003, 2005, 2007, 2010 you clearly see a warming trend of 0.20 degrees / decade 1966-2010
If you plot the La Nina years only, which are 1967, 1968, 1971, 1974, 1975, 1976, 1985, 1989, 1991, 1996, 1999, 2000, 2001, 2008, 2009, 2011, 2012 you clearly see a warming trend of 0.16 degrees / decade 1967-2012
If you plot the ENSO-neutral years only (middling between La Nina & El Nino) which are 1970, 1972, 1979, 1981, 1986, 1988, 1990, 2002, 2004, 2006, 2013 you clearly see a warming trend of 0.16 degrees / decade 1970-2013
(I skipped El Chichon, Mt. Pinatubo, Mt. Hudson years 1982-4, 1992-4)
The "clearly see" above means I eyeballed it, no LSQ fitting software. Are El Nino years "pulling away from" La Nina & ENSO-neutral like they seem to be ? If so, is this known & expected from the increase in shallow (well-mixed & thermocline) OHC ? It looks tentatively as though El Nino years might have accelerated to 0.23 degrees / decade since 1990 but there are few points and no straight-line trend has a good fit so it'll need many more El Nino years to see a clear trend there. Can anybody inform whether an increasing difference in GMST between El Nino & ENSO-neutral years is expected (or just my old eyes) ?
grindupBaker,
The Denial 101 content includes presentations of other factors that significantly affect the GMST like volcanic releases, and not just the number or volume of release but how high the volcanic gases go.
The amount of such volcanic cooling may be skewing the trends you are looking at. The amount of volcanic cooling was particularly low during the 1997/98 El Nino event.