NASA-GISS: July 2010-- What global warming looks like
Posted on 13 August 2010 by doug_bostrom
"Where's the evidence" is the frequent demand of folks doubting what science tells us of climate change. This isn't surprising because we're looking at a system with enormous inertia and so climate shifts will generally show up as incremental creep over a long period of time. We can look at years of results nicely presented by such tools as NOAA's "Climate Indicators" visualization page but what we see there is nothing we'll notice happening on a day by day basis in our lives.
Weather effects of climate change are elusive when it comes to attribution; an unusual spate of hot weather simply can't be put down to a variation in climate without being viewed in a larger context. Indeed it's best for us laypersons to avoid attributing weather we may feel is unusual to any particular cause. Heavy snowfall last winter was frequently cited as evidence of a halt in global warming or evidence that anthropogenic climate change had been exaggerated; our personal feelings overrode what science told us we could expect of climate change.
There is however a means of separating our gut instinct about today's weather from more objective means of assessment. We can look at any day's weather from a statistical viewpoint. Compared to typical climatology, how does today's weather stack up? How does a sequence of days look? What does the frequency and magnitude of new weather records tell us?
Meehl 2009 looked at weather statistics from the perspective of the ratio of record high and low temperatures over the past few decades. In general we'd expect a large thermometer network of stations in operations for many decades to exhibit a more or less 1:1 relationship of new record highs versus lows. But the statistics clearly show otherwise:

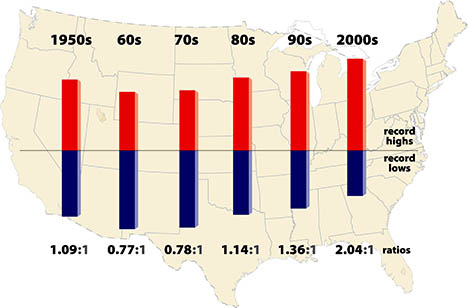
Meehl shows how a statistical look at weather events can tease out information about which way our climate is heading. But this is still not something that can be described as a notable phenomenon, an event that gives us an intuitive feel for the changing behavior of our climate.
Sometimes however unusual weather events and patterns can emerge from the statistical background as a noticeable cluster, a burst of dramatic activity that catches our notice. Our intuition may lead us to wonder if we we're witnessing something more significant than weather.
Weather around the planet so far this year has indeed included some unusual events, to put it mildly, occurrences that are notable from a statistical viewpoint and extend a remarkable recent bulge in records. 75 countries or 33% of the nations on Earth have set historical high temperature temperature records in the past 10 years, versus 15 countries setting record lows. 17 countries have set all-time national high temperature records this year, with only a single country reaching a record low. This has happened in a year where global temperature for January through July of this year is the hottest on record. The 12-month running mean of global temperature is at a record high. Unprecedented monsoon flooding in Pakistan has left some 10% of citizens suffering from flood effects with river flows on the Indus exceeding any past measurements. Russia has seen prolonged temperature extremes far outside the historical record, leaving probability in the neighborhood of 1:1000 in terms of how often we'd expect to see such a phenomenon.
These statistics are in fact so startling that NASA-GISS was moved to title their July 2010 Surface Temperature Analysis "July 2010-- What global warming looks like." The report notes the "statistical loading of the dice" produced by climate change:
"The location of extreme events in any particular month depends on specific weather patterns, which are unpredictable except on short time scales. The weather patterns next summer will be different than this year. It could be a cooler than average summer in Moscow in 2011.
But note in Figure 1, and similar maps for other months, that the area warmer than climatology already (with global warming of 0.55°C relative to 1951-1980) is noticeably larger than the area cooler than climatology. Also the magnitude of warm anomalies now usually exceeds the magnitude of cool anomalies.
What we can say is that global warming has an effect on the probability and intensity of extreme events. This is true for precipitation as well as temperature, because the amount of water vapor that the air carries is a strong function of temperature. So the frequency of extremely heavy rain and floods increases as global warming increases. But at times and places of drought, global warming can increase the extremity of temperature and associated events such as forest fires."
As usual, graphics help us understand the data better. We can see the situation in Russia clearly indicated:

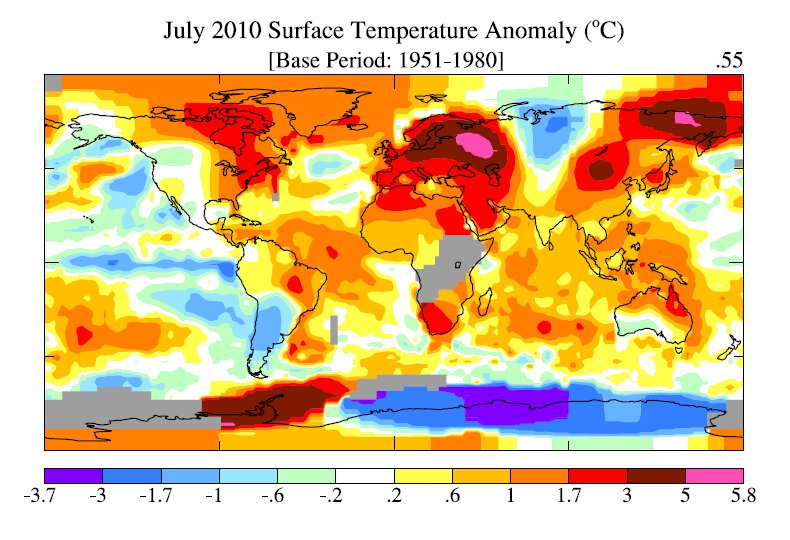
Figure 1 July 2010 NASA-GISS Surface Temperature Anomaly
As we can see from the following graph, the 12 month running mean temperature is at an all time high:

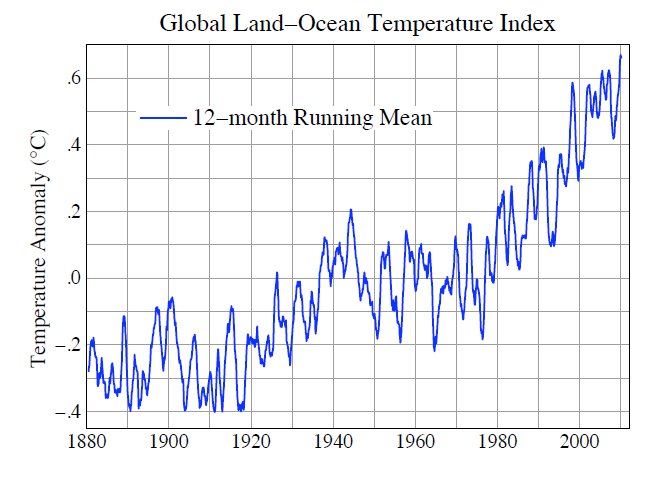
Figure 2 July 2010 NASA-GISS Surface Temperature Analysis
The World Meteorological Organization (WMO) looks at this year more from a weather perspective. In "Current Extreme Weather Sequence" the WMO takes note of the conspicuous nature of this year's weather in Russia:
"According to Roshydromet, the Russian Federal Service for Hydrometeorology and Environmental Monitoring, July 2010 is the warmest month ever in Moscow since the beginning of modern meteorological records, 130 years ago. Temperature has exceeded the long-term average by 7.8° C (compared to the previous record in July 1938 with 5.3° C above average). Record high temperatures varying between 35° C and 38.2° C were registered for more than 7 consecutive days end July, with the heatwave continuing into August. The daily temperature of 38.2° C on 29 July was the highest ever in Moscow (compared to a long-term average of approximately 23° C). The minimum temperature of nearly 25°C (recorded during the night before sunrise) also scored a significant increase compared to the historical average of about 14° C."
The WMO goes on to note events in Pakistan:
"The floods in Pakistan were caused by strong monsoon rains. According to the Pakistan Meteorological Department, the instant rain intensity reached 300 mm over a 36-hour period. The strong monsoon rains led to the highest water levels in 110 years in the Indus River in the northern part of the country, based on past records available from 1929. More areas in central and south Pakistan are affected by the floods. The death toll to date exceeds 1 600 and more than 6 million people have been displaced. Some reports indicate that 40 million citizens have been affected by the floods."
Similarly to NASA-GISS, while careful not to make a bald pronouncement about attribution of these events, neither does WMO avoid pointing out the congruence of unprecedented extreme weather with predictions from climate science:
"Several regions of the world are currently coping with severe weather-related events: flash floods and widespread flooding in large parts of Asia and parts of Central Europe while other regions are also affected: by heatwave and drought in Russian Federation, mudslides in China and severe droughts in sub-Saharan Africa. While a longer time range is required to establish whether an individual event is attributable to climate change, the sequence of current events matches IPCC projections of more frequent and more intense extreme weather events due to global warming. The Monsoon activity in Pakistan and other countries in South-East Asia is aggravated by the la Niña phenomenon, now well established in the Pacific Ocean"
The WMO has more to say on this in their update. It's conspicuous and of course admirable that neither NASA-GISS nor WMO attempt to say "Here's your proof of global warming." Equally it's important that both organizations continue to use their analytic resources to mark those occasions when observations coincide with predictions. 2010 has so far provided ample opportunities for such connections to be pointed out.
All of us live just a single human lifespan; nobody reading these words is likely to wake up 100 years from now and wax nostalgic for the way the weather used to be. As NASA-GISS' title implies, for those of us living in 2010 clusters of statistically extreme weather events are the best grip any of us as individuals will get on what global warming looks like.

Arguments


one such blog (god I hope that link worked)
There seems to be a lack of this being reported in any other media outlet, can any kind soul enlighten me on the issue? Is it a major error on the NOAA behalf, does it call into question their global temp data? or is it being blown out of proportion for the skepitical blogoshere?
Thanks
Also great post Doug, keep it up
The tactic comes from a misunderstanding of science, the belief that it is a "chain of evidence" and if one link is broken, the whole case falls. But scientific evidence, and climate science is a good example, is multiple interwoven strands (more like a rope or cable). You need to break many strands before the theory starts to look ragged.
Great post. Money quote from the paper: "What we can say is that global warming has an effect on the probability and intensity of extreme events."
"The biggest change in the paper is inclusion of an additional analysis is which global temperature change is based only on stations located in "pitch dark" regions, i.e., regions with satellite-observed brightness below the satellite's detection limit (1 μW/m2/sr/μm). Our standard analysis uses stations with satellite-observed brightness below 32 μW/m2/sr/μm. This more strict brightness limitation has no significant effect on analyzed global temperature change, providing additional confirmation that any urban effect on the GISS analysis of global temperature change is small."
On the subject of attribution. How long will it take for scientists to analyize the weather patterns seen this year (and the recent past) and give some numbers on attribution? For example, if there is a 1:1000 chance of the Russian weather and a 1:500 chance of the Pakistan weather and so on for all these events, can a link to global warming eventualy be established? A comparision could be made to the graphic you have on temperature records. We do not know which records were set because of warming, but certainly the dicotomy of hot to cold records is caused by warming.
Yesterday, lows at these three sites were 81, 81, and 82. No other sites recorded low temperatures this high.
I have been living in Indonesia for the last 12 months and there is no way temperatures have been above average in hte last 6 months, as indicated in figure 1. We are in the tropics and right now we are wearing warm jackets. The locals say it hasnt been this cold in 35 years. It is also a really wet year, due to La Nina.
Another point you already know, floods and rain and drought come and go, dont get in the trap of blaming everything on some mysterious 'other' factor.
You refer to a comment above-global warming makes more rain and worse droughts, but you cant have it both ways-in some or many cases these will cancel each other out. Current conditions in Russia are a good eample, the heat in Russia is balanced by the heavy rain and lower temperatures in SE Asia all through this year-they are almost certainly related, and some major benefits flow from it (water), it's not all doom and gloom.
Can you think of a way to get all that 'beneficial' water from SE Asia (presumably only the bits that are a "benefit", i.e. that aren't destroying and killing) up to Russia, so they can "cancel each other out" ?
Can you explain how?
Can you refer to a measured temperature record that confirms what you claim? The graph you refer to is from measured data. Your claim (from only 12 months experience!) that "locals say" is what we call anecdotal. Since actual temperature records exist everywhere, it would be more convincing if you cited those instead. You might learn that it really is warmer where you are when you check! The data to support the graph is GISS data page here. You can probably find a local source of the data if you look.
It is just one reason to be very careful using max/min temperatures for climate indications. If, the variance increases with greater forcing (and, probably, mean temperature), it is the exact shape of the tails of the temperature distributions that determine the records, and they may actually go off in either or both directions without that much happening to the mean. Sampling, for instance, the highest and lowest 5% of all measurements, could give more robust measures. And then, UHI and other effects would play a lesser role.
Asymmetric Trends of Daily Maximum and Minimum Temperature
Maximum and Minimum Temperature Trends for the Globe
Global warming: Evidence for asymmetric diurnal temperature change
Asymmetric diurnal temperature change in the Alpine region
"we're looking at a system with enormous inertia"
enormous interia? or simple ultra-stable and slow in changing giving the impression of enormous inertia. Does this mean a supernova has no inertia, since it disintegrates in three days?
Easily ? I don't think so, unless you can provide evidence that goes against these studies :
On the reliability of the U.S. surface temperature record
3.2.2.2 Urban Heat Islands and Land Use Effects
Urban Heat Island Assessment: Metadata Are Important
Perhaps Watts has finally brought that paper of his out ?
We did have volcano erupting Iceland. Now was the volcano, or the fact that there were all those canceled flights spewing less CO2.
"You refer to a comment above-global warming makes more rain and worse droughts, but you cant have it both ways..."
Then you fail to understand the nature of energy and the impacts it has on weather and climate.
You get rain because of an energy input, that is how the water gets into the atmosphere to create rain.
Increased energy indeed does result in worse rain, drought and more wind. The fact is mate, if you have more energy in a system and it is unevenly distributed, you can expect a lot strange stuff happening to the weather.
RSVP, I do not follow you, the volcano eruption came early this summer and can not possible have affected last winter. Therefore I do not understand the relevance of your comment to my question.
The behavior of extreme cold air outbreaks under greenhouse warming
Sorry. I overlooked you specifying winter, but was it actually a colder winter or just one with more precipitation?
The IPCC has learnt its lesson from 2005. So far we have not yet heard any false attribution claims for the present disasters, but John Cook thinks, that this is what global warming looks like.
I think, that we can wait for the next few years to come without fires and floods, so that global warming again will be exonerated.
An interesting feature in this article is figure 2: the 12-month running average of the temperature. Maybe I have not read the right papers, but so far I have never seen this indicator before. Was it really necessary to invent this indicator, now that the 2010 El Niño is over, and the average of 2010 as a whole will probably not break the 1998 record? Please, remember, that 12 months is a completely irrelevant interval in climate science. The climate is the average of 30 years of weather.
“Russian Scientist: Extreme Central Russian Heat Wave Not An Indication Of A Future Climate Catastrophe By P Gosselin on 12. August 2010” (Note 1) QUOTE:
Time to calm down everybody. .. Michail Kabanov, corresponding member of the Academy of Sciences and advisor of the Institute For Climate And Environmental Monitoring. ..
Deviations in one direction or the other, in this region or the other, are explained completely by the instability of the climate system. It meanders constantly and reaches various anomalies as a result, and does include extremes. The weather conditions of this year are precisely a result of this.
Scientists must still determine if this anomaly is part of a trend in one direction, i.e. global warming, or if it’s just another climate fluctuation says the scientist. According to Ria Novosti: The earth also experienced climate warming in the past, which was then followed by cooling. The question is: To what extent does the anthropogenic factor effect the fluctuations? Kabanow says the current drought is not the start of a future catastrophe. Rather it is simply one extreme event that rarely occurs.
Michail Kabanow also says the thawing of the permafrost also poses no threat to man. The permafrost has been thawing since the last ice age 10,000 years ago. The rate of thawing is by no means catastrophic.
The expert sees no approaching global catastrophe UNQUOTE..
Note 1) see http://notrickszone.com/2010/08/12/russian-scientist-extreme-central-russian-heat-wave-not-an-indication-of-a-future-climate-change/
Best regards, Pete Ridley
The 12 month running average was not invented for the purpose of presenting this year's weather; your eagerness to invent and then run with that notion is quite remarkable. And of course decades of running averages pointed in the same direction contain some thought-provoking information.
There was some cold record broken this last winter. For instance I believed they registered a new lowest temperature in Scotland this winter (around -20C) and as well longest period of a cold snap (but that I will leave unsaid). What the mean temp for the period is I dont know, but think it was "normal". Nor do I know if the precipitation was any bigger than normal.
However, when consider Europe, there was some pretty long persistent cold snaps last winter and there was more precipitation coming down as snow than "normal" causing complete chaos in the traffic situations all over Europe. Peopel was asked to stay at home or avoid public transport as public transport was canceled or stopped for several days due to cold and snow. I also think airports also was closed down when it was at worst but cant remember for sure. But I do know in the UK they did closed down all public education for a while when the snowing was at worst and they was not able to keep the roads clean of snow. Many countries had problem with salt stocks running low – salt to keep the roads free of ice. And when it was at coldest there was no use at all to salt but only plow and sand the roads - those road they had time to plow that is. There was real worries about salt stocks would deplete. Since snow plowing was not able to keep up a lot people got their cars trapped in the snow due to this - people was asked to stay home. As a result emergency service had more incidents calls and elder was not able to get public service due to sever traffic disruption etc, etc, you name it.
In short last winter was a big mess and I just wonder if there is any finding that tells whether this mess last winter was due to climate or to weather?
The result , if these people had their way, is that we on this little planet would sit idly by watching the climate change rapidly and soon irreversibly, all the while wondering what on Earth global warming would look like.
No, no, the earth's crust is being compressed by all that extra weight, making the sea *appear* to rise!
Doug Bostrom posted these national records from this year on an earlier thread. So many hot records have been set this month that it may no longer be up to date. There are 17 national hot records so far this year and one (1) cold record. This winter was cold in Europe (and parts of the US), but not record cold. A lot of snow is not the same as record cold. Global warming models show more precipitation and in the winter that comes as snow. Maybe the snow plow crews were not ready for the snow because there has been so little snow in recent years. Perhaps they no longer can clear snow that they could clear 30 years ago when it was colder. The trends are for warmer winters, this was a cold dip.
David,
It seems as soon as one argument is shown to be false they make up a new one. The surface record drum no longer beats so loud but they find something new. I think this summer will start to tip more people. If I were the commander of Afganistan I would be worried to see all those people homeless in Pakistan-- some of them will go to Afganistan and fight. The military has to plan for the future.
Unfortunately I can not access the full article, I also noticed this article is published 2006 and obviously they can not have any opinion in that paper whether last winter was due to climate or weather or even if it was extreme – if you ask me I wouldn' t say it was extreme more like winters used to be 15-20 years ago about.
Anywat, that does not matter. What I am asking for is statements from official institute about what have happen, that is I am not asking for predictions but explanations.
Like the one that has been made about the current wild fires in Russia and flooding in Pakistan as contrary to explanation made before about extreme weather phenomena - these has been explained as variation in weather and nothing more, however variations that we can suspect to see much more often – the difference now is that this latest explanation seams to claim that climate change is a direct cause (and I think such strong claims never been made before, has it?) Secondly since this winter was a mess and is directly related to this summer it falls natural to ask the question – was this winter also due to a climate effect or was it just natural variations?
So many hot records have been set this month that it may no longer be up to date.
I don't know where you live, but I can hardly say any heat records been set this month where I live (western Europe) on the contrary this month may be just another "normal" or slightly cooler in the record - but we are not even half way so still far to early to tell what it will be.
The really depressing thing, as readers will be aware, is that the current Australian government's plan (the Opposition has no plan at all) to deal with global warming is to hold a conference of "ordinary" people (certainly not climate scientists) to decide what to do. It has been pointed out -
http://davidhortonsblog.com/2010/08/11/deliver-da-letter/ - that such a conference would closely resemble the kind of discussion we see in this thread and many others. A denial, based on the most improbable propositions, that there is any problem at all.
A lot of snow is not the same as record cold.
This is strawman. The rest of your comment is as a red herring.
However-- boiling down this post to fewer words-- while attributing any single event to anthropogenic climate change is a very high bar to cross the trend of weather extremes we're seeing is in keeping w/predictions and could reasonably be considered a signature of a process dominated on the short term by natural variation but with an overwhelming trend. That's the point both NASA-GISS and WMO are making.
Regarding last winter, I'm not an expert but I've read that it was down to natural variation, hardly unexpected as a glance at a host of data shows (see the NCDC data visualization tool linked near the beginning of the article). As both the WMO and NCDC say, as La Nina exerts itself (herself?) we can expect to see a drift back to what are considered more normal conditions but we should not expect trends to vanish.
The real story is neatly encapsulated-- variation and all-- in that 12 month running average global mean temperature graph. A picture really does tell a thousand words. A lot of us are terribly dismayed with what such pictures tell us so our first instinct is to disbelieve them. Unfortunately disbelief is not an argument and can't stop the processes driving that graph upward.
The unusual cold in parts of Europe and the US last winter was caused by an extreme negative phase of the Arctic Oscillation, bringing cold Arctic air to lower latitudes, with warmer air flowing into the Arctic, causing the Arctic temps to rise to unusually high levels.
Some info:
http://nsidc.org/arcticmet/patterns/arctic_oscillation.html
http://www.appinsys.com/GlobalWarming/AO_NAO.htm
This has been linked to the extreme ice melt and rapid heating of the Arctic, and it is expected that we can see similar weather patterns during the coming winters:
http://ipy-osc.no/article/2010/1276176306.8
http://ipsnorthamerica.net/news.php?idnews=3127
You're forgetting the two weather events that Deniaworld uses to set its clocks: the 1998 high temps (hence no warming since then) and the 2007 min ice extent (hence the Arctic hasn't melted at all since then). When you stake your position on only those facts you want, life is sweet. And hence all others must be wrong.
Is the ice core data for 400,000 years a long enough record for you? Or do you insist we wait for 5,000 years to get direct temperature measurements? These data show that current warming is not natural and can cause serious problems.
Your last post is too extreme for me to reply to. You need to read less denial websites and become familiar with the science. This web site has a lot of good information for the novice.
It is striking to see posts like Miekol's right after yours. There are several people like him/her posting on Skeptical Science right now. How can you reply to a post like that?
"I disagree" is not an argument, not a means of improving our understanding. "I disagree and here's how, specifically, coherently and constructively" using means and methods specific to the case in consideration is a better approach as well as actually being a complete attempt at argument. Ideology or politics really have nothing to useful to say about what the physical world of instrumentation tells us.
I enjoy trying to understand the world around me.
I find it difficult to accept that its man made CO2 that is the cause of climate change.
Do you know that in every 85,800 molecules of dry air only 33 are CO2. And of those only 33 is man made. That's one in 85,000. If you include water vapour its even less.
http://en.wikipedia.org/wiki/Atmosphere_of_Earth#Composition
How is it possible a one in 85,800 atmospheric molecules can be the cause of climate change?
RSVP: Thermal inertia can be viewed as the rate of change in the temperature of a system as a function of the rate of heat input. Compare the heat capacity of the planet's oceans to the current planetary energy imbalance. One is a big number, the other is quite a bit smaller.
fydijkstra: 12 months isn't irrelevant for a running average, it's the length of time that will average out the seasonal variations. 11 years is useful, too, as it will tend to average out the solar cycle. Somewhere in the 5 to 7 year range is useful, too, since it will average out the ENSO cycle.
Also, since we're talking about GISS measurements, 2005 was the warmest year, not 1998. 2009 and 2007 were both slightly warmer than 1998 and 2002, but the four years are probably statistically tied for second-warmest. You must think it a remarkable coincidence that all five of those years came in the last 11 of a 130 year history, and that the 9 warmest years on record came within the last 11 years.
Regarding the effect of C02 as a trace gas, here's where to go with that: How do we know more CO2 is causing warming?