


 Arguments


New research from last week 6/2012
Posted on 14 February 2012 by Ari Jokimäki
Michael Mann has been a busy beaver this week - not only is there the book thing he's doing, but he also managed to get his name on two of the papers here. So, Dr. Mann, with my unanimous decision, you are the scientist of the week!
So the climate warms and Italian trees get their temperature signals all messed up (and even without the help from volcanos) and so does an Antarctic ice core. Playing with carbon cycle models or fiddling with old ocean measurements or counting U.S. temperature records (of which U.S. public probably don't even care) don't help. So we get our weather extreme and disaster analysis methods in shape and then we just sit back and wait. It won't be long wait, though, as the aerosol forcing (from transportation for example) diminishes and GHG warming really starts to kick in fast. That's air pollution control for you. Speaking about pollution control, we are just glad that British river dwellers are doing little bit better these days, partly due to toxic waste management. In middle all this, we are wondering if solar cycle affects Madden-Julian oscillation and if Bering Sea would get a nice swimming temperature, if we would double the CO2 in the air.

Italian mountain trees are losing their June temperature signal from their rings
Abstract: "Tree rings from temperature-limited environments are highly sensitive climate proxies, widely used to reconstruct past climate parameters for periods prior to the availability of instrumental data and to analyse the effect of recent global warming on tree growth. An analysis of the climatic signal in five high-elevation tree-ring width chronologies of European larch (Larix decidua Mill.) from the tops of five different glacial valleys in the Italian Central Alps revealed that they contain a strong summer-temperature signal and that tree-ring growth is especially influenced by June temperatures. However, a moving correlation function analysis revealed a recent loss of the June temperature signal in the tree-ring chronologies. This signal reduction primarily involves the two lowest-altitude chronologies. It is probable that the observed increasing importance of late-summer temperature for tree-ring growth over the past 50 yr is an effect of the lengthening growing season and of the variations in the climate/tree-ring relationship over time. All the chronologies considered, especially those at the highest altitudes, show an increasing negative influence of June precipitation on tree-ring growth. The climatic signal recorded in tree-ring chronologies from the Italian Central Alps varies over time and is also differentially influenced by climatic parameters according to site elevation."
Citation: Anna Coppola, Giovanni Leonelli, Maria Cristina Salvatore, Manuela Pelfini, Carlo Baroni, Quaternary Research, http://dx.doi.org/10.1016/j.yqres.2012.01.004.
Carbon cycle model successfully reproduces CO2 changes through last glacial cycle
Glacial CO2 cycle as a succession of key physical and biogeochemical processes - Brovkin et al. (2012) [FULL TEXT]
Abstract: "During glacial-interglacial cycles, atmospheric CO2 concentration varied by about 100 ppmv in amplitude. While testing mechanisms that have led to the low glacial CO2 level could be done in equilibrium model experiments, an ultimate goal is to explain CO2 changes in transient simulations through the complete glacial-interglacial cycle. The computationally efficient Earth System model of intermediate complexity CLIMBER-2 is used to simulate global biogeochemistry over the last glacial cycle (126 kyr). The physical core of the model (atmosphere, ocean, land and ice sheets) is driven by orbital changes and reconstructed radiative forcing from greenhouses gases, ice, and aeolian dust. The carbon cycle model is able to reproduce the main features of the CO2 changes: a 50 ppmv CO2 drop during glacial inception, a minimum concentration at the last glacial maximum 80 ppmv lower than the Holocene value, and an abrupt 60 ppmv CO2 rise during the deglaciation. The model deep ocean δ13C also resembles reconstructions from deep-sea cores. The main drivers of atmospheric CO2 evolve in time: changes in sea surface temperatures and in the volume of bottom water of southern origin control atmospheric CO2 during the glacial inception and deglaciation; changes in carbonate chemistry and marine biology are dominant during the first and second parts of the glacial cycle, respectively. These feedback mechanisms could also significantly impact the ultimate climate response to the anthropogenic perturbation."
Citation: Brovkin, V., Ganopolski, A., Archer, D., and Munhoven, G.: Glacial CO2 cycle as a succession of key physical and biogeochemical processes, Clim. Past, 8, 251-264, doi:10.5194/cp-8-251-2012, 2012.
Tackling the issue of limited historical observations of ocean climate
Detecting historical ocean climate variability - Carton et al. (2012)
Abstract: "While ocean observations of temperature and salinity extend back to the 19th century, their observation count, as well as geographical and vertical distributions all changed dramatically between successive decades. Similarly, atmospheric observations were unevenly distributed in space and time. This study explores the usefulness of past oceanic and atmospheric observing systems to detect extreme climate events through a set of observing system simulation experiments. In these experiments an initial simulation of the evolving ocean state during 1995–1998 (Nature Run) is sub-sampled using the same distribution of surface and subsurface observations as exists in successive decades. The result is a set of synthetic ocean observation re-samples of the massive mainly tropical/subtropical climate anomalies of the 1995–1998 years. These synthetic observation re-samples are then assimilated into a general circulation ocean model using a conventional assimilation scheme. In one set of experiments the model used in data assimilation is driven with climatological forcing to mimic the effects of poorly specified surface forcing. The results indicate that prior to the 1940s the historical observing network alone was only able to resolve limited aspects of tropical/subtropical variability. In contrast, by the 1960s the observing system was sufficient to resolve variability without additional wind information. In a second set of assimilation experiments surface meteorological forcing is improved to an extent consistent with meteorological error estimates for past decades. When this historical surface forcing is also included the results suggest that this extreme climate variability is reproducible even back to the early years of the 20th century. The paper concludes with a discussion of the implications of several simplifying assumptions used to obtain these optimistic results."
Citation: Carton, J. A., H. F. Seidel, and B. S. Giese (2012), Detecting historical ocean climate variability, J. Geophys. Res., 117, C02023, doi:10.1029/2011JC007401.
Overview of statistical methods used for weather extremes and disasters
Inferences on weather extremes and weather-related disasters: a review of statistical methods - Visser & Petersen (2012) [FULL TEXT]
Abstract: "The study of weather extremes and their impacts, such as weather-related disasters, plays an important role in research of climate change. Due to the great societal consequences of extremes – historically, now and in the future – the peer-reviewed literature on this theme has been growing enormously since the 1980s. Data sources have a wide origin, from century-long climate reconstructions from tree rings to relatively short (30 to 60 yr) databases with disaster statistics and human impacts. When scanning peer-reviewed literature on weather extremes and its impacts, it is noticeable that many different methods are used to make inferences. However, discussions on these methods are rare. Such discussions are important since a particular methodological choice might substantially influence the inferences made. A calculation of a return period of once in 500 yr, based on a normal distribution will deviate from that based on a Gumbel distribution. And the particular choice between a linear or a flexible trend model might influence inferences as well. In this article, a concise overview of statistical methods applied in the field of weather extremes and weather-related disasters is given. Methods have been evaluated as to stationarity assumptions, the choice for specific probability density functions (PDFs) and the availability of uncertainty information. As for stationarity assumptions, the outcome was that good testing is essential. Inferences on extremes may be wrong if data are assumed stationary while they are not. The same holds for the block-stationarity assumption. As for PDF choices it was found that often more than one PDF shape fits to the same data. From a simulation study the conclusion can be drawn that both the generalized extreme value (GEV) distribution and the log-normal PDF fit very well to a variety of indicators. The application of the normal and Gumbel distributions is more limited. As for uncertainty, it is advisable to test conclusions on extremes for assumptions underlying the modelling approach. Finally, it can be concluded that the coupling of individual extremes or disasters to climate change should be avoided."
Citation: Visser, H. and Petersen, A. C.: Inferences on weather extremes and weather-related disasters: a review of statistical methods, Clim. Past, 8, 265-286, doi:10.5194/cp-8-265-2012, 2012.
Ice core temperature reconstruction disagrees with temperature measurements
Abstract: "A 125-year ice core record of climate from the Whitehall Glacier Ice Divide provides exceptionally high resolution stable isotope data from the north-west margin of the Ross Sea, Antarctica. This is the only proxy data available to extend the instrumental record of temperature in this region, where little is known about climate variability over the past two centuries. Using ERA-Interim reanalysis data, we develop a precipitation-weighted δ18O-temperature transfer function of 0.62 ‰ °C-1, which is comparable to other proximal ice cores, such as Taylor, Talos and Law Domes. Reconstructed mean annual temperatures show no significant change between 1882 and 2006. However, a decrease in cold season (AMJJAS) temperatures of -1.59 ±0.84 °C per decade (at 90% confidence) is observed since 1979. This cooling trend is in contrast to a surface temperature record from Ross Island (Scott Base) where significant spring warming is observed. It is also coincident with a positive trend in the Southern Annular Mode, which is linked to stronger southerly winds and increased sea ice extent and duration in the western Ross Sea."
Citation: Kate E. Sinclair, Nancy A. N. Bertler, Tas D. van Ommen, Journal of Climate 2012, doi: http://dx.doi.org/10.1175/JCLI-D-11-00496.1.
Things are looking better for living things in British rivers due to toxic waste regulation
Large-scale, long-term trends in British river macroinvertebrates - Vaughan & Ormerod (2012)
Abstract: "Rivers are among the world's most modified ecosystems, with poor water quality representing a prominent problem for over 200 years, especially in urban areas. In Western Europe, however, industrial decline, tighter regulation and improved wastewater treatment have combined over recent decades to create conditions conducive to extensive restoration and positive biological change. Here, we evaluate the river macroinvertebrate fauna of England and Wales in relation to water quality, physical habitat and climate over almost two decades. We predicted that biological recovery would be characterised by: i) greater taxon richness and prevalence of pollution-sensitive taxa, ii) larger changes in more heavily urbanised catchments, and iii) temporal trends in assemblage structure that correlated with improving water quality. Family-level richness increased on average by nearly 20% during 1991–2008, accompanied by a widespread shift towards taxa characteristic of well-oxygenated and less polluted waters. Changes were largest in the most urbanised catchments. A combination of natural gradients and anthropogenic pressures explained the variation among sites, whilst temporal changes correlated with improving water quality and variations in discharge. Positive trends were not universal, however, and there was localised deterioration in some streams draining upland areas and in the lowland south east. Our results are consistent with a large-scale ecological recovery of English and Welsh rivers since 1990, probably continuing a trend from the mid-20th century. Based on these results, we suggest: i) freshwater communities are resilient to long-term anthropogenic pressures, ii) biodiversity benefits can arise from investment and long-term restoration intended largely to enhance ecosystem services such as drinking water and sanitary concerns, and iii) long-term monitoring data collected for statutory purposes – based in this case on nearly 50,000 samples – can address scientific questions at spatial and temporal extents seldom achieved in research programmes."
Citation: I.P. Vaughan, S.J. Ormerod, Global Change Biology, DOI: 10.1111/j.1365-2486.2012.02662.x.
Reduced aerosol forcing due to air pollution control might make GHG warming very rapid
Air pollution control and decreasing new particle formation lead to strong climate warming - Makkonen et al. (2012) [FULL TEXT]
Abstract: "The number concentration of cloud droplets determines several climatically relevant cloud properties. A major cause for the high uncertainty in the indirect aerosol forcing is the availability of cloud condensation nuclei (CCN), which in turn is highly sensitive to atmospheric new particle formation. Here we present the effect of new particle formation on anthropogenic aerosol forcing in present-day (year 2000) and future (year 2100) conditions. The present-day total aerosol forcing is increased from −1.0 W m−2 to −1.6 W m−2 when nucleation is introduced into the model. Nucleation doubles the change in aerosol forcing between years 2000 and 2100, from +0.6 W m−2 to +1.4 W m−2. Two climate feedbacks are studied, resulting in additional negative forcings of −0.1 W m−2 (+10% DMS emissions in year 2100) and −0.5 W m−2 (+50% BVOC emissions in year 2100). With the total aerosol forcing diminishing in response to air pollution control measures taking effect, warming from increased greenhouse gas concentrations can potentially increase at a very rapid rate."
Citation: Makkonen, R., Asmi, A., Kerminen, V.-M., Boy, M., Arneth, A., Hari, P., and Kulmala, M.: Air pollution control and decreasing new particle formation lead to strong climate warming, Atmos. Chem. Phys., 12, 1515-1524, doi:10.5194/acp-12-1515-2012, 2012.
New analysis of hottest and coldest years in U.S. surface air since 1895
Abstract: "This paper estimates the sampling error variances of gridded monthly US Historical Climatology Network Version 2 (USHCN V2) time-of-observation bias (TOB) adjusted data. Our analysis of mean surface air temperature (SAT) assesses uncertainties, trends, and the rankings of the hottest and coldest years for the contiguous United States in the period of 1895-2008. Data from the USHCN network stations are aggregated onto a 2.5° × 3.5° latitude-longitude grid by an arithmetic mean of the stations inside a grid box. The sampling error variances of the gridded monthly data are estimated for every month and every grid box with data. The gridded data and their sampling error variances are used to calculate the contiguous US averages and their trends and associated uncertainties. The sampling error variances are smaller (mostly less than 0.2(°C)2) over the eastern US where the station density is greater, and larger (with values of 1.3(°C)2 for some grid boxes in the earlier period) over mountain and coastal areas. In the period of 1895-2008, every month from January to December has a positive linear trend. February has the largest trend of 0.162°C/decade, and September has the smallest at 0.020°C/decade. The three hottest (coldest) years measured by the mean SAT over the US were ranked as 1998, 2006, and 1934 (1917, 1895, and 1912)."
Citation: Samuel S. P. Shen, Christine K. Lee, Jay Lawrimore, Journal of Climate 2012, doi: http://dx.doi.org/10.1175/JCLI-D-11-00102.1.
How different transport types affect climate
Modeling the climate impact of road transport, maritime shipping and aviation over the period 1860–2100 with an AOGCM - Olivié et al. (2012) [FULL TEXT]
Abstract: "For the period 1860–2100 (SRES scenario A1B for 2000–2100), the impact of road transport, maritime shipping and aviation on climate is studied using an Atmosphere Ocean General Circulation Model (AOGCM). In addition to carbon dioxide (CO2) emissions from these transport sectors, most of their non-CO2 emissions are also taken into account, i.e. the forcing from ozone, methane, black carbon, organic carbon, sulfate, CFC-12 and HFC-134a from air conditioning systems in cars, and contrails. For the year 2000, the CO2 emissions from all sectors together induce a global annual-mean surface air temperature increase of around 0.1 K. In 2100, the CO2 emissions from road transport induce a global mean warming of 0.3 K, while shipping and aviation each contribute 0.1 K. For road transport, the non-CO2 impact is largest between 2000 and 2050 (of the order of 0.1 K) becoming smaller at the end of the 21st century. The non-CO2 impact from shipping is negative, reaching −0.1 K between 2050 and 2100, while for aviation it is positive and its estimate varies between 0 and 0.15 K in 2100. The largest changes in sea-level from thermal expansion in 2000 are 1.6 mm for the CO2 emissions from road transport, and around −3 mm from the non-CO2 effects of shipping. In 2100, sea-level rises by 18 mm due to the CO2 emissions from road transport and by 4.6 mm due to shipping or aviation CO2 emissions. Non-CO2 changes are of the order of 1 mm for road transport, −6.6 mm for shipping, and the estimate for aviation varies between −1.2 and 4.3 mm. When focusing on the geographical distribution, the non-CO2 impact from road transport and shipping on the surface air temperature is only slightly stronger in northern than in southern mid-latitudes, while the impact from aviation can be a factor of 5 stronger in the northern than in the southern hemisphere. Further it is observed that most of the impacts are more pronounced at high latitudes, and that the non-CO2 emissions from aviation strongly impact the NAO index. The impacts on the oceanic meridional overturning circulation and the Niño3.4 index are also quantified."
Citation: Olivié, D. J. L., Cariolle, D., Teyssèdre, H., Salas, D., Voldoire, A., Clark, H., Saint-Martin, D., Michou, M., Karcher, F., Balkanski, Y., Gauss, M., Dessens, O., Koffi, B., and Sausen, R.: Modeling the climate impact of road transport, maritime shipping and aviation over the period 1860–2100 with an AOGCM, Atmos. Chem. Phys., 12, 1449-1480, doi:10.5194/acp-12-1449-2012, 2012.
MWP was quite different from current anthropogenic global warming
Abstract: "Proxy reconstructions suggest that peak global temperature during the past warm interval known as the Medieval Climate Anomaly (MCA, roughly 950–1250 AD) has been exceeded only during the most recent decades. To better understand the origin of this warm period, we use model simulations constrained by data assimilation establishing the spatial pattern of temperature changes that is most consistent with forcing estimates, model physics and the empirical information contained in paleoclimate proxy records. These numerical experiments demonstrate that the reconstructed spatial temperature pattern of the MCA can be explained by a simple thermodynamical response of the climate system to relatively weak changes in radiative forcing combined with a modification of the atmospheric circulation, displaying some similarities with the positive phase of the so-called Arctic Oscillation, and with northward shifts in the position of the Gulf Stream and Kuroshio currents. The mechanisms underlying the MCA are thus quite different from anthropogenic mechanisms responsible for modern global warming."
Citation: Hugues Goosse, Elisabeth Crespin, Svetlana Dubinkina, Marie-France Loutre, Michael E. Mann, Hans Renssen, Yoann Sallaz-Damaz and Drew Shindell, Climate Dynamics, DOI: 10.1007/s00382-012-1297-0.
Upper layer of Bering Sea warms by 1-2K with carbon dioxide doubling
Impact of climate warming on upper layer of the Bering Sea - Lee et al. (2012)
Abstract: "The impact of climate warming on the upper layer of the Bering Sea is investigated by using a high-resolution coupled global climate model. The model is forced by increasing atmospheric CO2 at a rate of 1% per year until CO2 reaches double its initial value (after 70 years), after which it is held constant. In response to this forcing, the upper layer of the Bering Sea warms by about 2°C in the southeastern shelf and by a little more than 1°C in the western basin. The wintertime ventilation to the permanent thermocline weakens in the western Bering Sea. After CO2 doubling, the southeastern shelf of the Bering Sea becomes almost ice-free in March, and the stratification of the upper layer strengthens in May and June. Changes of physical condition due to the climate warming would impact the pre-condition of spring bio-productivity in the southeastern shelf."
Citation: Hyun-Chul Lee, Thomas L. Delworth, Anthony Rosati, Rong Zhang, Whit G. Anderson, Fanrong Zeng, Charles A. Stock, Anand Gnanadesikan, Keith W. Dixon and Stephen M. Griffies, Climate Dynamics, DOI: 10.1007/s00382-012-1301-8.
U.S. public opinion on Climate change depends mostly on elite cues and economic factors
Abstract: "This paper conducts an empirical analysis of the factors affecting U.S. public concern about the threat of climate change between January 2002 and December 2010. Utilizing Stimson’s method of constructing aggregate opinion measures, data from 74 separate surveys over a 9-year period are used to construct quarterly measures of public concern over global climate change. We examine five factors that should account for changes in levels of concern: 1) extreme weather events, 2) public access to accurate scientific information, 3) media coverage, 4) elite cues, and 5) movement/countermovement advocacy. A time-series analysis indicates that elite cues and structural economic factors have the largest effect on the level of public concern about climate change. While media coverage exerts an important influence, this coverage is itself largely a function of elite cues and economic factors. Weather extremes have no effect on aggregate public opinion. Promulgation of scientific information to the public on climate change has a minimal effect. The implication would seem to be that information-based science advocacy has had only a minor effect on public concern, while political mobilization by elites and advocacy groups is critical in influencing climate change concern."
Citation: Robert J. Brulle, Jason Carmichael and J. Craig Jenkins, Climatic Change, DOI: 10.1007/s10584-012-0403-y.
Solar cycle possibly affects Madden-Julian oscillation
A correlation of mean period of MJO indices and 11-yr solar variation - Blanter et al. (2012)
Abstract: "This paper focuses on the decadal to multi-decadal evolution of the spectral properties of the Madden-Julian Oscillation (MJO). Guided by former studies, we test whether the ~11-yr (Schwabe) cycle of solar activity could be reflected in the spectral features of MJO indices: namely, we study the evolution of MJO mean period within different period ranges and compare these with the evolution of solar activity. We focus on solar proxies best linked to UV emission and cosmic rays: sunspot number WN, F10.7 flux, core-to-wing ratio MgII, and galactic cosmic rays (GCR). A clear solar signature in MJO spectral properties is indeed found and shown to be both statistically significant and robust. UV proxies are found to be better correlated with MJO mean period than GCR, thus supporting rather the ozone mechanism of solar impact on MJO. The overall correlation with solar activity is found to be stronger in the Indian Ocean. Long periods (e.g. 50–80 day) are better correlated with solar activity than shorter periods (e.g. 30–60 day). A marked change in the relationship between MJO mean period and solar activity takes place in the declining phase of solar cycle 23, adding to its unusual character."
Citation: Elena Blanter, Jean-Louis Le Mouël, Mikhail Shnirman, Vincent Courtillot, Journal of Atmospheric and Solar-Terrestrial Physics, http://dx.doi.org/10.1016/j.jastp.2012.01.016.
Tree-ring-based reconstructions underestimate volcanic cooling
Abstract: "The largest eruption of a tropical volcano during the past millennium occurred in AD 1258–1259. Its estimated radiative forcing was several times larger than the 1991 Pinatubo eruption. Radiative forcing of that magnitude is expected to result in a climate cooling of about 2 °C. This effect, however, is largely absent from tree-ring reconstructions of temperature and is muted in reconstructions that employ a mix of tree-rings and other proxy data. This discrepancy has called into question the climate impact of the eruption. Here we use a tree-growth model driven by simulated temperature variations to show that the discrepancy between expected and reconstructed temperatures is probably an artefact caused by a reduced sensitivity to cooling in trees that grow near the treeline. This effect is compounded by the secondary effects of chronological errors due to missing growth rings and volcanically induced alterations of diffuse light. We support this conclusion with an assessment of synthetic proxy records created using the simulated temperature variations. Our findings suggest that the evidence from tree rings is consistent with a substantial climate impact of volcanic eruptions in past centuries that is greater than that estimated by tree-ring-based temperature reconstructions."
Citation: Michael E. Mann, Jose D. Fuentes & Scott Rutherford, Nature Geoscience, (2012), DOI: doi:10.1038/ngeo1394.
CLASSIC OF THE WEEK: Revelle & Suess (1957)
Carbon Dioxide Exchange Between Atmosphere and Ocean and the Question of an Increase of Atmospheric CO2 during the Past Decades - Revelle & Suess (1957) [FULL TEXT]
Abstract:"From a comparison of C14/C12 and C13/C12 ratios in wood and in marine material and from a slight decrease of the C14 concentration in terrestrial plants over the past 50 years it can be concluded that the average lifetime of a CO2 molecule in the atmosphere before it is dissolved into the sea is of the order of 10 years. This means that most of the CO2 released by artificial fuel combustion since the beginning of the industrial revolution must have been absorbed by the oceans. The increase of atmospheric CO2 from this cause is at present small but may become significant during future decades if industrial fuel combustion continues to rise exponentially. Present data on the total amount of CO2 in the atmosphere, on the rates and mechanisms of exchange, and on possible fluctuations in terrestrial and marine organic carbon, are inadequate for accurate measurement of future changes in atmospheric CO2. An opportunity exists during the International Geophysical Year to obtain much of the necessary information."
Citation: Roger Revelle, Hans E. Suess, Tellus, Volume 9, Issue 1, pages 18–27, February 1957, DOI: 10.1111/j.2153-3490.1957.tb01849.x.
?This is a cross-post from AGW Observer. When each paper is published, it is notified in AGW Observer Facebook page and Twitter page. At least some of these are also retweeted in Skeptical Science Twitter page. ?Here's the archive for the research papers of previous weeks. If this sort of thing interests you, be sure to check out A Few Things Illconsidered. They also have a weekly posting containing lots of links to new research and other climate related news.


 0
0  0
0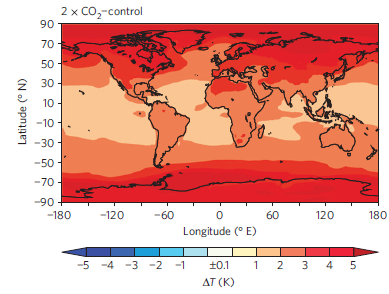 And they unveiled this as what happens if you inject sulphur particles into the stratosphere to cope:
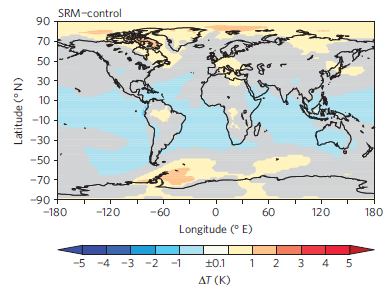 Of course the oceans die but you can't have everything.
Anderson would say we are committed to this now, if "all" the studies saying there are limits to how rapidly the fossil infrastructure can be dismantled are correct. Cheery, eh?
Of course the oceans die but you can't have everything.
Anderson would say we are committed to this now, if "all" the studies saying there are limits to how rapidly the fossil infrastructure can be dismantled are correct. Cheery, eh?


Comments