Climate Science Glossary

Term Lookup

Enter a term in the search box to find its definition.

Settings

Use the controls in the far right panel to increase or decrease the number of terms automatically displayed (or to completely turn that feature off).

Term Lookup

Settings


All IPCC definitions taken from Climate Change 2007: The Physical Science Basis. Working Group I Contribution to the Fourth Assessment Report of the Intergovernmental Panel on Climate Change, Annex I, Glossary, pp. 941-954. Cambridge University Press.

Home Arguments Software Resources Comments The Consensus Project Translations About Support

Bluesky Facebook LinkedIn Mastodon MeWe

Twitter YouTube RSS Posts RSS Comments Email Subscribe


Climate's changed before
It's the sun
It's not bad
There is no consensus
It's cooling
Models are unreliable
Temp record is unreliable
Animals and plants can adapt
It hasn't warmed since 1998
Antarctica is gaining ice
View All Arguments...


Username
Password
New? Register here
Forgot your password?

Latest Posts

Archives

Extreme Events Increase With Global Warming

Posted on 11 November 2011 by Rob Painting

For a more basic version of this post, see here

That continued warming of the Earth will cause more frequent and intense heatwaves is hardly surprising, and has long been an anticipated outcome of global warming. Indeed the 1990 Intergovernmental Panel on Climate Change (IPCC) Policymakers Summary stated that: 

"with an increase in the mean temperature, episodes of high temperatures will most likely become more frequent in the future, and cold episodes less frequent."

One such "high temperature episode" was the monster summer heatwave centred near Moscow, Russia in 2010, where temperatures rocketed well above their normal summertime maximum and were so record-shattering they may have been the warmest in almost 1000 years.

Rahmstorf and Coumou (2011) developed a statistical model and found that record-breaking extremes depend on the ratio of trend (warming or cooling) to the year-to-year variability in the record of observations. They tested this model by analysing global temperatures and found that warming increased the odds of record-breaking. When applied to the July 2010 temperatures in Moscow, they estimated a 80% probability that the heat record would not have occurred without climate warming.
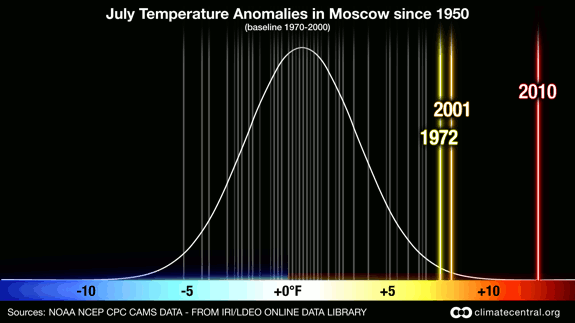
Figure 1 - Probability of July average temperature anomalies in Moscow, Russia since 1950. This image shows that the average temperature in Moscow for July 2010 was significantly hotter than in any year since 1950. Credit: Claudia Tebaldi and Remik Ziemlinski. From ClimateCentral.org

Some statistical background

Earlier statistical work on record-breaking events has shown that for any time series that is stationary (i.e. no trend), the probability of record-breaking falls with each subsequent observation. This is known as the 1/n rule, where n equals the previous number of data in the series. For example, the first observation has a 1-in-1 chance of being the record extreme (100%), the second has a 1-in-2 chance (50%), the third a 1-in-3 chance, and so on.

For climate heat records, the stationarity rule is not apparent, as one might expect in a warming world. Previous work in this area has shown that the slowly warming mean (average) temperature is responsible for this nonstationarity.   

Monte Carlo 

Following on from this earlier work, Rahmstorf and Coumou (2011) sought to disentagle the two effects of the mean change in temperature (climate warming), from the random fluctuations of weather, so as to find out the contribution of each to record-breaking. To do this, the study authors turned to Monte Carlo simulations. These are computer-generated calculations which use random numbers to obtain robust statistics. A useful analogy here is rolling a dice. Rolling once tells us nothing about the probability of a six turning up, but roll the dice 100,000 (as in this experiment) and you can calculate the odds of rolling a six. 

From the simulations the authors obtain 100 values which represent a 100 year period. Figure 2(A) - 2(C) are the "synthetic" time series, and 2(D), 2(E) are respectively, the 'synthetic' global mean and Moscow July temperature. In all panels the data have been put into a common reference frame (nomalized) for comparison. (See figure 1 for an example of a Gaussian or normal distribution. Noise represents the year-to-year variability). 
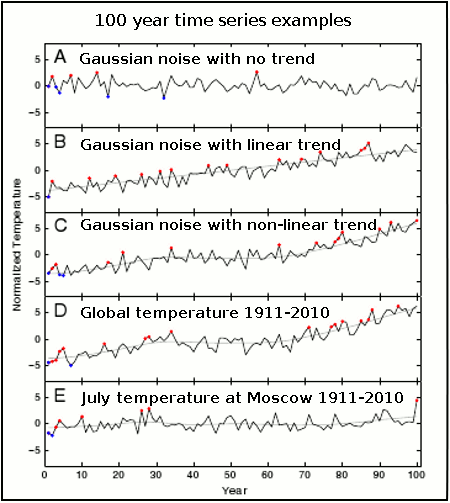
Figure 2 - examples of 100 year time series of temperature, with unprecedented hot and cold extremes marked in red and blue. A) uncorrelated Gaussian noise of unit standard deviation. B) Gaussian noise with added linear trend of 0.078 per year. C) Gaussian noise with non-linear trend added (smooth of GISS global temp data) D) GISS annual global temp for 1911-2010 with its non-linear trend E) July temp at Moscow for 1911-2010 with non-lnear trend. Temperatures are normailzed with the standard deviation of their short-term variability (i.e. put into a common frame of reference). Note: For the Moscow July temperature (2E) the long-term warming appears to be small, but this is only because the series has been normalized with the standard deviation of that records short-term variability. In other words it simply appears that way because of the statistical scaling approach - the large year-to-year variability in Moscow July temperatures makes the large long-term increase (1.8°C) look small when both are scaled. Adapted from Rahmstorf & Coumou (2011)

Follow steps one.....

Initially, the authors ran the Monte Carlo simulations under 3 different scenarios, the first is for no trend (2[A]), with a linear trend (2[B]) and a nonlinear trend (2[C]). The record-breaking trends agree with previous statistical studies of record-breaking namely that: with no trend the probability of record-breaking falls with each observation (the 1/n rule), and with a linear trend the probability of record-breaking gradually reduces until it too exhibits a linear trend. With a non-linear trend (2[C]), the simulations show behaviour characteristic of the no-trend and linear trend distibutions. Figures 2(D) and 2(E) are the actual GISS global and Moscow July temperatures respectively.   

.....two.....

Next, the authors then looked at both the GISS global and Moscow July temperature series to see whether they exhibited a gaussian-like distribution (as in the 'lump' in figure 1). They did, so this supports earlier studies  indicating that temperature deviations are fluctuating about, and shifting with a slowly moving mean (as in the warming climate). See figure 3 below.   

Figure 3 -Histogram of the deviations of temperatures of the past 100 years from the nonlinear climate trend lines shown in Fig. 2(D)  and (E) together with the Gaussian distributions with the same variance and integral. a) Global annual mean temperatures from NASA GISS, with a standard deviation of 0.088 ºC. (b) July mean temperature at Moscow station, with a standard deviation of 1.71 ºC. From Rahmstorf & Coumou (2011)

.....and three.

Although the authors calculate probabilities for a linear trend, the actual trend for both the global, and Moscow July temperature series is nonlinear. Therefore they separated out the long-term climate signal, and the weather-related annual temperature fluctuation, which gave them a climate 'template' on which to run Monte Carlo simulations with 'noise' of the same standard deviation (spread of annual variability from the average, or mean). This is a bit like giving the Earth the chance to roll the 'weather dice' over and over again.

From the simulations with, and without the long-term trend, the authors could then observe how many times a record-breaking extreme occurred.
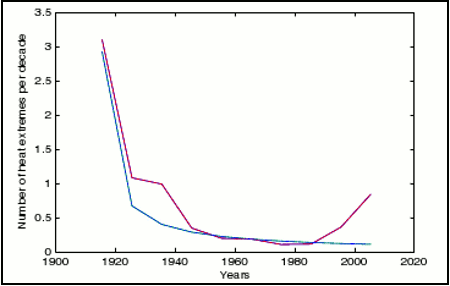
Figure 4 -Expected number of unprecedented july heat extremes in Moscow for the past 10 decades. Red is the expectation based on Monte Carlo simulations using the observed climate trend shown in Figure 2(E). Blue is the number expected in a stationary climate (1/n law). Warming in the 1920's and 1930's and again in the last two decades increases the expectation of extremes during those decades. From Rahmstorf and Coumou (2011)

Large year-to-year variability reduces probability of new records

A key finding of the paper was that if there are large year-to-year non-uniform fluctuations in a set of observations with a long-term trend, rather than increasing the odds of a record-breaking event, they act to reduce it because the new record is calculated by dividing the trend by the standard deviation  The larger the standard deviation the smaller the probability of a new extreme record.

This can be seen by comparing the standard deviation of the NASA GISS, and Moscow July temperature records (figure 3), plus figure 2(D) and [E]). As the GISS global temperature record has a smaller standard deviation (0.088°C) due to the smaller year-to-year fluctuations in temperature, you will note in figure 2(D) that it has a greater number of record-breaking extremes than the Moscow July temperature record over the same period (2[E]). So, although the long-term temperature trend for Moscow in July is larger (100 year trend=1.8°C), so too is the annual fluctuation in temperature (standard deviation=1.7°C), which results in lower probability of record-breaking warm events. 

Interestingly it's now plain to see why the  MSU satellite temperature record, which has a large annual variability (large standard deviation, possibly from being overly sensitive to La Niña & El Niño atmospheric water vapor fluctuations) still has 1998 as it warmest year, whereas GISS has 2005 as it's warmest year (2010 was tied with 2005, so is not a new record). Even though the trends are similar in both records, the standard deviation is larger in the satellite data and therefore the probability of record-breaking is smaller. 

That other Russian heatwave paper

The results of this paper directly contradict the findings of Dole (2011) who discounted a global warming connection with the 2010 Russian heatwave. Rahmstorf & Coumou (2011) demonstrate that the warming trend from 1980 onwards (figure 4) greatly increased the odds of a new record-breaking warm extreme, and in fact should have been anticipated.

It turns out that Dole (2011) failed to account for a quirk in the GISS Moscow station data which had wrongly applied the annual urban heat island (UHI) adjustment for the monthly July temperatures, when UHI is a winter phenomenon in Moscow. This meant that the large warming trend evident there in July had been erroneously removed. This was confirmed by looking at Remote Sensing Systems (RSS) satellite data over the last 30 years, which shows a strong warming trend in Moscow July temperatures. See Real Climate post "The Moscow Warming Hole" for detail, and note Figure 5 below.
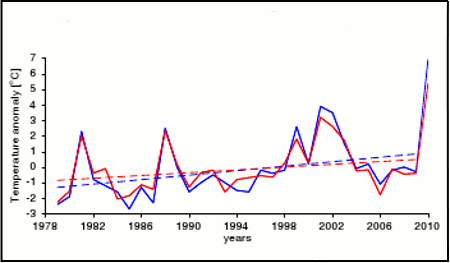
Figure 5 - Comparison of temperatues anomalies from RSS satellite data (in red) over the Moscow region versus Moscow station data (in blue). Solid lines shows the average July value for year, whereas the dashed lines show the linear trend for 1979-2009. Satellite data have a trend of 0.45°C per decade, as compared to 0.72°C per decade for the Moscow station data.

Whatchoo talkin' bout Willis?

Using the GISS data from 1911-2010 (a nonlinear trend), the authors calculate a 88% probability the extreme Russian heatwave (a record in the last decade of the series) was due to the warming trend. Clearly the summer temperatures for July 2010 in Moscow were a massive departure from normal, and including them would create bias, so the study authors exclude 2010 from their analysis, and re-calculate for 1910-2009. They found a 78% probability the freak heatwave was due to warming, and extending their analysis back to include the entire GISS temperature observations (1880 -2009), they found an 80% probability.

So to sum up:

  • Rahmstorf and Coumou (2011) is a statistical/analytical study, which does not look at the physical causes of the 2010 Russian heatwave. Instead they assess the likelihood of record-breaking extremes. 
  • Based on earlier work, and confirmed by the Monte Carlo simulations; in a climate with no trend (no long-term warming or cooling), the probability of record-breaking extremes falls over time (perhaps contrary to popular belief).
  • With a warming (linear) trend, the number of record-breaking warm extremes reduce until they eventually increase in a linear manner.
  • With a nonlinear trend (warm/stagnation intervals) the probability of record-breaking is a combination of the no trend/linear trend scenarios.
  • Larger annual fluctuations (larger standard deviation) reduce the number of records, whereas smaller fluctuations increase the number of record- breaking extremes.
  • This helps explain why the satellite temperature record (large annual fluctuation) has 1998 as it warm record, whereas GISS (small annual fluctuation) has 2005 - GISS has a greater likelihood of seeing record-breaking.
  • By seperating out the random (weather) component and the long-term (warming) component, the authors established there is a 80% probability that the 2010 July temperature record in Moscow would not have happened without climate warming from 1880-2009. 
  • The record-breaking extreme should have been anticipated, which contradicts earlier work on the Russian heatwave (Dole [2011]).
  • In a warming world expect to see more record-breaking warm temperatures. 

0 0

Printable Version  |  Link to this page

Comments

1  2  3  Next

Comments 1 to 50 out of 105:

  1. Kudos on a very well-written article about rather complex analyses.
    0 0
  2. What are your thoughts on Roger Pielke, Jr.'s critique (and the NOAA follow-up)?
    0 0
  3. Maybe Roger Jr. could be induced to comment. He has had a lot to say about RC11 on his own blog, briefly at Real Climate and a comment yesterday at Kloor's where he says it is a "nonsense paper" On his blog he describes the methods in RC11 as Stats 101 ball and urn stuff tricked out with a bunch of complexity. Rahmstorf retired from the fray early at Real Climate and I don't blame him. You folks here at SkS have the chops and the persistence to talk this over with the junior Pielke. It needs to be done. Paul Middents
    0 0
  4. Rob Painting "That continued warming of the Earth will cause more frequent and intense heatwaves is hardly surprising, and has long been an anticipated outcome of global warming." From the two graphs below it would appear that the intensity of heat during a hotter phase does seem to be greater in the more recent years, but it does not show an increase in the frequency of hot cycles. One may be able to claim that global warming will have a greater probability of causing a higher avearge temperature during a heat wave, evidence does not show or prove the conclusion that frequencies of heat waves will increase. source. source.
    0 0
  5. Norman @4, The area studied in your post is rather arbitrary. Please look at the latest paper that Hansen et al are working on. Available here. They conclude: "The "climate dice" describing the chance of an unusually warm or cool season, relative to the climatology of 1951-1980, have progressively become more "loaded" during the past 30 years, coincident with increased global warming. The most dramatic and important change of the climate dice is the appearance of a new category of extreme climate outliers. These extremes were practically absent in the period of climatology, covering much less than 1% of Earth's surface. Now summertime extremely hot outliers, more than three standard deviations (σ) warmer than climatology, typically cover about 10% of the land area. Thus there is no need to equivocate about the summer heat waves in Texas in 2011 and Moscow in 2010, which exceeded 3σ – it is nearly certain that they would not have occurred in the absence of global warming. If global warming is not slowed from its current pace, by mid- century 3σ events will be the new norm and 5σ events will be common." Please note the highlighted text. Also, not the following key figure from Hansen et al. (2011) for a truly global perspective: Jun-Jul-Aug surface temperature anomalies over land in 1955, 1965, 1975 and 2003-2011 relative to 1951-1980 mean temperature in units of the local standard deviation of temperature. [H/T Daniel Bailey]
    0 0
  6. Nobody at All @ 2 - to describe Pielke Jnr's comments as a critique is being very, very charitable. None of his comments indicate he even understands the paper. Check out the Real Climate article hyper-linked in the post above. As for the NOAA follow up, I wonder why they change their definition of Western Russia between the original paper and their response? It's evident there is strong warming in and around Moscow (north west quadrant) in their graphic. Which is a better indicator of record-breaking temperatures in Moscow in July? Moscow itself, or the Western Russian region? We'll have to see how it plays out, but I note that Rahmstorf & Coumou have applied their analysis to a stackload of other datasets. The paper is still in pre-publication.
    0 0
  7. Norman @ 4 - "One may be able to claim that global warming will have a greater probability of causing a higher avearge temperature during a heat wave, evidence does not show or prove the conclusion that frequencies of heat waves will increase." Norman re-read the post again. If the temperature series follows a gaussian distribution (as illustrated in figure 1) then it will indeed have more record-breaking warm events with warming. That's one of the key points affirmed by this study. If you look at the analogy in the basic version of this post, it's like the incoming tide rising higher and higher. Of course record-breaking warm events will increase. It's a no-brainer. The essential difference between the probability of record-breaking in the GISS and Moscow July temps is due to the larger standard deviation (i.e natural variation) at Moscow. This lowers the probability of record-breaking.
    0 0
  8. Not sure if extreme rainfall and extreme heat have the same statistical characteristics, although IMO they should be similar since they often result from the same blocking weather patterns. This link http://climate.met.psu.edu/www_prod/features/rainextreme.php has a discussion of calculating the extreme value of "N-year events" from past rainfall events. That short discussion does not examine trends or attribution. But it does contrast somewhat with the Gaussian assumption in Figure 1. Also Figure 1 is too short a period of record to obtain a meaningful probability distribution IMO.
    0 0
  9. You might want to slightly edit the line "... may have been the warmest in almost 1000 years" - the link goes to a very good paper, but that one only makes that claim since 1500, and that will just provide an attack point for the deniers :(
    0 0
  10. macwithoutfries @ 9 - "You might want to slightly edit the line" Mac, this is from the supplementary material of Barriopedro (2011): "On the other hand, proxy data suggests that the summer of 2010 in central Russia was likely the warmest since the early 1360s, maybe even further back to the 10th and 11th centuries, when similar magnitudes may have been experienced" Hence my use of the word "may". Barriopedro (2011) found that the 2003 & 2010 heatwaves broke 500-year long temperature records over 50% of Europe.
    0 0
  11. Eric (skeptic) @ 8 - "Not sure if extreme rainfall and extreme heat have the same statistical characteristics, although IMO they should be similar since they often result from the same blocking weather patterns." Eric, the first sentence in the Penn State page you linked to, contradicts your claim: "Rainfall does not follow a Gaussian distribution, so you cannot discern its extreme values simply by looking at the ends of a bell curve"
    0 0
  12. "What we are seeing is there are more floods, more extreme weather events, higher temperature, more variable rainfalls and we believe that is caused by climate change. And we should expect this to increase, sadly," Andrew Steer, the World Bank's special envoy for climate change, told reporters in the Vietnamese capital Hanoi. Source: “Climate change to bring more floods,” Agence France-Presse, Nov 10, 2011 To access the entire article, click here.
    0 0
  13. Albatross, that figure is incredibly telling and quite chilling. Roll the dice. Who's next under the 3-sigma browns? Now it's a lot more people than it was 30 years ago. Soon enough it'll be common...
    0 0
    Response:

    [DB] How about some more chillin', then?  From the same source:

    Click to enlarge

    Figure 4. Frequency of occurrence (y-axis) of local temperature anomalies divided by local standard deviation (x-axis) obtained by binning all local results for 11-year periods into 0.05 intervals. Area under each curve is unity.

  14. There is very strong evidence of increased extremes to be found in the Indices of Extremes in the European Climate Assessment and Dataset. The database interface is very user friendly: To generate maps, select 'trend maps,' pick an 'index category,' select a specific index and a time period. Particularly interesting are indices under the category 'Heat,' with maps comparing 1951-1978 to 1979-2010. Here is a two image animation, showing the pair of maps depicting the index TX90p - temperature greater than the 90th percentile of daily max - for 1951-78 and 1979-2010. This index is a measure of 'warm days.' -- source The map that is primarily green/blue (no trend - decreasing) is the earlier period; the map that is overwhelmingly red is the latter period. Other heat indices show that 1979-2010 saw increasing numbers of summer days, increasing 'warm spell duration index', increasing consecutive summer days and an increase in the max daily temperature. Both the number of warm wet days and the number of warm dry days reversed their 1951-1978 declines, increasing strongly over 1979-2010. This suite of indices demonstrates conclusively that warm days are becoming more frequent, warm spells are lasting longer and are warmer. However, the number of days with snow depth > 50 cm strongly decreased in Scandinavia while increasing in west/central Europe. This large contrast between nearby regions may exist because weather is becoming more variable, but they are fueling denials based on 'there's snow in my backyard!'
    0 0
  15. Rob Painting @10 - very good point, I have missed that reference to 1360; however my experience with deniers is showing that they like to focus on the slightest detail and draw away the debate on it, so it is always better to avoid giving them any such 'distraction point' - like in this case saying " may have been the warmest in more than 500-700 years" instead of "almost 1000 years" - the impact on the reader is the same and deniers will not be able to cling on that point since they already have too much 'invested' in the story with 'little ice age'!
    0 0
  16. Shouldn't your title be : "Heatwaves Increase With Global Warming"? I suppose that the probability of some "extreme events" like cold waves are decreasing, for the same reason their warm counterpart is increasing.
    0 0
  17. Skept: Since many of the extreme events in the USA (and Australia) this year were floods, it would be illogical to restrict the title to heatwaves.
    0 0
  18. michael sweet: As far as I understand it, Rahmstorf and Comou 2011 deal with temperature series and distribution of extreme temperatures. So, technically, their conclusion cannot be extended to precipitation – even if we know that intensity of precipitation events is projected to increase in IPCC models.
    0 0
  19. Skept, While the lead post deals primarily with heat records, in Moscow this summer they also suffered record fires and drought. These were caused by the heat. Should we leave out any reference to these related effects? It seems to me that you want to minimize the deleterious effects of these type of events. I do not think we should minimize the event.
    0 0
  20. Michael : « you want to minimize the deleterious effects of these type of events » I would like the negative effects of AGW (including unique extreme events) to be precisely detected, attributed, evaluated. As a true skeptic (or I hope so), I’v no sympathy for those who try to distort the results of science (in a maximizing or minimizing sense) in order to influence public opinion and promote an ideological or economic agenda. And as a citizen, I’d like to know the true externalities of carbon-based energy systems. But ‘true’ means simply… true : we need to assess costs of climate-related hazards with and without AGW in order to make the optimal choices, at least if we favour an evidence-based policy. You are right for the other side-effects of hot temperatures (fires, drought), but do you mean that there is no side-effects of extreme cold temperatures too, in Russia or elsewhere ? If so, hem, I would conclude that ‘you try to minimize the deleterious effects of these type of events’ ☺ But after all, if hot extreme events in a warming climate are more numerous than cold extreme events in a stable climate (as it seems to be according to Figure 2), the choice for the title is justified.
    0 0
  21. skept.fr @20, while I admire a commitment to truth in any person, your reduction of the issue to heatwaves only obscures truth rather than reveals it. As already noted by other commentators, by that formula you exclude from consideration the drought and fires that accompany the heatwaves. Indeed, you also exclude the droughts (such as those in the Amazon, and in the South West corner of Australia) which are largely independent of heat waves. You also exclude from consideration the many floods in recent years several of which have a high probability of having been caused, or made worse by global warming. You also draw attention away from the information in the inline graphs @13. The distribution of temperatures shown in those graphs not only shifts the mean to the right, but broadens the distribution. That means the reduction in cold wave events is nowhere near as large as the increase in heatwave events. So, contrary to your 16, this is not a case of an equal number of extreme events, with increase in hot events compensated for by a decrease in cold events. There is an overall increase in the combined total of hot and cold events, even though cold events are becoming rarer.
    0 0
  22. Hansen's most recent paper shows 2009 with 7% Extreme heating over land, 2010 as 17% Extreme heating and 2011 as 10% Extreme heating (See figure 6 in linked study). All these years had 0% Extereme cold and in fact 0% Very cold, the next warmer bin (Very hot was 20, 20, and 17%). From 1950-1980 less than 0.5% of land area was either Extremely hot or Extremely cold. I do not think that there is a problem with minimizing the side effects of cold weather, compared to current issues with extraordinary heat, drought and flooding. Perhaps you could site an example of a scientist "minmimizing the deleterious effects of a cold event"? We are all aware of the deleterious effects of cold following extreme volcanic erruptions, those are beyond human control. Consider Toms argument also. We want to be honest but not minimize the danger.
    0 0
  23. Tom C#21: "the information in the inline graphs @13. The distribution of temperatures shown in those graphs not only shifts the mean to the right, but broadens the distribution." Of course, those are summer (JJA) graphs, so they do not deal with cold extremes in any way. But in dealing primarily with heat, this post does not explicitly exclude its broader effects. No such exclusion is in any way logical. Anyone who lived through this summer in the southwestern US saw little separation between heatwave-drought-fire; the latter two are symptoms of prolonged extreme heat. All are connected: in fact, it was the passage of Hurricane Irene to the east of Texas that brought winds turning local fires into wildfires. There is also ample evidence, at least on a local scale, that a bad fire season leads to a higher probability of flooding in the following wet season: Water quickly saturates the thin layer of permeable soil above the hydrophobic zone not being slowed by a vegetative canopy. Slower infiltration rates result in an increased intensity of surface runoff and erosion. But we've already seen a 'trifecta' of extreme behavior: National Weather Service forecast offices and River Forecast Centers have been gearing up for the third leg of a triple crown of disasters consisting of continuing drought and wildfires in the west, a record-breaking tornado outbreak in the South and record flooding along the Lower Mississippi River. And if tropical cyclones (TCs) are more frequent or more intense due to warming, you can add in the associated heavy Predecessor Rain Events (PREs) described by Galarneau and Bosart 2010: PREs are high-impact weather events that can often result in significant inland flooding, either from the PRE itself or from the subsequent arrival of the main rain shield associated with the TC that falls onto soils already saturated by the PRE. Further along the scale, consider what may be a changing winter pattern towards more frequent extreme snowfall totals: There will still be colder than average winters in a world that is experiencing warming, with plenty of opportunities for snow. The more difficult ingredient for producing a record snowstorm is the requirement of near-record levels of moisture. Global warming theory predicts that global precipitation will increase, and that heavy precipitation events--the ones most likely to cause flash flooding--will also increase. Our prior extreme weather threads (and here) addressed these connections.
    0 0
  24. Muoncounter, Since this an Australian web site I am surprised you said JJA is a summer only time;). In the paper Hansen also shows DJF data and it looks very similar. The primary difference is in winter the standard deviation of temperature is greater. This means a stronger conclusion can be drawn from the JJA data.
    0 0
  25. Michael : I consider the Tom’s argument, and in #20 I finally conclude in the same way when looking at Figure 2 (an overall increase of combined event). I’m please to read Hansen paper. Tom : my initial point was not that hot events are limited to heat waves (nor extreme events to temperature break-records), just that the shift of the mean to the right you describe logically implies a lesser probability for extreme cold events – a quite consensual conclusion from IPPC AR4. But you get the point for the overall increase. Again, my ultimate concern is to correctly estimate the present and future carbon cost for society : I hope we all have the same agenda.
    0 0
  26. michael sweet#24: Please excuse my northern hemispherocentrism. It is interesting to note that the new Hansen et al paper finds verification of the much-discussed (and criticized) 1988 models: Hansen et al. (1988) projected how the odds would change due to global warming for alternative greenhouse gas scenarios. Their scenario B, ... led to four of the six dice sides being red early in the 21st century based on global climate model simulations. Figure 5 confirms that the actual occurrence of summers in the "hot" category (seasonal mean temperature anomaly exceeding +0.43 σ) has approximately reached the level of 67% required to make four sides of the dice red. ... However, note that the odds of an unusually cool Jun-Jul-Aug (by the standards of 1951-1980) have fallen more than the odds of having an unusually cold Dec-Jan-Feb. Comparable loading of the dice has occurred in winter, where "hot", i.e., mild, winters now occur almost two-thirds of the time. --emphasis added The new paper's Figure 7 is extremely relevant: It depicts the inexorable trend of JJA for an increasing percentage of the globe into 'hot,' 'very hot,' and 'extremely hot.' This graph could make even the 'pausers' take notice, as there is no evidence of warming having paused.
    0 0
  27. Interesting paper here, which directly connects fire with temperature in a more indirect way, so to speak : Forecasting Fire Season Severity in South America Using Sea Surface Temperature Anomalies
    0 0
  28. Muoncounter, I am sure we are on the same page. Hansen's paper is shocking. Skept, It sounds to me like we generally agree. I think the data already exists to show the warming is much more downside than any lessening of cold is upside. I think Hansen's paper is the final nail in the coffin of the deniers. If we both keep reading we will come to agreement soon. There are a lot of people on this website who call themselves "skeptics" who are really deniers so your handle looks funny.
    0 0
  29. muoncounter @23, the top row of graphs is Jun-Jul-Aug, but the second row is Dec-Jan-Feb. Consequently my point @21 stands.
    0 0
  30. Tom C#29: Point taken. However, your #21 "an overall increase in the combined total of hot and cold events, even though cold events are becoming rarer" seems like a stretch. Why include cold events in the 'combined total,' if the rightward migration of these distribution curves shows that extreme cold events are becoming less frequent? See Hansen again: The most important change of the climate dice is probably the appearance of extreme hot summer anomalies, with mean temperature at least three standard deviations greater than climatology, over about 10% of land area in recent years. That's illustrated in Hansen's Fig 7: --full scale The vertical scale is % area; summertime area classed as 'hot' has tripled, 'very' and 'extremely' hot went from negligible to sizable percentages. In that context, this really is about increased probability - and extent - of extreme heatwaves (with their accompanying drought and fire risk). So what comes after the 3 sigma 'extremely hot'? Biblical?
    0 0
  31. muoncounter @30, I do not think we are significantly disagreeing. Your quote from Hansen, "The most important change of the climate dice is probably the appearance of extreme hot summer anomalies..." is exactly correct, and exactly to the point. My purpose, however, was to point out that the increase hot events was not matched by an equivalent decrease in cold events. As can be seen from the following graph (also from Hansen et al, 2011): a) cold (> 1 sigma) events have approximately halved over the last 40 years; b) very cold (>2 sigma) events have declined but not appreciably; and c) extremely cold (>3 sigma) events have never been frequent, but have become rarer, but one still occurred as recently as 2010. In contrast: e) hot (>1 sigma) events have tripled on frequency; d) very hot events have risen from about 1% to about 20% of land area; and e) extremely hot (3 sigma) have risen from negligible amounts to about 5% of land area. Obviously the big news in this is the rise of hot events. There is, however, a common perception that that rise will be matched by and compensated by a decline in cold events. That perception is wrong, and needs to be rebutted.
    0 0
  32. Tom: That's very interesting because it is counterintuitive. A better insulated atmosphere leads to a reduced diurnal range and even more importantly reduced seasonal range - both of which are observed. My first reaction was to assume from this that extreme cold events should be disappearing faster than warm ones should be appearing. The fact that this reasoning fails presumably arises from changes in weather patterns?
    0 0
  33. Kevin C @32, as Hansen says:
    "Figure 5 confirms that the actual occurrence of summers in the "hot" category (seasonal mean temperature anomaly exceeding +0.43 σ) has approximately reached the level of 67% required to make four sides of the dice red. The odds of a "cold" season or an "average" season now each correspond to one side of the six-sided dice, to a good approximation. However, note that the odds of an unusually cool Jun-Jul-Aug (by the standards of 1951-1980) have fallen more than the odds of having an unusually cold Dec-Jan-Feb. Comparable loading of the dice has occurred in winter, where "hot", i.e., mild, winters now occur almost two-thirds of the time. Figures 4 and 5 show that the "loading of the dice" is less in winter than in summer, despite the fact that warming has been larger in winter. Larger winter warming is more than offset by the fact that interannual variability is much larger in winter than in summer, as shown in Figure 2. Thus climate warming may not be as obvious to the public in winter as in summer, especially because snowfall amounts increase with global warming (in regions remaining cold enough for snow) and there is a tendency to equate heavy snowfall with harsh winter conditions, even if temperatures are not extremely low."
    (My emphasis) Regarding Figure 2 he writes:
    "Interannual variability of surface temperature is larger in the winter hemisphere than in the summer and larger over land than over ocean (Figure 2). The basic reason for the large winter variability is the huge difference in temperature between low latitudes and high latitudes in winter. This allows the temperature at a given place to vary by tens of degrees depending on whether the wind is from the south or north. The latitudinal temperature gradient in summer is much smaller, thus providing less drive for exchange of air masses between middle latitudes and polar regions -- and when exchange occurs the effect on temperature is less than that caused by a winter 'polar express' of Arctic (or Antarctic) air delivered to middle latitudes."
    To that I would add that there is a possibility that increased warmth leads to larger weather cells. That being the case they would draw cold air further south (or north) than was previously the case, further compensating for the increased warmth in winter. That is, air from 20 degrees North drawn down over the midwest may be warmer, but because of larger weather cells, air my now be drawing down from 15 degrees North. Of course, this last observation is just that, an observation I have made about Australian weather patterns. I do not know if any scientific research has been done on this. Consequently my observations are no more trustworthy than any other anecdote.
    0 0
  34. Tom C#33: "draw cold air further south (or north) than was previously the case," Petoukhov and Semenov 2010 illustrates this point: Our simulations ... demonstrate that lower-troposphere heating over the B-K seas in the Eastern Arctic caused by the sea ice reduction may result in strong anticyclonic anomaly over the Polar Ocean and anomalous easterly advection over northern continents. This causes a continental-scale winter cooling reaching −1.5°C, with more than 3 times increased probability of cold winter extremes over large areas including Europe. Perhaps this December 2010 illustration of a distended NS jet stream is also case in point. Prior discussion: Does cold weather disprove global warming?
    0 0
  35. (-Snip-)
    0 0
    Response:

    [DB] Good advice from the elder generations: 

    "If you having nothing nice to say, say nothing."

  36. John Nielsen-Gammon has an interesting comment up on RC11 Paul
    0 0
  37. Rob Painting, I am not sure if you have seen this draft. Dr. Martin Hoerling of NOAA is working on a draft paper concerning the 2010 Moscow heat wave. Dr. Hoerling's Draft paper on the Moscow 2010 heat wave. He is not as convinced that the Moscow heat wave was caused by GHG's. In his draft he asks this question: "3. What role did GHG warming play in the 2010 Russian heat wave?" The conclusion he has formed at this time: "3. Figure 5 indicates that the 2010 observed heat wave magnitude is greatly different from that expected by GHG forcing alone (compare black and blue curves). While recognizing the presence of a moderate amplitude GHG signal, the majority of the event's magnitude was very likely due to internal variability."
    0 0
  38. Norman: He has left a large amount of wiggle room. Despite a strengthened GHG warming signal, the intrinsic variability of observed western Russia temperature during July is too large to permit detection of a change in temperatures, with high confidence, at this time. That sounds like the evidence isn't statistically significant, which can be translated to 'there's no evidence that it isn't GHG warming.' R and C (here) and the Hansen paper present evidence that we can indeed be seeing an effect of GHG. If you choose to read Hoerling as an absolute, please say so. That way we won't start going in circles on this again.
    0 0
  39. Paul Middents @ 36 - I don't find John Nielsen-Gammon's blog post particularly enlightening. He trying to apply Rahmstorf and Coumou (2011)'s work to something it is clearly not intended to do. Using the dice analogy, Rahmstorf & Coumou's analysis can only tell you the probability the weather dice will roll a six, it cannot tell you which throw will result in a six, that's where detection & attribution studies (looking at physical changes) come into the picture.
    0 0
  40. Norman @ 37 - yup, I'm aware of the draft. Rather than focus solely on the issues raised by Rahmstorf and Coumou, I'd also like to see them (Dole [2011]) cast their net much wider in terms of detection & attribution. They were heavily criticized by Kevin Trenberth here. Be nice if they addressed these.
    0 0
  41. muoncounter @38 I would not choose to read much as "absolute" especially in a very complex system that has many expert opinions. There is an individual Christopher C Burt that has done what I had hoped. Compiled data (for US) on extreme weather and wrote a book about it titled "Extreme Weather a Guide and Record Book" Here is a link that provides an introduction to this book with his conclusions based upon his actual researched data. Introduction to Christopher C. Burt's Weather book. They give a good sample of his book in this link, he does conclude Global Warming will increase heat waves. His evidence suggests that Global Warming will cause some increases in extreme weather in some areas but not in others. I thought you might like this.
    0 0
  42. Norman #37, can I refer you back to Albatross' inline graphic at 5 (the maps from Hansen et al 2011), when you are trying to tie individual events to GHGs. Albatross was responding to your #4 where you said "... evidence does not show or prove the conclusion that frequencies of heat waves will increase." Hansen's figure provides exactly that evidence, showing how the frequency and intensity of heatwaves is increasing across the world. Each year, you don't know where the big heatwaves will hit, but the percentage of the land surface being hit by heatwaves is increasing, and so it becomes progressively more likely that you'll end up under one. Moscow did in 2010, Texas this year. There were 3-sigma events in 1955 and 1975 (not 1965), but only a very few in a very few locations. The graphical analysis shown by Daniel in his inline comment at #13 shows how the frequencies and intensities are shifting. Now they cover appreciable fractions of the Earth's surface. Do you accept global warming drives that? If so, you must accept that more and worse heatweves are a consequence of our global warming, including these particular events. Each event might have happened in the 1950s or earlier, but it is extremely unlikely that they would have done.
    0 0
  43. Rob Painting @40 In your above article you have a bullet: "By seperating out the random (weather) component and the long-term (warming) component, the authors established there is a 80% probability that the 2010 July temperature record in Moscow would not have happened without climate warming from 1880-2009." From your Climate Progress link in post 40: "The Russian heat wave was, according to NOAA, roughly 5°C ( 9°F) above average for July." Here you have the US 1936 Heat Wave (extent and temp anomaly). This one was hotter than the Moscow Heat Wave where a significant area was above 10 F and then some area that was 12 F above. (Note: I do not know about the area covered by the Moscow Heat wave vs the US 1936 heat wave, I only know it was hotter). source. So in 1936 you have a worse heat wave than Moscow 2010 heat wave (hotter temps) but the temp anomaly for 1936 was less than zero. source. source. The point of this post is to determine how they came up with the 80% probabliltiy that the Moscow heat wave would not have happened without Global Warming even though a worse heat wave took place without Global Warming as the cause.
    0 0
    Response:

    [DB] Fixed broken image.

  44. Err, is the post at 43 meant to be serious? The author is conflating a number of issues and comparing apples to oranges. To mention a couple of other issues. I really have no idea where to begin. If it is serious effort, it is a striking example of just how far "skeptics" will go to delude themselves. Shocking.
    0 0
  45. Norman#43: "even though a worse heat wave took place without Global Warming as the cause." This is the same circular track you took us on in prior extreme weather threads. That there was a heat wave in history worse than 2010 (if that is in fact true) is irrelevant. Low probability events happen - that's why we use the 'rolling dice' metaphor. The point here is that in a warming world, we expect these events more frequently; perhaps even becoming the 'new normal' and even worse events to become the extreme. That is what the graphs posted here and here are saying. That is what the map posted here is saying: an observable increase in the occurrences of what were low probability events. If you accept the Hansen paper's data as accurate - and you've posted a GISS graph, so I have to assume you do - then how can there not be an increased probability of heat waves?
    0 0
  46. Norman @43: 1) Checking the gisstemp maps for July 1936 and July 2010, it is very clear that: a) The Russian heat wave of July 2010 covered a far larger area than did the US heatwave of July 1936; b) The Russian heat wave of July 2010 was hotter than the US heatwave of July 1936. As there is a discrepancy between the GISS and the map you provide on this point, it should be noted that it is not clear that your map represents July Averages rather than July Maximums. Note that the Moscow maximum was also about 12 degrees F above the mean, and other parts of Russia where hotter, relatively. Further, the GISS maps have a 1200 smoothing radius, so the higher Russian temperatures may be a product of their greater extent. Reducing the smoothing radius to 250 km (which should avoid that problem) increases the US July average peak to 6.6 degrees C (12 degrees F) but the Russian to 7.5 degrees C (13.5 degees F), which significantly reduces the disagreement between the two maps, but still shows the Russian heatwave as both hotter and more extensive. c) In 1936, it is evident that Russia also had a heatwave in July, of about the same intensity, but slightly smaller area than that in the US. As such an equivalent heatwave to the US heatwave of 1936 appears on as the third warmest record in the second graph of your post 4 above, where it comes nowhere near matching the 2010 event. Given the above, it is far from clear that the 1936 US heat wave was as hot as the 2010 Russian heatwave, let alone hotter. It was certainly not as extensive, nor as long lasting (as checking June data will show). Therefore the factual basis of your post is in doubt. 2) Absolute differences in temperature anomaly are not an appropriate metric for comparing heat waves. That is because different latitudes, different seasons and different have different levels of variability in temperatures. In general tropical temperatures are less variable than mid latitude or polar temperatures, while summer temperatures are less variable than winter temperatures. There are, however, significant regional differences in variability relating to geographical factors. A location bordered by hot dessert in one direction and an ocean with a cool current in the other will vary temperature greatly depending on the direction of the wind. Because of this variability, the correct measure of comparison is the variation in Standard Deviations for the regions of interest. That means if Dakota July temperatures are more variable than typical Moscow July temperatures, an equal absolute difference in temperature anomaly requires more explanation in Moscow than in the Dakota's (and vice versa). Further, larger areas (and greater durations) result in less variability (due to averaging effects). That means all else being equal we would expect the Russian heat wave of 2010, with its greater extent and duration, to be more Standard Deviations from the mean than was the US heatwave. However, though I suspect the Russian heatwave of 2010 to have exhibited a greater departure from the mean in Standard Deviations, you have not quoted the relevant statistic for the US heatwave of 1936, so I cannot categorically say, one way or the other. But equally, neither can you. Ergo you have no conceptual basis for your argument. 3 It is false to say, as you do, Global Warming was not the (more properly "a") cause of the 1936 heat wave. Global warming was present in 1936, and contributed to the increase in global temperatures relative to the start of the century. We know that because CO2 did not go from not being a forcing agent in 1947, to being one in 1975. It was a forcing agent in 1936, albeit dominated by natural forcings. Therefore it contributed to the temperature rise at that time. It follows that global warming contributed to every temperature event in 1936 (as also in 2010). It astonishes me that people keep on saying that a buttefly's flight in Japan could cause a storm in New York city as an example of the chaos of the climate system, but keep on reasoning as though a global forcing of 1.8 W/m^2 forcing due to CO2 (as of 2011) could have no effect. So the question is not whether global warming contributed to either heat wave. It did, to both, although more to the 2010 event. The question is only the statistical question of how much more likely a given event is given global warming. That has not been calculated for the 1936 event. If it were it would be likely to surprise a number of people. A significant contributing factor to the sharp rise in global temperatures between 1910 and 1940 was the reduction in sulfate emissions due to the great depression. Sulfate forcing tends to be regional in effect, and the epicenter of the great depression was the US. Hence the change in forcings due to anthropogenic factors in the US immediately following 1927 would have been disproportionately large. The contribution of CO2 forcing plus reduced anthropogenic aerosol forcing to the 1936 heatwave is very unlikely to have increased the probability of the extremes reached by 80%. However, it would be no surprise if the contribution was in double digits. How much it was, or wasn't, however, is pure speculation until a study is actually done. That means it would be wrong of me to claim the extremes were only reached because of global warming, but equally wrong of you, as you do, to claim that global warming was not a significant factor. 4 Finally, while it is undoubtedly true that global warming contributed to the 2010 Russian heatwave, nobody can say that such a heatwave could not have been reached by natural variability alone. There is no scientific evidence to suggest it is a roll of '13' on two dice, to use the popular analogy. What can reasonably be asserted is that there is an 80% chance that it would not have happened without global warming. That means there is a 20% chance it would have happened without global warming. So even if the 1936 US heatwave were all you say it is, that would only show that that 20% sometimes comes up. That is neither a challenge to the claim that there is an 80% chance that the Russian heatwave would have been a relatively mild event without global warming; nor a challenge to the claim that extreme events increase with global warming. In statistical arguments, as this necessarily is, citing a single datum as the basis of an argument is always a non sequitur.
    0 0
  47. "The point of this post is to determine how they came up with the 80% probabliltiy that the Moscow heat wave would not have happened without Global Warming even though a worse heat wave took place without Global Warming as the cause." Norman, do you think that when there is a 20% probability of an event, that it can never happen? Because that is exactly what you are suggesting above. It is partially why the authors did not say that the Moscow heatwave was a 100% probability AGW event. Next time you roll a die, I assume you'll think that because there is an 83% chance of rolling a '2' to a '6', you could never have rolled a '1' before? Compare the 1955 maps with the 2010 maps in comment #5. I think you'll be able to work out from that if your 1936 heatwave was larger or smaller than an event that stretched more-or-less from the White Sea to the Red Sea, with a 3-sigma area near enough the size of the USA. Add to that your conflation of absolute temperature differences with the assessment of what is 'extreme' in any area, and you seem assertively confused. Different regions have different assessments of what is 'extreme'. In very cold regions, sustained anomalies measured in the tens of degrees Fahrenheit are possible in winter; conversely, on small islands, anomalies of five degrees Fahrenheit may be enough to be 2- or 3-sigma 'extreme'. Tom and muoncounter have already said all this much more eloquently...
    0 0
  48. muoncounter @45 "If you accept the Hansen paper's data as accurate - and you've posted a GISS graph, so I have to assume you do - then how can there not be an increased probability of heat waves?" I would agree that the average temperatures will be higher but the current amount of global warming would only increase the average a few degrees. That is because I do not feel that exterme heat waves are random fluctuations in the temperature field but are caused by patterns that develop. The NASA article I am linking to does suggest global warming may increase heat waves. That is because it is possible global warming of the oceans may produce more blocking events. In this way I can accept that global warming can lead to more heat waves. But the NASA article can easily explain the Hansen data posted in #5 by Albatross. Blocking patterns have been changing with time and are controlled by the ocean temperature. When researchers get a complete picture of what causes and maintains blocking patterns it will then explain if global warming will increase the probability of heat waves. If global warming causes blocking patterns to decrease then I would not believe the probability of heat waves would increase. Though I would believe the average daily temperature would increase. NASA article on blocking patterns.
    0 0
  49. This Science Daily item might explain a few things that perplex some of us about extreme weather events . Erratic, Extreme Day-To-Day Weather Puts Climate Change in New Light I hope someone will soon do a post here on this AMS Journal of Climate paper "Trends in daily solar radiation and precipitation coefficients of variation since 1984." from Medvigy & Beaulieu. I don't recall their names but this stuff looks interesting and relevant for those trying to get their head around the implications or causes of extreme weather effects. It will be interesting even if it only evokes a more detailed analysis from others disputing or elaborating on the results they have so far.
    0 0
  50. skywatcher @47 I ran a standard deviation of Bismark, North Dakota July 2011 data (should be fairly typical for that area it would seem as the average temp came very close to the long term average for this area). Using this standard deviation calculator found here. I entered data from here. into the standard deviation calcualtor. The results were: Mean: 84.26 F Standard Deviation: 6.07 The record high in July for Bismark is 114 F set in 1936. 114 F is sigma 5 (5 standard deviations away from the mean).
    0 0

1  2  3  Next

You need to be logged in to post a comment. Login via the left margin or if you're new, register here.


The Consensus Project Website

THE ESCALATOR

(free to republish)


© Copyright 2024 John Cook
Home | Translations | About Us | Privacy | Contact Us