Still Going Down the Up Escalator
Posted on 3 February 2012 by dana1981
The Escalator, originally created as a simple debunking to the myth "Global warming stopped in [insert date]", turned out to be a very popular graphic. Going Down the Up Escalator, Part 1 recently surpassed 20,000 pageviews, Part 2 has an additional 4,000+ views, and the graphic itself has been used countless times in other blogs and media articles. Due to its popularity, we have added a link to The Escalator in the right margin of the page, and it also has its own short URL, sks.to/escalator.
The popularity of the graphic is probably due to the fact that (1) it's a simple, stand-alone debunking of the "global warming stopped" myth, and (2) that particular myth has become so popular amongst climate denialists. As The Escalator clearly illustrates, it's easy to cherry pick convenient start and end points to obtain whatever short-term trend one desires, but the long-term human-caused global warming trend is quite clear underneath the short-term noise.
The original Escalator was based on the Berkeley Earth Surface Temperature (BEST) data, which incorporates more temperature station data than any other data set, but is limited to land-only data; additionally the record terminates in early 2010. We originally created the graphic in response to the specific myth that the BEST data showed that global warming had stopped.
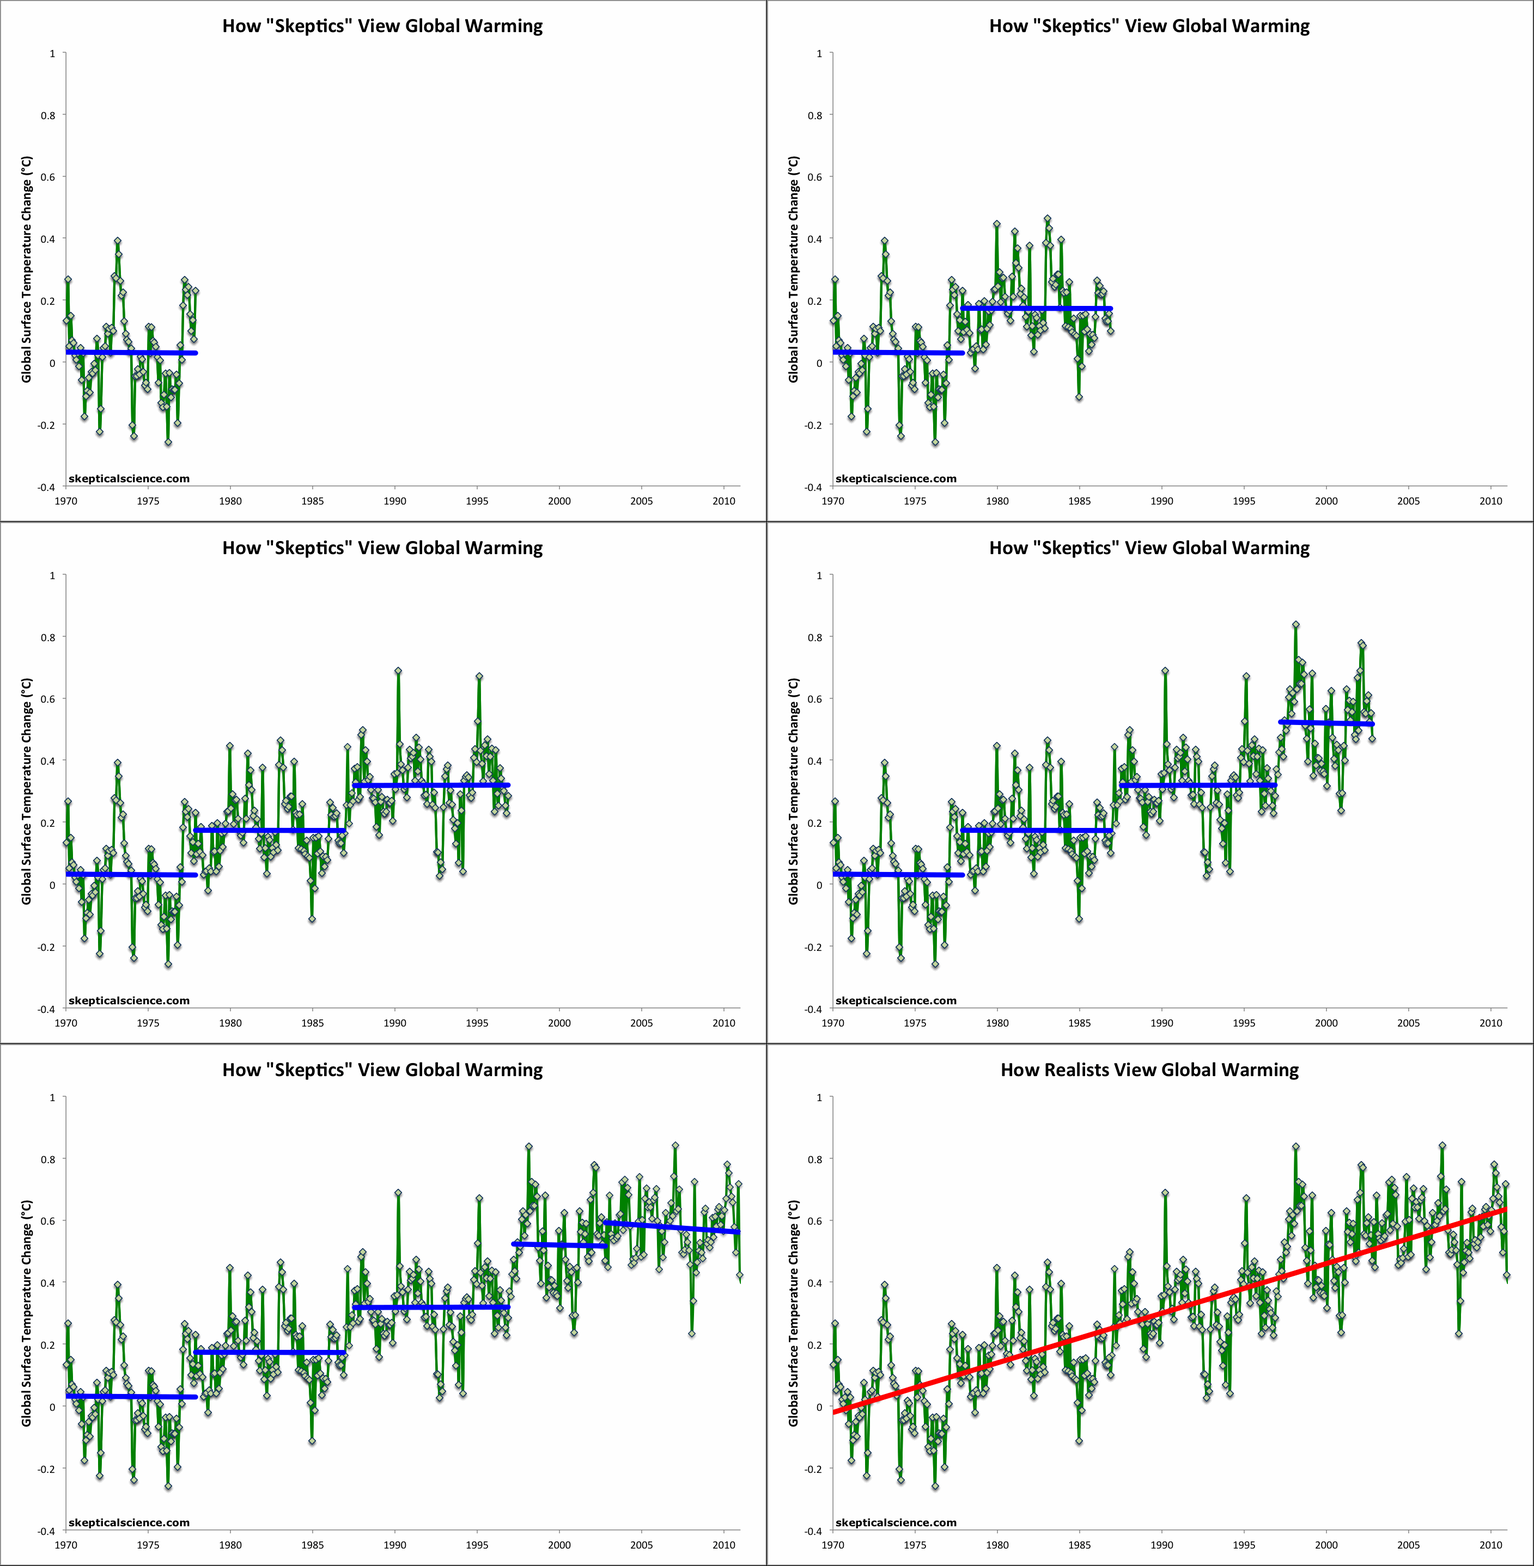
It is interesting to apply the same analysis to a current global (land-ocean) temperature record to determine whether short term trends in the global data can be equally misleading. A global version of the Escalator graphic has therefore been prepared using the NOAA NCDC global (land and ocean combined) data through December 2011 (Figure 1).
Figure 1: Short-term cooling trends from Jan '70 to Nov '77, Nov '77 to Nov '86, Sep '87 to Nov '96, Mar '97 to Oct '02, and Oct '02 to Dec '11 (blue) vs. the 42-year warming trend (Jan '70 to Dec '11; red) using NOAA NCDC land-ocean data.
The Predictable Attacks
On 31 January 2012, John Cook emailed me about several recent uses of The Escalator, including an inquiry from Andrew Dessler, requesting to use it in one of his lectures. In the email, John suggested that the graphic had gained so much popularity, it would likely soon be the target of attacks from fake skeptics.
As if eavesdropping on our conversation, the first such attack on the escalator came the very next day, on 01 February 2012. The graphic had been publshed nearly 3 months earlier, and John predicted the fake skeptic response within a day's margin.
The Escalator was recently used by a number of sources in response to the denialist plea for climate inaction published in the Wall Street Journal, including Media Matters, Climate Crocks, Huffington Post, and Phil Plait at Discover Magazine's Bad Astronomy. Statistician William Briggs took issue with Phil Plait's use of the graphic. Specifically, he criticized the lack of error bars on the data used in The Escalator, making some rather wild claims about the uncertainty in the data.
"...the models that gave these dots tried to predict what the global temperature was. When we do see error bars, researchers often make the mistake of showing us the uncertainty of the model parameters, about which we do not care, we cannot see, and are not verifiable. Since the models were supposed to predict temperature, show us the error of the predictions.
I’ve done this (on different but similar data) and I find that the parameter uncertainty is plus or minus a tenth of degree or less. But the prediction uncertainty is (in data like this) anywhere from 0.1 to 0.5 degrees, plus or minus."
As tamino has pointed out, calculating an area-weighted average global temperature can hardly be considered a "prediction" and as he and Greg Laden both pointed out, BEST has provided the uncertainty range for their data, and it is quite small (see it graphically here and here). Plait has also responded to Briggs here.
The Escalating Global Warming Trend
Briggs takes his uncertainty inflation to the extreme, claiming that we can't even be certain the planet has warmed over the past 70 years.
"I don’t know what the prediction uncertainty is for Plait’s picture. Neither does he. I’d be willing to bet it’s large enough so that we can’t tell with certainty greater than 90% whether temperatures in the 1940s were cooler than in the 2000s."
It's difficult to ascertain what Briggs is talking about here. We're not using the current trend to predict (hindcast) the global temperature in 1940. We have temperature station measurements in 1940 to estimate the 1940 temperature, and data since then to estimate the warming trend. Once again, we're producing estimates, not predictions here.
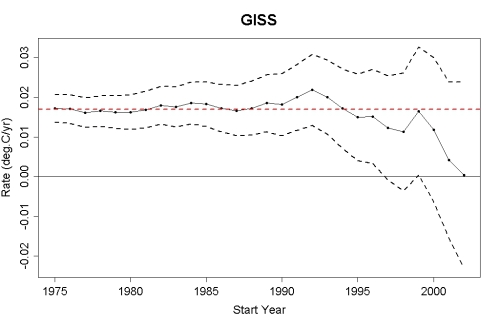
Moreover, the further back in time we go and the more data we use, the smaller the uncertainty in the trend. For example, see this post by tamino, which shows that the global warming trend since 1975 is roughly 0.17 +/- 0.04°C per decade in data from NASA GISS (Figure 2). The shorter the timeframe, the larger the uncertainty in the trend. This is why it's unwise to focus on short timeframes, as the fake skeptics do in their "global warming stopped in [date]" assertions. As tamino's post linked above shows, when we limit ourselves to a decade's worth of data, the uncertainty in the trend grows to nearly +/- 0.2°C per decade (Figure 2).
Figure 2: The estimated global temperature trends through July 2011 (black dots-and-lines), upper and lower limits of the 95% confidence interval (black dashed lines), and the estimated trend since 1975 (red dashed line) using GISS land and ocean temperature data (created by tamino)
Foster and Rahmstorf (2011) also showed that when the influences of solar and volcanic activity and the El Niño Southern Oscillation are removed from the temperature data, the warming trend in the NCDC data shown in the updated Escalator is 0.175 +/- 0.012°C per decade. Quite simply, contrary to Briggs' claims, the warming trend is much larger than the uncertainty in the data. In fact, when applying the Foster and Rahmstorf methodology, the global warming trend in each of the major data sets is statistically significant since 2000, let alone 1940.
Ultimately Briggs completely misses the point of The Escalator.
"...just as the WSJ‘s scientists claim, we can’t say with any certainty that the temperatures have been increasing this past decade."
This is a strawman argument. The claim was not that we can say with certainty that surface temperatures have increased over the past decade (although global heat content has). The point is that focusing on temperatures over the past decade (as the fake skeptics constantly do) is pointless to begin with, and that we should be examining longer, statistically significant trends.
Briggs' post was of course hailed by the usual climate denial enablers (i.e. here and here), despite the rather obvious inflation of the data uncertainty, and utter lack of support for that inflation. Despite the fake skeptic struggles to go the wrong way down, The Escalator unfortunately continues ever-upward.


 Arguments


[dana1981] I don't think your assertion is true. Even cherrypicking the peak of the 1997-1998 El Niño, the trend through December 2011 is positive.
To conclude that global warming has not lived up to modeled expectations, we would first have to see evidence supporting that conclusion. Thus far there is no such evidence. The rate of warming is consistent with model projections.