Climate Science Glossary

Term Lookup

Enter a term in the search box to find its definition.

Settings

Use the controls in the far right panel to increase or decrease the number of terms automatically displayed (or to completely turn that feature off).

Term Lookup

Settings


All IPCC definitions taken from Climate Change 2007: The Physical Science Basis. Working Group I Contribution to the Fourth Assessment Report of the Intergovernmental Panel on Climate Change, Annex I, Glossary, pp. 941-954. Cambridge University Press.

Home Arguments Software Resources Comments The Consensus Project Translations About Support

Bluesky Facebook LinkedIn Mastodon MeWe

Twitter YouTube RSS Posts RSS Comments Email Subscribe


Climate's changed before
It's the sun
It's not bad
There is no consensus
It's cooling
Models are unreliable
Temp record is unreliable
Animals and plants can adapt
It hasn't warmed since 1998
Antarctica is gaining ice
View All Arguments...


Username
Password
New? Register here
Forgot your password?

Latest Posts

Archives

Does record snowfall disprove global warming?

Posted on 7 March 2010 by John Cook

The 2009/2010 winter saw a number of dramatic, record breaking snowstorms. Early February saw two "once in a 100 years" snowstorms hit Philadelphia, now being dubbed "Snowmageddon". Does record snowfall prove that global warming isn't happening? What do observations say? 2009 was the second hottest year on record. January 2010 was the hottest January in the UAH satellite record. Satellites data indicates last month was the second hottest February in the satellite record. Observations tell us that rumours of global warming's death have been greatly exaggerated. 
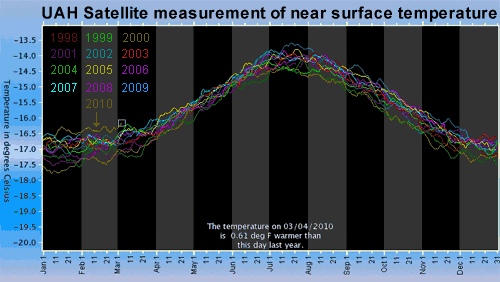
UAH Satellite temperature of near surface layer
Figure 1: UAH satellite measurement of near surface temperature. January 2010 is the hottest January in the satellite record. February 2010 is the second hottest February in the satellite record. Click on the image for larger version.

If global warming is still happening, why are some areas experiencing record snowfall events? As climate warms, evaporation from the ocean increases. This results in more water vapour in the air. Globally, atmospheric water vapour has increased by about 5% over the 20th century. Most of the increase has occurred since 1970 (IPCC AR4 3.4.2.1). This is confirmed by satellites that find the total atmospheric moisture content has been increasing since measurements began in 1988 (Santer 2007).
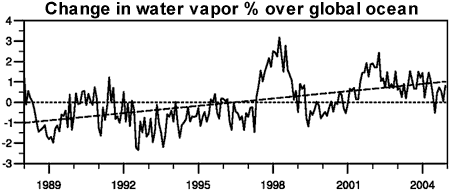
Change in water vapor % over global ocean
Figure 2: Change in water vapor percentage relative to the 1988 to 2004 period over the global ocean plus linear trend, measured by satellite (
IPCC AR4 3.4.2.1).

The extra moisture in the air is expected to produce more precipitation, including more extreme precipitation events. Observations bear this out. A study of precipitation trends over the United States found that heavy precipitation events (over 50mm in a day) have increased 20% over the 20th Century (Groisman 2004). Most of this increase occured after 1970. Various  analyses of precipitation over the globe have similarly found a widespread increase in heavy precipitation days since 1950 (Alexander 2006, Groisman 2006).
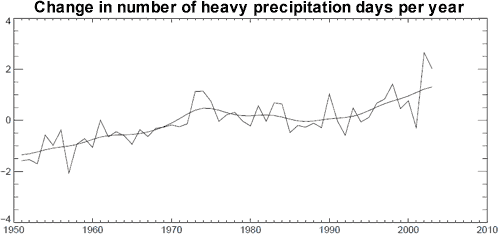

Figure 3: Global number of days per year when precipitation was greater than 10mm per day, expressed as an anomaly from the 1961 tp 1990 reference period (Alexander 2006).

Snowstorms can occur if temperatures are in the range of -10°C to 0°C. Global warming decreases the likeliness of snowstorm conditions in warmer, southern regions. However, in northern, colder regions, temperatures are often too cold for very heavy snow so warming can bring more favourable snowstorm conditions (Kunkel 2008). This is borne out in observations. Over the last century, there has been a downward trend in snowstorms across the lower Midwest, South and West Coast. Conversely, there's been an increase in snowstorms in the upper Midwest East, and Northeast with the overall national trend also upwards (Changnon 2006).

To claim that record snowfall is inconsistent with a warming world betrays a lack of understanding of the link between global warming and extreme precipitation. Global temperatures in the last few months of record snowfall are some of the hottest on record. Warming causes more moisture in the air which leads to more extreme precipitation events. This includes more heavy snowstorms in regions where snowfall conditions are favourable. Far from contradicting global warming, record snowfall is predicted by climate models and consistent with our expectation of more extreme precipitation events.

UPDATE 8 Mar 2010: Based on some of the comments below, a few clarifying points are in order. Global warming cannot be said to cause a specific snowstorm or any extreme weather event for that matter. An appropriate metaphor to explain the difference between weather and climate is the rolling of a die. An extreme precipitation event is like rolling a six. The result is based on random, chaotic processes. However, if you weight the die, this increases the chances of rolling a six. Similarly, global warming increases the chances of extreme precipitation events.

Global warming does not lead to increased snowstorms everywhere. They only increase in colder regions where the temperature still remains below freezing despite warming trends. Snowstorms are currently decreasing in warmer areas. Overall, the total amount of snow cover has shown a long-term decreasing trend.

So to summate, record snowfall neither proves nor disproves global warming. However, the increasing trend in extreme precipitation events is consistent with global warming. And this will lead to increased snowstorms in certain, colder regions.

0 0

Printable Version  |  Link to this page

Comments

Prev  1  2  

Comments 51 to 83 out of 83:

  1. #49 CBDunkerson at 04:05 AM on 9 March, 2010 "your graph seems entirely consistent with CO2 driven AGW" No, it is not. You should observe the phase relationship. If outgoing longwave radiation is blocked indeed to some extent as the CO2 AGW story puts it, then radiative cooling to space is delayed relative to solar forcing. However, what we actually observe is not a delay. Just the opposite. Most of NH snow cover shrinkage occurs before summer solstice. Also, NH snow cover growth starts a week or so earlier relative to winter solstice than it would be expected based on insolation alone. "there is NO way that increasing soot could result in HIGHER snow coverage at any point of the year" Overall albedo still decreases due to less snow in sunny seasons, so some warming is expected. If any of it goes to increase SST (Sea Surface Temperature), more moisture is available to produce snow in the winter. Also, very small amount of soot is needed to decrease snow albedo (several ppb). It would explain why warming began much earlier (mid 19th century) than carbon dioxide levels started to rise. Folks actually enjoyed smoke in those days. Or at least tolerated it better than we do. Watch what Union Pacific 3985 can do. It gets really nasty from 0:41.
    0 0
  2. Berényi Péter at 05:07 AM on 9 March 2010 That graph seems quite hopeless as a demonstration of increasing snow cover based on area covered by anomaly above versus below the norm. Discussion over distribution of energy versus time or whatever, the picture seems an open and shut case that snow cover is diminishing. Am I missing something?
    0 0
  3. Berényi Péter at 05:07 AM on 9 March, 2010 One quick question... all this soot, from burning what exactly? Difficult to separate soot production from CO2 production, maybe?
    0 0
  4. Berenyi, temperature and insolation are not as tightly wedded as you claim. Temperatures can drop low enough for snowfall well before the Winter solstice in many parts of the NH. Further, January temperatures in many areas are actually COLDER than December despite being further from the solstice (ditto July temps being warmer than June). Also, snow coverage does not follow a simple curve of decreasing temperature to increasing snow coverage... past a certain point low temperatures can actually reduce snow accumulation. Thus, you cannot say that a 'delay in winter cooling' MUST cause the peak of increased snow coverage to come after the Winter solstice. The minimum insolation does not equate to the minimum temperature which does not equate to the minimum snowfall. And again, if soot accumulation is the primary cause why does the peak loss anomaly take place prior to the Summer solstice? Wouldn't the soot continue to accumulate? Wouldn't insolation two weeks after the solstice be just as strong as insolation two weeks prior... but striking sootier snow and thus causing MORE loss? Your argument has no foundation.
    0 0
  5. #52 doug_bostrom at 05:13 AM on 9 March, 2010 "snow cover is diminishing" NH snow cover is diminishing between week 5 (end of January) and week 40 (mid October), increasing otherwise. In last week of the year (late December) NH snow cover is increasing on a 60,000 km2/year rate during the last four decades. I was not clear enough perhaps. I have calculated trends for each week of the year (with a correction for the calendar effect). On the figure you can see this trend for each week of the year. In fact these "weeks" are a bit (34'24.46") longer, making 52 of them fit into the average Gregorian year. Since winter solstice is roughly week 51, snow cover increase starts some 10 weeks earlier and ends five weeks later. As you can see, there is a negative delay of 2-3 weeks. Also, summer solstice is about week 25, but maximum multidecadal decrease rate occurs on week 23-24. The overall trend is downward, since late fall/early winter upward snow cover trend is only 16 weeks long, 30% of the entire year. It is also the darkest part of it, so short wave surface absorptivity multiplied by insolation and integrated for a full year goes up considerably. #53 Peter Hogarth at 05:47 AM on 9 March, 2010 "all this soot, from burning what exactly?" I have told you. In early part of industrial revolution it was steam engines and coal (or wood) burning stoves. Now it's mainly diesel engine exhaust, tire wear, biomass burning and unfiltered smoke from coal fired power plants. The soot particles in question are rather small, average diameter 50 nm. They stay in air until precipitation brings them down (quite effectively). "Difficult to separate soot production from CO2 production" No, it is not. There is soot filter for both diesel engines and power plants. Just a matter of regulations. As opposed to carbon dioxide sequestration, it is not prohibitively expensive nor unattainable. Biofuels are forgettable, forests should be maintained (dead wood removed), tire materials redesigned. The best part of it is that there is almost nothing in the "pipeline". As soon as soot production starts to decrease, particles get washed down and we are left with clean air and white snow. Also, filtering smoke has immediate local benefits, no large scale joint operation is needed (UNO & IPCC can be left out for good).
    0 0
  6. #47 Berenyi Peter: "... does disprove carbon dioxide generated warming." It seems like I have heard that claim before, and it was wrong the other times, too. First, the overall area under the curve is negative (more on the negative side), so it is hard to see how an overall negative trend in snow cover is a smoking gun against warming. SNOW COVER is not SNOW VOLUME, it is area covered by snow. It may or may not tell you anything about snow volume. Over the northern part of North America, a quite large fraction of the continental area*, temperatures are below freezing for a lot of or most to all of the winter (depending on where you are, where I live it is for about 6 months), and the loss of snow cover in spring depends on when the last of the snow melts. What you observe is a negative trend in snow cover during the spring and summer -- that is, the last snow is disappearing EARLIER in the season now compared to previous years. That sounds like exactly what you would expect from warming. It may be that more snow cover is present in winter compared to earlier years, but temperature only controls snow cover when the temperature is close to 0C/32F, so I have to say, "so what?" *-Canada plus Alaska is a lot bigger than the lower 48 US states, and snow cover is very minor in the southern part of the US and in Mexico, so a majority of the area that sometimes has snow cover is located in the north. This is going to dominate the variation in snow cover.
    0 0
  7. Berényi Péter, 50 nm particles are not filtered out from automotive diesel exhaust and i'd not say that it's so easy ("just matter of regulations") even for cars, let alone power plants. You only have chemical abatement of NOx. Indeed, Euro IV engines are still a problem due to nanoparticle (smaller than about 1 micron) emissions which are still high.
    0 0
  8. #56 Jeff Freymueller at 08:39 AM on 9 March, 2010 "it is hard to see how an overall negative trend in snow cover is a smoking gun" I talk about neither snow extent nor snow volume, not even temperature. I am talking about trends in different parts of the year. Late October is usually much warmer in Northern Hemisphere than February. Also, there is more snow in February than in November. But as time goes by we are getting more and more snow in November, less and less in February. Why is it so? There is more heat in the environment to be trapped when it is warmer. Still, late October snow is getting more frequent while in early march it's diminishing. Snow extent decline from winter to summer solstice is much more pronounced than in the other half of the year, although this part is colder (due to temperature lag caused by ocean heat storage). From end of January to veneral equinox there are seven weeks, from autumnal equinox to mid October there are only three. Late February is colder than mid October, but has the same insolation. Still, the trends are reversed. The only conceivable difference is the state of snow. Old snow has larger crystals, the same amount of soot (inside them) causes more short wave absorption. How can the CO2 thing explain the fact that we are getting ever more snow in late fall and less in late winter? I am listening.
    0 0
  9. #57 Riccardo at 09:33 AM on 9 March, 2010 "50 nm particles are not filtered out from automotive diesel exhaust" This is not strictly true. A smaller percentage of 50nm particles are filtered than larger particles, but some are. In other words, the filtration efficiency is size dependent. This is one reason that future regulations will have a number-based component. Off topic, but personally, I wonder if diesel engines can really be viable in the future with all the emissions regulations they will need meet, including HC, CO, NOx, and particle number. NOx is particularly difficult in lean-burn engines. Proposals exist for systems with three separate components in the exhaust as well as a tank of urea and a urea injector. The exhaust system in a stoichiometric engine (most gasoline engines) is much simpler and the efficiencies can be quite high when hybridized like the Prius.
    0 0
  10. Diesel engine for cars may be obsolete. On the other hand large diesel engines may have some merit. Due to scale more filtering can be installed cost effectively. As for nanoparticles. A low temperature stage does miracles by coagulation.
    0 0
  11. Berényi Péter at 10:10 AM on 9 March, 2010 How can the CO2 thing explain the fact that we are getting ever more snow in late fall and less in late winter? I am listening. For my part I tried to understand how increasing atmospheric C02 could explain why my daily newspaper is sometimes delivered into a puddle at my doorstep but I eventually concluded there was no relationship. But with a little more serious intent, perhaps this is similar to the so-called "lake effect" snows in the area downwind of the Great Lakes, on a grander scale involving the ocean? Early winter sees high surface temperatures on the lakes, which gush evaporating moisture into passing cold fronts leading to heavy snow downwind of the lakes. I suppose the same thing could happen as oceans warm up, even if slightly?
    0 0
  12. pdt, absolutely correct. I should have said "are not filtered out efficiently" Berényi Péter, "A low temperature stage does miracles by coagulation." still waiting for this miracle and the other one you promised several times of disproving AGW.
    0 0
  13. I agree with Doug less sea ice in the arctic provides a better moisture for early season snowpack which is after all arrayed around the Arctic Ocean. Snowcover extent is more sensitive to temperature during the melt season, March-August, this is when the extents are so negative. Moreover given that we have had no decline in snowcover extent in the winter, the only way to have large snow cover declines during the melt season is for greater melting due to higher temperatures.
    0 0
  14. Berényi Péter at 08:33 AM on 9 March, 2010 I think you may have misinterpreted my point, or I wasn't clear (which is likely in an off the cuff remark) As you're aware, if you have soot, you have CO2. Historically and recently they are linked, both a result of burning Carbon based fuel, early 19th century wood and then transition to coal mid 19th century (at least in US) if I remember rightly. This was my point in "difficult to separate soot production from CO2 production" - I didn't mean difficult to filter... I'm aware that the ratio of CO2/soot has got better (?) in recent years due to higher efficincy burning, fuel change, and filtering, but it is just that we are burning a lot more than previously...much more CO2, more gas burning, relatively less particulates in recent decade? I take it you are using the timing of the snow falling/laying/melting as counter evidence of CO2 warming, and promotion of soot to prime suspect? Does this explain warming of the oceans as well? Check: http://www.nature.com/ngeo/journal/v1/n4/full/ngeo156.html. Which states "It is important to emphasize that BC (Black Carbon) reduction can only help delay and not prevent unprecedented climate changes due to CO2 emissions." There is a free version, but you'll have to wait a while for me to track it (and a few more) down.
    0 0
  15. #58 Berényi Péter. Your explanation is not clear. I'm not sure whether you are distinguishing between snow fall and snow cover -- they are not the same thing. In the meantime, maybe you can clearly explain why the last snow melting earlier in the spring is evidence against overall warming. Bringing up insolation is a red herring, because temperature is not directly related to insolation (I mean in terms of variation of both through the year in the same place). If it was, the hottest time of year would be in late June, and the coldest in late December. However, in many places the hottest/coldest days are shifted relative to the longest/shortest days. You appear to be assuming that more cold = more snow. You get snowfall when warm, moist air gets chilled, right? Very cold air can hold only a little water vapor, so cold air by itself is not enough to make snow. In many places it has to warm up to snow (read the mountain skier's post early on if you want another opinion). Even the assumption that more cold = more likelihood of snow may be correct only when the temperature is close to 0C, and a small temperature change means the difference between snow and rain. However, that just isn't true for non-coastal areas north of something like 50 N. In those places it is colder than 0C all or almost all of the winter. A bit of warming there will make little or no difference on snow cover for most of the winter. If you look at a map, there is a lot of NH land that falls into this category. So the bottom line is that I just can't see how even the increasing snow cover trend in some parts of the years is automatically related to temperature changes at all. The snow cover at that time is more dependent on when snow falls and sticks. But the melting phase in the spring/summer has a much simpler relationship to temperature, and that part of the year follows exactly what you expect from warming. And beyond all that, how you make the leap from this to disproving CO2-driven warming is just beyond me.
    0 0
  16. Sorry, title of article is: "Global and regional climate changes due to black carbon" Ramanathan 2008
    0 0
  17. Berényi Péter, I’m still trying to understand your (very interesting) point. Would it be fair to describe it thus: That any significant change in surface warming (and hence snow melt) due to increasing CO2 will have an asymmetric melting-effect about the winter solstice (when examined at temporally “symmetrical” points in the insolation calendar) due to the effects of CO2 being at the red-end of the spectrum (and so greater at warmer points of the winter)? And that this is, in fact, the opposite of what is being observed? I’m not familiar with any of the numbers involved, but how much of the snowmelt is due to the proximal-cause of local insolation, as opposed to the advection of heat from warmer locations (it also presumably having a latitude component)? I’m still digesting the points about soot particles. Do their effects (if significant) on snowmelt show a pronounced temperature- or spectral-bias ? (Yes, I know they may look black, but does that mean they can always be treated as black-body absorbers/radiators?)
    0 0
  18. libertarianromanticideal says: "and all nine predicted that North American winter snow cover would decline significantly, starting in about 1990." Your link clarifies a few things. First, it says that all 9 models predict a statistically significant downward trend, but only over the course of the entire 21st century, with no real change over the 20th century. It also refers to the northern hemisphere (not just North America). Over the 1990-2010 period, it doesn't project much change. Clearly variations in the Arctic Oscillation (such as the recent negative extremes) can create a lot of snow cover extent variation at the decadal level. You can see similar variation in models with the green line in your link. It's why longer periods need to be looked at when making evaluations: http://tamino.wordpress.com/2010/02/18/cherry-snow/ In other words, give it more time. Cherry-picking time periods is something politicians do. As far as a 10-year-old article that is popular among contrarian circles these days, snow does seem more rare and exciting. The recent generation isn't really used to it.
    0 0
  19. To illustrate the above point, as an example, compare February snow cover extent numbers with the Arctic Oscillation index (this applies to all winter months as well). http://climate.rutgers.edu/snowcover/files/moncov.nhland.txt http://www.cpc.noaa.gov/products/precip/CWlink/daily_ao_index/monthly.ao.index.b50.current.ascii.table There's a strong negative annual correlation between the two sets of numbers throughout the overlapping time series (snow cover extent goes back to 1967). Strong negative AO -> higher snow cover extent and vice versa. This isn't surprising, because a strong negative AO tends to push Arctic air much further south. With winter precipitation, this means higher snow cover extent over the northern hemisphere. Note the strong downward trend in the AO since 1989 - a time period some "skeptics" use as a starting point to "disprove" snow cover models.
    0 0
  20. Michael Trogdon (#36), for most people in the USA this has been a very cold winter with plenty of snowfall records being set. In Florida record cold temperatures going back to 1960 have been broken. My (very amateur) take on all this is that high sea surface temperatures may have something to do with high winter precipitation (snowfall records). The same high SSTs can lead to a hot and humid summer. Therefore I predict a hot summer but making predictions is a dangerous game so if 2010 turns out to be cooler than average in the USA you will be entitled to gloat and I will send you an excellent bottle of scotch of your choosing! If am right, how about sending me 750 ml of Glenfiddich? The supercomputers with their sophisticated models that include el Ninos, la Ninas, Pacific Decadal Oscillations etc. sound wonderful but will they outperform my wet finger? The British "Met Office" is notorious for its inability to forecast what kind of summer to expect. It is only fair to remind you that professional "experts" armed with all kinds of wonderful tools did a woeful job predicting US hurricane activity over the past two years.
    0 0
  21. 68.NewYorkJ at 13:14 PM on 9 March, 2010 There seems to be an inconsistency here. Models predict that a signal for heavier or more precipitation will be detectable later in the 21st century yet some groups have published that such a signal is already present in the historical 20th C data. This earlier Groisman paper seems to express that contradiction for extreme precipitation events. This seems to mimic that hurricane situation were models also predict that an increase in stronger hurricanes would only be detectable late 21st C (if at all). A debate raged over whether such a signal could be detected in the historical data, the IPCC aknowledged the possibility of such a signal, although now the consensus has changed to no detectable signal. Also I had high hopes that rainfall measurement would be more straighforward than temp. Unfortunately this paper scuppered that. Hanssen-Bauer and Førland - Journal of Climate, 1994
    0 0
  22. #65 Jeff Freymueller at 12:17 PM on 9 March, 2010 "Bringing up insolation is a red herring, because temperature is not directly related to insolation" And snow melt is not directly related to temperature. On Mount Kilimanjaro icecap is disappearing, although temperature there never gets above freezing. It is less moisture, more dirt on snow and the sun. It's just sublimating. There are regions where snow cover is clearly temperature limited and still other regions where the limiting factor is moisture. This winter we had more than usual snow cover in regions that are temperature limited (Western Europe, China, US East Coast) and less where it is moisture-limited (Middle East). Great Britain can be doomed for any number of reasons, but not for lack of precipitation during winter. If it is not cold enough for snow, it is raining. I would like to check regional trends for snow cover. Unfortunately the Rutgers snow lab does not provide data for such an analysis, although they must have it, otherwise could not construct the maps. #66 Peter Hogarth at 12:17 PM on 9 March, 2010 "Global and regional climate changes due to black carbon" Ramanathan 2008 Here it is. However, it has no quanitative data on soot snow albedo effect. Some backgound info can be handy. Anyway, we have learnt that global soot production is most indeterminate (up to a factor of five!). On the other hand, it is "responsible" for 30% of warming. Now, five timest thirty makes...
    0 0
  23. #72 Berényi Péter, I don't dispute that sublimation can be locally important. It's just that in the majority of the area that gets covered by snow in the winter, melting is the dominant effect, not sublimation at T < 0C.
    0 0
  24. #73 Jeff Freymueller at 03:04 AM on 10 March, 2010 "melting is the dominant effect" Of course it is. But melting is only driven by air temperature if there is a hot turbulent wind. Even then 260 m3 of air should be cooled down by 1°C to melt 1 kg 0°C snow. Not very effective. Also, it depends on how thick the snow is. If wind cannot blow through, surface area for heat exchange is severely limited. Actually it is worse than that. If wind blows through loose snow, air gets saturated by water vapor. At 0°C saturation absolute humidity of air is 4.84 × 10⁻³ kg m-3. If air in wind would be at 80% relative humidity, it means that on top of melting 1 kg snow, about 0.25 kg meltwater should be evaporated as well. As evaporation requires 6.76 times more heat than melting (per unit mass), the actual drop in air temperature is 2.7 times greater (or more air is needed). Otherwise, heat conduction of air being rather low, just a thin layer above snow cools down to 0°C and that's it. Melt interrupted. If sky is cloudless and air is dry, snow being a pretty good black body in IR, radiative cooling to space kicks in. Black body radiation at 0°C is 315 W m-2. Even with the narrow atmospheric window it can get quite large if air is dry. On the other hand if there is some soot in snow, albedo decreases to 80% (2 ppm soot is more than enough) and sun is shining faintly, let's say it gets 100 W m-1 irradiation, the 20 W m-1 absorbed is enough to melt 1 kg m-1 in less than five hours (provided radiative cooling is not taken into account). If snow is darker or sun is brighter, melt is accelerated proportionally. As melt is started, snow albedo decreases even with no soot whatsoever. And most of soot is not washed away by meltwater immediately, it tends to get enriched in upper layer (at 220 ppm soot albedo drops to 25%, rather dark). But, beyond doubt, the most effective agent is lukewarm rain.
    0 0
  25. Berényi Péter at 01:47 AM on 10 March, 2010 First, I’m no expert on Black Carbon! but I follow the debate. I think we have common ground based on recent evidence based research that it is a significant contributor to ice melt, and the estimate of “30% of global warming” is current, and factoring in Black Carbon is a relatively recent development. The large variability in estimates of levels of soot and the estimate of associated forcing effects has also been noted by some workers. The most recent measurement based effort resolves this to an extent and work continues. However to simply multiply 30% by a factor of 5 misrepresents all of this work, and I believe you are more thorough than that! You are correct that we need “background info”, and we also need appropriate context and detail. In posts like this it is difficult to get the balance between general interest and excruciating scientific detail correct. Everyone has different levels of weight of evidence at which the threshold of persuasion operates. To overload all at once can be off-putting! Anyway, wary of the danger of this diverting too far off post and overdoing “soot”, some recent free access papers, links and quotes on this: “Black soot and the survival of Tibetan glaciers” Xu 2009 http://www.pnas.org/content/early/2009/12/07/0910444106.full.pdf+html Variability and measurements: “BC concentrations of 10 ng g_1 significantly alter the albedo (reflectivity) of a thick snow layer. The visible albedo of deep fresh snow, about 0.9–0.97, is decreased by 0.01 0.04 by a BC amount of 10 ng g_1, thus increasing absorption (1 minus albedo) of visible radiation by 10–100%, depending on the size and shape of snow crystals and on whether the soot is incorporated within snow crystals or externally mixed”. “Black carbon aerosols and the third polar ice cap” Menon 2009 http://www.atmos-chem-phys-discuss.net/9/26593/2009/acpd-9-26593-2009.pdf “Springtime warming and reduced snow cover from carbonaceous Particles” Flanner 2009 http://www.atmos-chem-phys.net/9/2481/2009/acp-9-2481-2009.pdf “Emissions of black carbon (BC) and organic matter (OM) drive nearly as much reduction in Eurasian springtime snow cover as anthropogenic CO2 in equilibrium climate experiments initialized with pre-industrial conditions” In summary the climate models without aerosols underestimate warming and ice loss in Northern Europe. Higher levels of Black carbon in these areas (compared with North America) and accounting for this in the models helps resolve differences between models and measurements of warming. “In-situ measurements of the mixing state and optical properties of soot with implications for radiative forcing estimates” Moffet 2009 http://www.pnas.org/content/106/29/11872.full.pdf+html “In global models and inferences from atmospheric heating measurements, soot radiative forcing estimates currently differ by a factor of 6, ranging between 0.2–1.2 W/m2, making soot second only to CO2 in terms of global warming potential” “These atmospheric observations help explain the larger values for soot forcing measured by others and will be used to obtain closure in optical property measurements to reduce one of the largest remaining uncertainties in climate change”.
    0 0
  26. If it counts, you have my full support for regulating soot emissions. Unlike CO2 the stuff is not even good for your health. However, beyond that concern there is a serious scientific one as well. How reliable are climate models? If they are good at hincasting (reproducing the past) with no soot taken into account, they are surely flawed. If soot is responsible for 30% of recent warming, this percentage had to be even more during first half of 20th century. As all the past "anomaly" is attributed to GHGs by models and the fit is good, their effect is overestimated for sure. Using these ill-calibrated models for assessing recent soot contribution is an even more dangerous somersault of logic.
    0 0
  27. Note: I’m not a scientist but I wanted to state my observations. It would be easier to accept that heavy snows doesn't disprove “Global Warming” if it weren't for the fact that I constantly hear that lack of snow is because of “Global Warming”. Certainly the heavy snow should disprove the idea that a lack of snow is the result of Global Warming. Over the last century the global temperature increased by .6 degree Celsius. I find it hard to believe that .6 degree increase can cause the large climate changes that it has been accused of. It seems clear to me that it takes a larger change in the climate than the .6 degree measured. This much larger change can only have come from natural cycles in the climate that results in hot spots and cold spots changing places (such as the PDO). Some such cycles last as long as 60 years and produce large climate changes between isolated areas. Perhaps if we quit blaming everything we see on “Global Warming” then it might be easier to get people to believe us and we wouldn’t have to explain that large snow storms won’t disprove “Global Warming”.
    0 0
  28. Don, i'm sure that we all will not blame "everything we see on Global Warming". But record low temperature are becoming less frequent and record high more frequent. Record snow, instead, is a completely different process which does not match with record low temperatures. I also agree that it is hard to believe that "just" one degree or so may be responsibile of significant changes; but we all now that few degrees, maybe 5 °C, below current is called a glaciation. Really hard to believe, isn't it? Science way too often tells us stories hard to believe.
    0 0
  29. Don at 07:57 AM on 13 March, 2010 Don, further to Riccardo's points, it helps to remember that the little of bit of warming we've seen is not equally distributed about the planet, tends to be greater in the "upper" part of the Northern Hemisphere. Blaming everything on global warming is a mistake as you say; there should be some line of evidence pointing that way as well as a clear understanding that each circumstance represents a statistical data point.
    0 0
  30. I haven't put a lot of thought into this, but perhaps there should be some asymmetry in how we see record warm vs record cold days now. I don't take "record hot" days as proof of global warming (there's no need for that! the proof lies elsewhere). But I do take them as reminders or foretastes of what we're moving towards. In other words, the heat waves we experience this summer will be typical summer weather when my daughter is my age, or my parents' age. They're signs of what is to come. In contrast, I take cold weather as a reminder of what we're moving away from. Where I live there were fewer than normal cold days this winter. When I was a child, those days were more common. Half a century from now, what are now mild days will be considered cool, and the few "cold" days we still have will be even rarer. Snow is more complicated, as has been discussed repeatedly in this thread it's not linearly related to temperature.
    0 0
  31. I want to thank Riccardo and doug_bostrom for their helpful comments. I think the temperature records are an excellent proof that the climate is warming. I didn’t really want to imply that the climate is not warming because there is much evidence that it is. If you look at the NCDC data set (ftp://ftp.ncdc.noaa.gov/pub/data/anomalies/annual.land_ocean.90S.90N.df_1901-2000mean.dat) it shows a 30 year period of stationary temperatures, then a 30 year period of a rapidly rising temperatures followed by a repeat of that cycle. While temperature highs and lows are good proof that the temperature is increasing since it includes the last peek of that cycle, the better evidence is the NCDC data set. Yes I know that there are some questions about that dataset that has come up lately, however I have read the skeptics arguments and don’t believe there will be any major change. Also I might note that the location where the warming is occurring could just be part of the NAO and PDO cycle we are in. You may have to go back 60 years to make that comparison. My big concern is this: We may be in one of those 30 year periods where the temperature will change little, however sometime in the late 2020’s the temperature will start to climb again and climb fast. The issue of what is caused by “Global Warming” and what isn’t is a side issue. What’s important is the issue of what percentage is natural verses man-made. Climategate seems to be drawing the debate into unhelpful areas and people seem to be using it at proof that all the Global Warming is natural. This is most certainly wrong. Anyhow that is what spurred me to make that reply.
    0 0
  32. Just a question on the temperature chart. I don't understand how you have interpreted the chart. The shape of the chart suggests the measurements for near surface are being taken in the northern hemisphere only, while the sea surface chart (I went and played on the site) appears more likely to be for the entire globe. For the near surface chart (the one you have shown) you state that Feb is the second hottest Feb on the satellite record, when the chart you are using for your point fairly clearly shows it is the hottest, yet as mentioned appears to only be for the northern hemisphere. I am not trying to deny any of the statements you have made, I am not nearly knowledgeable in the science to do so, but your use of information to support your point does leave it open to some questions and interpretation. Could you advise where the satellite data showing Feb 2010 as the second hottest on satellite record is since it is not the chart you have shown in support of it? Thanks
    0 0
    Response: As far as I can tell, Figure 1 is global, not Northern Hemisphere. I gather the seasonal aspect favours Northern Hemisphere seasons because the NH features more land than the SH hence the temperature variation is greater there.

    Eyeballing Figure 1 shows February is clearly the hottest month on record. However, I've opted to quote Roy Spencer who claims February 2010 is the 2nd hottest year on record on his blog. I figure his data analysis is more rigorous than my eyeballing a graph (we've all seen the danger of citing eyeballing over data analysis). He also uses "lower atmosphere" but doesn't specify which altitude specifically.

    Incidentally, here is the updated UAH satellite data captured today. Global temperatures for March 2010 have shot up and it's looking like 2010 is going to be a very hot year:

    UAH Satellite temperature up to March 2010
  33. Thanks for the response, I went and checked the link to Roy Spencer's blog, I am glad for your ability to put forward the layman's description :). A bunch of questions arise on his content to gain more understanding, but unfortunately not enough time to go and understand this in detail, like most things. Thanks, keep up the good work.
    0 0
  34. Well, I see. Rules keep changing. Anyway, I try to repost with an explanation. Snow is not just about abundant moisture, it also indicates the lack of heat. Snow is cold. In a sense at 0 °C it is 80 °C colder than water at the same temperature. To produce meltwater at 0 °C from snow the same amount of 80 °C warm water is needed or 80 times more at 1 °C. Warming in a system far from thermodynamic equilibrium is not characterized well by its average temperature. Heat contents is a much better indicator and latent heat (or the lack of it) should not be dismissed. From a climatic point of view the energy imbalance is decisive. With much snow the weather system manages to keep its effective temperature relatively high even with diminished heat content. And snow is also an almost perfect blackbody in thermal IR, so it is an effective radiator both because of its temperature and emissivity. At the same time, it is white (a good reflector) in the visible portion of spectrum, where most incoming radiation hits the surface. UAH ch04 ("near surface") data (~ -16 °C) are not particularly hot, but indicate Earth is losing heat to space at a rather high rate right now. In other words: it is cooling. We will see a drop in OHC (Ocean Heat Content) in the coming months.
    0 0
  35. BP writes: We will see a drop in OHC (Ocean Heat Content) in the coming months. That wouldn't be surprising (if it happens), since we've been in El Nino conditions for some time now and there's typically a short-term decrease in OHC when the cycle shifts from El Nino to La Nina. It's important to keep in mind that these short-term fluctuations are superimposed on a longer-term rising trend. This is discussed over in the article What causes short term changes in ocean heat?
    0 0
  36. #85 Ned at 00:29 AM on 5 April, 2010 "these short-term fluctuations are superimposed on a longer-term rising trend" Large scale deployment of ARGO floats started in 2003. There is a huge upward jump in OHC at the NODC site in that year, since then it is decreasing (irrespective of ENSO). The jump must be an artifact due instrumental change. Pre ARGO project OHC data are unreliable. Inlet is from NOAA Multivariate ENSO Index page. Excess heat due to GHG "trapping" can go either to the oceans or to space, nowhere else. It does not go to the oceans. Therefore it escapes to space and is lost forever. No trapping. Theory should be revised ASAP.
    0 0
  37. Berényi Péter, you're dangerously falling into a grim denialism. You do not bother to verify you claims and let other people do the dirty job to make your denialism apparent. It's a bit boring. Your claim about the jump in the deployment of Argo floats in 2003 which you immagine is the cause of the jump in OHC is blatantly false. Check youself (pag.4).
    0 0
  38. Berényi Péter, and in case you may think that the number of profile may be different you'll find it here on page 9.
    0 0
  39. Berényi Péter: writesPre ARGO project OHC data are unreliable. You're wrong about this. Pre-ARGO data on OHC are more sparse and more difficult to work with, but there have been many successful analyses of long-term trends in OHC. Because this subject is off-topic for a thread on snowfall, I've replied over in the thread on Does ocean cooling prove global warming has ended?
    0 0
  40. #89 Ned at 21:40 PM on 5 April, 2010 "this subject is off-topic for a thread on snowfall" Right. I have also switched to the ocean cooling thread.
    0 0

Prev  1  2  

You need to be logged in to post a comment. Login via the left margin or if you're new, register here.


The Consensus Project Website

THE ESCALATOR

(free to republish)


© Copyright 2024 John Cook
Home | Translations | About Us | Privacy | Contact Us