Climate Science Glossary

Term Lookup

Enter a term in the search box to find its definition.

Settings

Use the controls in the far right panel to increase or decrease the number of terms automatically displayed (or to completely turn that feature off).

Term Lookup

Settings


All IPCC definitions taken from Climate Change 2007: The Physical Science Basis. Working Group I Contribution to the Fourth Assessment Report of the Intergovernmental Panel on Climate Change, Annex I, Glossary, pp. 941-954. Cambridge University Press.

Home Arguments Software Resources Comments The Consensus Project Translations About Support

Bluesky Facebook LinkedIn Mastodon MeWe

Twitter YouTube RSS Posts RSS Comments Email Subscribe


Climate's changed before
It's the sun
It's not bad
There is no consensus
It's cooling
Models are unreliable
Temp record is unreliable
Animals and plants can adapt
It hasn't warmed since 1998
Antarctica is gaining ice
View All Arguments...


Username
Password
New? Register here
Forgot your password?

Latest Posts

Archives

Is the long-term trend in CO2 caused by warming of the oceans?

Posted on 11 June 2010 by Ned

A new article by Lon Hocker at the website "Watts Up With That?" examines the relationship between global temperature and CO2 over the last three decades.  The article's conclusion is concisely summarised in its title:  The temperature rise has caused the CO2 increase, not the other way around. This conclusion would be rather startling if it were true, since the scientific consensus is that CO2 is currently acting as a "forcing" that warms the climate.  How does Hocker reach this conclusion, and is it reasonable?

The data used in Hocker's analysis are monthly atmospheric CO2 measurements at Mauna Loa (obtained from NOAA) and satellite-measured temperature data for the lower troposphere (from UAH, apparently using a subset of the global data over the oceans only).  The temperature data are recorded as anomalies, or differences between the actual temperature and the long-term mean. 

The Mauna Loa CO2 data show a long-term increase in atmospheric CO2 concentration.  The Mauna Loa data are the longest high-quality CO2 record, dating back to 1958.  While one might think that the side of a volcano might not be the best place to measure CO2, in fact the procedures used at Mauna Loa compensate for any contamination by volcanic gases.  As shown in Figure 1, since 1980 we have had global CO2 data from a network of stations, and these data show that the Mauna Loa trend is very representative of the global trend in CO2.
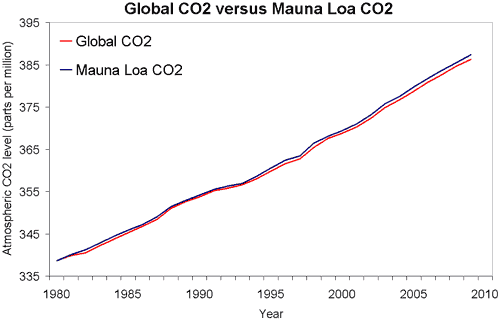
 

 Figure 1: Global atmospheric CO2 (NOAA) versus Mauna Loa CO2 (NOAA).

Hocker begins his analysis by calculating the first derivative of the CO2 data.  He does this using the difference between the CO2 measurement six months after a given month and the measurement six months before.  (Calculating this difference over a 12-month interval effectively removes the seasonal variation in atmospheric CO2 concentration.)

At this point, alert readers may begin to glimpse the flaw in Hocker's methods.  However, let's follow Hocker through to his conclusion. 

He derives a simple model to estimate the temperature anomaly as a function of the derivative of CO2 concentration:

 Temperature Anomaly = (CO2[n+6] – CO2[n-6])/(12*0.22) – 0.58

 Hocker's Figure 2 shows a comparison of the observed and modeled global ocean temperature anomaly:
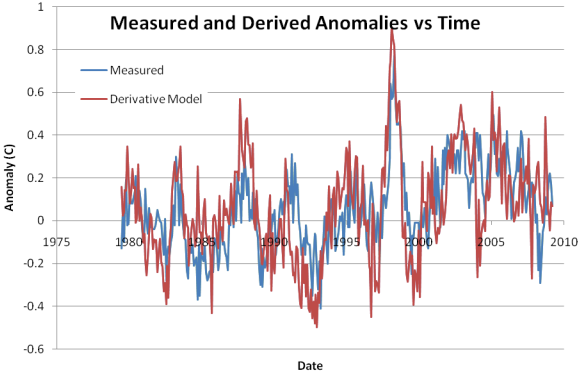

Figure 2.  Comparison of global lower troposphere temperature anomaly over the oceans (blue line) to a model based on the first derivative of atmospheric CO2 concentration at Mauna Loa (red line).  From Hocker 2010.

Looking at this figure, Hocker notes "There is a strong correlation between the measured anomaly and the Derivative model.  It shows the strong El Niño of 1997-1998 very clearly, and also shows the other El Niño events during the plotted time period about as well as the satellite data does."  He does not quantify the correlation between the two, but the squared correlation coefficient (r2) for the two time series is 0.36.

Let's pause here to consider the actual effect of Hocker's methods to this point.  Taking the first derivative of the CO2 data removes the long-term trend in CO2 concentration, and shows the effect of short-term variability around that trend.  Thus, it would be appropriate to conclude from this that short-term fluctuations in the overall upward CO2 trend are moderately well correlated with temperatures in the lower troposphere over oceans.

What Hocker actually concludes is quite different:  "Using two well accepted data sets, a simple model can be used to show that the rise in CO2 is a result of the temperature anomaly, not the other way around.  This is the exact opposite of the IPCC model that claims that rising CO2 causes the temperature anomaly." 

In other words, Hocker is claiming that his model shows that the long-term upward trend in CO2 is explained by temperature, when his methods actually removed the long-term trend.

This is where the previously-mentioned alert readers will be nodding their heads and saying "Yes!  We knew it!"  The error that Hocker makes - taking the derivative of a time series to remove its long-term trend, then correlating a second data set with this derivative, and finally claiming the second data set explains the long-term trend - is exactly the same error that was recently discovered in a prominent "skeptical" paper by McLean 2009.  McLean correlated an index of the El Niño/Southern Oscillation with the first derivative of temperature, while Hocker correlates temperature with the first derivative of CO2 concentration.  Perhaps if Hocker were an avid reader of Skeptical Science, he would have been familiar with this error in McLean's analysis and would have avoided repeating it!

What else can be said about this subject?  Well, it is true that the solubility of CO2 in seawater is a function of temperature, and all else being equal, as the ocean warms it will give off CO2 to the atmosphere.  And in fact this is the mechanism by which a CO2 feedback amplified the temperature swings during the Pleistocene glacial/interglacial cycles.  But in today's world, the greatly increased partial pressure of CO2 from fossil fuel emissions causes a flux of CO2 from the atmosphere to the oceans.  This is known from decades of oceanographic surveys that show the oceans are a "sink" rather than a source of CO2 in the atmosphere (Takahashi 2009, Sabine 2004).

It's also interesting to note that climate scientists have known for at least three decades that short-term fluctuations in temperature (e.g., those associated with the ENSO cycle) are correlated with short-term fluctuations in the rate of increase of atmospheric CO2 (Bacastow and Keeling 1981).  Section 7.3.2.4 of the IPCC AR4 Working Group 1 report discusses this in some detail.

Thanks to commenter Joel Shore at Watts Up With That, who provided a reference to the IPCC AR4 discussion of interannual changes in the CO2 flux and their relationship to the ENSO cycle and other short-term phenomena.

0 0

Printable Version  |  Link to this page

Comments

Prev  1  2  3  Next

Comments 51 to 100 out of 107:

  1. Arkadiusz, there are essentially three large short-term CO2 fluxes in the climate system (ignoring slow processes). * The surface ocean/atmosphere CO2 flux. This is pretty well understood in its broad details (Takahashi 2009, Sabine 2004). There is a clear consensus that under current conditions the ocean is a net sink for CO2, not a net source. * The anthropogenic land use & fossil fuel CO2 flux. This is likewise well understood in its broad details, and we know that we are emitting an amount larger than the observed atmospheric increase in CO2. The oceans are taking up part of this increase. * The atmosphere/terrestrial biosphere (incl. soils) CO2 flux. This is the most difficult to characterize and has the most uncertainty. Much of the interannual variability in the long-term accumulation of CO2 in the atmosphere is caused by variability in this flux. However, simple accounting tells us that the terrestrial biosphere has to be a long-term net sink for CO2 because we know how much we're producing, we know how much is accumulating in the atmosphere, we have a pretty good idea of how much is going into the ocean ... and there isn't any other sink. So the uncertainty in the details of how terrestrial sinks process carbon isn't really relevant to the larger topic here. If someone were to ask "What fraction of the observed CO2 increase in the atmosphere is due to anthropogenic sources?" the correct answer is "More than 100% of it."
    0 0
  2. For those who haven't read my posting, you might do well to read it at WUWT, before commenting. The linear term is not gone, but converted to a constant. I am shocked how few people remember their calculus. I chose Mauna Loa CO2 and Satellite temperatures, because those are the only data source that is not disputed. A different view of the comparison is shown in Figure 3, where the Mauna Loa CO2 concentrations are modeled over the last 30 years using ONLY the satellite temperature data. Basically, Figure 2 is integrated to produce figure 3. There is no residual needing a contribution anthropogenic CO2. There is no missing linear term. Please feel free to make you own model, but I won't buy into it unless it matches the observations of those two very reliable data sets.
    0 0
  3. Hello, Lon. Thanks for joining us. In your post at WUWT, you wrote: Using two well accepted data sets, a simple model can be used to show that the rise in CO2 is a result of the temperature anomaly, not the other way around. This is the exact opposite of the IPCC model that claims that rising CO2 causes the temperature anomaly. This is simply wrong. Differentiating the CO2 time series converts the long-term trend in CO2 to a constant in your model. That expressly means that the trend is not dependent on temperature anomaly. The correct interpretation of your model would be that there is a long-term underlying rise in CO2, with short-term variations in that trend being partially correlated with temperature anomaly. This is quite different from your original claim. It's also basically uncontroversial -- despite your suggestion that you have overturned the IPCC model, all you've really done is provide a somewhat crude empirical model of the terrestrial carbon cycle feedbacks that amplify the direct CO2 forcing. As Joel Shore told you, this is discussed in some detail in the IPCC AR4 WG1 report. I'm a bit surprised that you still don't seem to understand this. I would think that once people started pointing out these problems, you would have wanted to first make sure you understood them, then posted a clear and unambiguous retraction over at WUWT. Perhaps something like that is in the works?
    0 0
  4. Lon, compare your method to original critique of McLean etal, old news Your methodology differs from this how?
    0 0
  5. Hi there Ned. It's time for you to review your calculus. Differentiating moves all terms over one place in the power series. You lose the constant (in figure 3, that's the starting CO2 concentration), but all the other terms are intact. When I integrate figure 2 to get figure 3, you can see the match is excellent. There is no need, and indeed, no place for any human CO2 contribution. You claim that short term variations in CO2 come from temperature and long term from anthropogenic CO2. Great, data sets are available for CO2,temperature, and the man made contributions. Show me that your model fits the data as well as mine. No hand waving, just do it! If you can't, your model is wrong. Let me repeat myself. You can calculate the Satellite temperature anomaly series from the Mauna Loa CO2 series and visa versa. There is no need or place for an anthropogenic term. I know this contradicts what the IPCC says. Deal with it.
    0 0
  6. scaddenp See my comment above. Bless, doesn't anyone on this site know any calculus?
    0 0
  7. Lon >You lose the constant ... but all the other terms are intact. No, like you said in your previous sentence, all terms move over one place in the power series. This means that a linear function would turn into a constant, just like Ned said it would. By differentiating the CO2 series, what you are doing is comparing temperatures to changes in the rate of CO2 accumulation, not changes in total volume. This makes physical sense, as temperatures surely affect the rate at which various processes can absorb CO2 from the atmosphere, so the comparison may have some merit, just not in the way you claim it does.
    0 0
  8. Making progress here. Between Willis and Hocker it seems that increases of both C02 and surface temperature are accepted as fact, reliably measured. Lots of buy-in to this even in the most revanchist circles, such as WUWT. Does this mean we're only a single step away from a grand reunification of thought?
    0 0
  9. Lon >You can calculate the Satellite temperature anomaly series from the Mauna Loa CO2 series and visa versa. No, you can calculate the derivative of CO2 levels from temperature anomaly, if you try to integrate back to the absolute CO2 level change, you lose a constant. Again, all you can conclude from this is that temperatures affect the rate at which CO2 accumulates in the atmosphere, not a direct correlation to changes in absolute volume.
    0 0
  10. doug_bostrom, I'll buy into that if you change "increases" to "changes". Please note that the satellite temperature anomalies are anything but monotonically increasing. The fun part of my analysis is that these bumps correlate to kinks in the CO2 plot. No we're not one step away. The next step is to accept that the rate of change of CO2 correlates nicely with the satellite-measured temperature anomaly. The final step is to agree on why!
    0 0
  11. Wow! Great stuff. Nice of Hocker to show up. Also good to note y'all were civil to him. Ned, I usually disagree with you but this time you and caerbannog have my vote.
    0 0
  12. Lon, I can do my calculus thank you. Now if you have an series which contain an oscillating component and a trend, you cant make statements about cause of trend by correlation of something with a differential of the series. McLean tried that. So far all you are talking about is the unremarkable and well discussed carbon feedback cycle as other posters have explained.
    0 0
  13. Lon, the mistake you're making is confusing changes in rate with the rate itself. Your calculus is fine, it's your interpretation of that calculus that is in error. Since you have training in physics, I think a nice physical analogy will help illustrate the error: Say you are a skydiver falling at terminal velocity. It should evident that a) you are falling and b) your velocity is constant, so the derivative of your position is a constant. Now, let's say you start moving your arms in and out. As you spread your arms out, your velocity decreases, as you pull them in, your velocity increases. Now, if you differentiate the function of your position (getting velocity), and compare it to the spread of your arms, lo and behold, you'll find a very strong correlation! Does that mean that the motion of your arms is causing you to fall? Of course not! To second some comments made by others, I appreciate that you have come here to take your criticism head on, it is indeed admirable. I hope you have the mental fortitude to step back and evaluate your own claims critically.
    0 0
  14. Come to think of it, I suppose Hocker's in disagreement with Eschenbach, so forget the Grand Unification. Meanwhile there's at least one person here who's going to disagree with Lon's hypothesis because OHC measurements are "wrong", suffering from splicing problems. Berenyi Peter, where are you? Lon, you say a warmer ocean ocean is releasing C02 as a result of an increase in temperature. I take it you disagree with isotope ratios as a means of identifying the provenance of C02? Or do you see the C02 in the ocean as being very poorly mixed?
    0 0
  15. Lon, you yourself (#52) said above that the linear trend is converted to a constant when you take the derivative of the time series in CO2. There is no slope, just a constant, so no trend over time. Everyone here is agreed that you can't explain away the increase in CO2 using temp if you remove the CO2 trend first. What gives? We're confused. Also, why not try your analysis without taking the derivative first? And how do you reconcile this analysis with change in isotopic composition of atmospheric CO2 and observed acidification of the ocean?
    0 0
  16. Lon, you -don't- see a temperature trend in the data you use? Your own paper says "Figure 1 shows a plot of the Ocean Temperature Anomaly from the satellite data shows a general rising trend. Shown along with the temperature data is a simple linear model showing the temperature rise as a linear function of CO2 concentration.
    0 0
  17. All: You might be interested to know that I first observed this correlation by integrating the temperature data to model the CO2 value. It's still posted on my site 2BC3.com/warming. I offered no explanation then because I hadn't come up with one! You are right, Willis' explanation does not agree with mine. Stephen Baines: Taking the derivitive promotes the parabolic term to the slope. Please review your freshman year calculus. Think Tailor series: the derivative of X**n is n*X**(n-1). Doug: Thanks for pointing out the C12/C13 data. I'll likely try to make a clearer explanation in a later post in WUWT, but if you buy that there is an equilibrium amount of CO2 in the air related to the ocean temperature, then when the ocean heats AND folks add CO2 to the air, the ocean will release less by the amount that folks add. Not surprisingly the atmosphere will hold CO2 that was added. Thanks all for your comments. I know that I am preaching heresy, but sometimes the "established" science is wrong.
    0 0
  18. Please review your freshman year calculus. I'm probably not the only one to think this remark obnoxious, same as "deal with it" except repeated on this thread so often already as to be boring. Cliches about physicists duly noted, arrogance is actually not a flattering posture.
    0 0
  19. Lon, there's no need to repeatedly tell people to review their calculus. What you've done just isn't that complex. But it isn't that transparent either, at least the final form of the derivative isn't. You should be trying to help us understand, rather than making arrogant comments. In any case, the existence of multiple terms doesn't really negate the concerns about your approach. Given that the last 30 years the increase in CO2 has been close to linear, you have still removed the vast majority of the variation in the original data by taking the first derivative (the linear term). I don't see how you can claim to explained the increase in CO2 via temp given that that most of the variation is removed. A statistical approach can only get you so far. Noone disputes that variations in temp should have some influence on the partitioning of CO2 between atmosphere ocean and land, and long term increases in CO2 should have an affect on temp. As others have said, that is one of the bases of the presumed CO2 induced climate feedbacks. Your analysis may have picked up the high frequency variation in CO2 driven by temp, but it ignored the trend that appears to be driving our current climate. Your anlaysis does nothing to negate the real facts in support of a human source for increasing CO2: humans have produced almost double the CO2 that has accumulated in the atmosphere, the changing stable isotopic composition of atmospheric CO2 indicates a plant source, O2 has not also risen (as would be expected if CO2 was coming from a warming ocean) and net flux of CO2 is into the ocean, as indicated by its acidification.
    0 0
  20. Lon, please. Everybody commenting in this thread understands first-year calculus. Can you address the substantive issue here? The conclusion from your post at WUWT was, in your own words, " the rise in CO2 is a result of the temperature anomaly". The correct interpretation of your model would have been "changes to the rate of increase in CO2 are moderately correlated with temperature" (r2 = 0.36). You write Show me that your model fits the data as well as mine I'm not proposing any model. I'm talking about the actual meaning of your own model, the one you presented at WUWT. If you still truly don't understand the errors in your conclusions, there are lots of people here or at WUWT who can help explain this. If you do get the point now, it would be much better for everybody if you'd just drop the bluster about "preaching heresy" and say so. Since you say that you're planning a followup post at WUWT, here are some points to consider: (1) The actual rate of increase in the atmospheric CO2 concentration isn't linear; it's close to exponential (but actually a bit steeper than exponential). (2) That overall increase is coming from anthropogenic sources, not the ocean. Emissions have been well quantified; about half of the annual anthropogenic emissions accumulate in the atmosphere while the other half is taken up by various sinks in the ocean and the terrestrial carbon system. (3) CO2 is on net moving from the atmosphere to the ocean, not the reverse (see the references to Takahashi 2009 and Sabine 2004 at the top of this thread). (4) What your model actually illustrates -- the existence of a carbon-cycle feedback whereby CO2 warms the climate, and that warming results in the addition of more CO2, further amplifying the warming -- has been known to scientists for at least three decades, and is discussed in the IPCC reports. This is not news.
    0 0
  21. Lon writes: Show me that your model fits the data as well as mine. No hand waving, just do it! If you can't, your model is wrong. As explained in my previous comment it's not really necessary to do this -- one can invalidate Lon's conclusions based just on understanding the math, without any kind of actual demonstration. However, sometimes people like to see things visually. If Lon is right and the temperature anomaly is actually causing the rise in CO2, then a model that does not include temperature anomaly should be a very poor fit for the observed CO2 trend. If the rest of us are right, then a model that omits temperature anomaly should provide almost as good a fit as one that includes it. Lon's model to predict CO2 as a function of temperature anomaly is: Month(n) CO2 = Month(n-1) CO2 + 0.22*(Month(n) Anomaly + 0.58) For comparison, here's a model that predicts CO2 only as a function of time, without temperature (I've deliberately structured it to be similar to Lon's): Month(n) CO2 = Month(n-1) CO2 + 0.00178*(Month(n) date - 1915) where "date" is the decimal year (year + (month-0.5)/12, e.g., 1979.042 for January 1979) Here are the results of the two models, compared to observations: To be clear, I'm not proposing this as an alternative to Lon's model; I'm using it as an illustration of the fact that temperature anomaly has only a small effect on the overall trend of CO2. One could further improve on this, if one wished to make it more physically realistic. But the key point here is that Lon's conclusion just does not stand up to even a very simple test.
    0 0
  22. OK, cut to the chase: I have a simple model that relates the rate of change of CO2 to the temperature anomaly, or conversely shows that you can derive the CO2 level from the temperature anomaly (I used the ocean temps). You folks apparently believe that this is false, despite the correlation. You would also seem to believe that the anthropogenic contributions are important. Ned, you made an excellent plot using decimal date, how about making a similar plot, but starting with some function of the anthropogenic CO2 emissions. You might even want to modulate it with the temperature data.
    0 0
  23. @Lon Hocker There is no surprise that the rate of change of CO2 correlate well with satellite temperature anomaly since both have a common cause(enso), both satellite temperature and carbon dioxide lags enso by several months however this doesn't mean that carbon dioxide short term fluctuations are due to ocean outgassing...as i have pointed out before it is well known instead that oceanic carbon anomalous fluxes and enso are anticorrelated while tropical land fluxes and enso are correlated and this is mainly due to precipitation change associated with enso driven atmospheric patterns not temperature. Also this mechanism cannot account for long term co2 increase because forests are a net carbon sink in the last two decades.
    0 0
  24. Lon, "cutting to the chase" necessarily requires you to reasonably address at a minimum the inconsistencies noted by Ned here. Since you're so strong on maths, you should probably do so in detail. Don't expect other people to do work for you, you're making an extremely bold claim based on what you yourself describe as "a simple correlation" and it's up to you to make it function. Can you defend your hypothesis against first-order problems, yes or no?
    0 0
  25. doug: "(1) The actual rate of increase in the atmospheric CO2 concentration isn't linear; it's close to exponential (but actually a bit steeper than exponential)." Actually it correlates beautifully to the integrated temperature anomaly referenced to about 1850 when temperatures are generally accepted to be reasonably constant. That is the thesis of my post. "(2) That overall increase is coming from anthropogenic sources, not the ocean. Emissions have been well quantified; about half of the annual anthropogenic emissions accumulate in the atmosphere while the other half is taken up by various sinks in the ocean and the terrestrial carbon system." I disagree. "(3) CO2 is on net moving from the atmosphere to the ocean, not the reverse (see the references to Takahashi 2009 and Sabine 2004 at the top of this thread)." I assert that the CO2 concentration is calculable from the temperature. No anthropogenic contributions and it comes from the ocean, enough anthropogenic contributions and it goes into the ocean. The concentration still correlates to the ocean temperature" "(4) What your model actually illustrates -- the existence of a carbon-cycle feedback whereby CO2 warms the climate, and that warming results in the addition of more CO2, further amplifying the warming -- has been known to scientists for at least three decades, and is discussed in the IPCC reports. This is not news." I have no idea how my model illustrates this, and accordingly I disagree. As for your first order problems, perhaps you are referring to the 0.58 term which puts a starting point to the anomaly at about 1850. Beyond that I am at a loss to understand your objections. Also doug: I asked Ned to calculate CO2 based on the anthropogenic contributions because it's a lose lose for me if I do. If I can't come up with a good fit, you will claim that I didn't do it right, if I do come up with a good fit, and you disagree with the equation, you'll say it's wrong. If Ned does it, you won't argue. Ned appears to be a bright guy, let's see what he can come up with. Willis had a shot at it a while back on WUWT, maybe Ned can do better. gp2: The rate of increase of CO2 correlates to enso. Why should that be? Also, the rate of increase of CO2 seems to correlate a lot better to the temperature anomaly than it does to enso. Does that fit your understanding?
    0 0
  26. @Lon Hocker It is explained in the paper that i have linked before Satellite temperature anomaly lags enso by aprox. 7 months that's because it requires times before warming/cooling in the tropical pacific affect the entire world. Also carbon dioxide short term fluctuations lags enso by approx. the same time...that's because el nino reduce rainfall over tropical rainforest and it requires several months before this lead to decreased gross primary productivity and increased plant and soil respiration (the forest do not dry out within 1 month...)and the opposite for la nina. So the strong correlation is due to different mechanism that both lags enso by approx. the same time and assuming you have computed correlation between enso and co2 at lag 0 no doubt that this is lower
    0 0
  27. Lon, "I have no idea how my model illustrates this, and accordingly I disagree." [referring to a positive feedback] That response is woefully inadequate. With respect, I do think that you do not understand the carbon cycle, and the feedbacks which form part of that cycle. It is no surprise that variation in ocean temperature "explains" about 35% of variation of the rate of change in atmospheric CO2. As others point out that R^2 value is indicative of a positive feedback at work. Of course, correlation does not suggest causality, and what do you attribute to explaining the other 75% of the variability in the rate of change of CO2? Have you considered applying a Granger causality test? Ned and others have soundly refuted your misguided assertion (e.g., in the main post, and at #70, and at #71). I also find it odd that some "skeptics" are trying to argue that the oceans have not been warming, yet it its that very warming that lies at the heart of your hypothesis. You also might want to ask yourself what has been causing the increase in global SSTs. Answer, a positive net energy imbalance on account of an enhanced greenhouse effect. It is well established that about 45% of anthro CO2 remains in the atmosphere, with the remainder being sequestered into the oceans and vegetation. Or do you question that fact? You model also does not address why other greenhouse gases such as N2O and CH4 have been increasing. There is an anthro connection there too. Do you trump that up to coincidence? Your hypothesis is also not consistent with global ocean pH declining. What you work does seem to support the well-established fact that as the oceans continue to warm, their ability to act as a sink for carbon will be inhibited.
    0 0
  28. I think we are stuck in a loop. gp2: Why does El Nino affect the rate of change of CO2, not the CO2 level directly? Albatross: The temperature anomaly explains ALL of the CO2 change if you reference the anomaly to about 1850 when temperatures are generally accepted to have been constant. Global SST rise caused by the CO2 induced greenhouse effect definitely does not fit the data. The anomaly would be linearly dependent on CO2, and it isn't. It depends on the rate of increase of CO2. No, I do not address any other of the "greenhouse" gasses. I'll leave that to others.
    0 0
  29. Lon: "(2) That overall increase is coming from anthropogenic sources, not the ocean. Emissions have been well quantified; about half of the annual anthropogenic emissions accumulate in the atmosphere while the other half is taken up by various sinks in the ocean and the terrestrial carbon system." I disagree. Well, if you disagree and your hypothesis depends on maintaining and defending that disagreement you're not done with your work, yet. Some might even say you've not even started to make a case or at least have skipped over a vital dependency. You need to show why and then how you disagree. You're saying "I doubt it" without actually contradicting the observations you're doubting, an insufficiently persuasive argument. "(3) CO2 is on net moving from the atmosphere to the ocean, not the reverse (see the references to Takahashi 2009 and Sabine 2004 at the top of this thread)." I assert that the CO2 concentration is calculable from the temperature. No anthropogenic contributions and it comes from the ocean, enough anthropogenic contributions and it goes into the ocean. The concentration still correlates to the ocean temperature" So -where- is the C02 you're correlating with temperature coming from? Atmospheric C02 is still increasing, the quantity in the ocean is increasing. What physical process driven exclusively by temperature is causing observed C02 to increase simultaneously in the ocean and atmosphere? As an additional complication, isotope ratios indicate that a substantial amount of the observed increase is derived from fossil fuels, unless you can show how it is not, in detail as opposed to punting with "I disagree." Assuming you can make a persuasively detailed argument against using isotope ratios as a fingerprint, an argument sufficiently powerful to supersede accepted research on that topic, then how does the increase in temperature change the isotope ratio of carbon found in C02 samples?
    0 0
  30. Lon, just a quick point that quite apart from mathematical misunderstandings your hypothesis is foundering because it's incoherent with a mountain of other research findings. The issues Ned brought up are just a few twigs of the thicket you need to negotiate. There's no shortcut here, you needed to reverse a host of other results -before- you started working your "simple correlation." This has happened before (the famed G&T false falsification) and is a classic error for a physicist. Don't feel alone.
    0 0
  31. Despite some real misgivings, I'm going to accede to Lon Hocker's request and show the results of a "Hocker-style" model that estimates CO2 concentration as a function of fossil fuel emissions: The data are from ORNL-DAAC. The model, again designed to have the same structure as Hocker's, is as follows: Month(n) CO2 = Month(n-1) CO2 + [2.02748E-05]*(Month(n) emissions + 553.59116) where "emissions" is the annual global total from the source provided, in million metric tons C (monthly data are not available). Obviously, the emissions model looks like a very good fit to the observations. Does that mean we can conclude that anthropogenic fossil fuel emissions are the cause of the long-term rise in CO2 concentration? Well, yes, we can conclude that, but not from this model! The point that Lon apparently still does not understand is that in this model, like his model at WUWT, the overall rise in CO2 is "built in" to the model, and the independent variable (T anomaly in Hocker's model, emissions in this one) only contributes a small fraction of the explanatory power of the model. So you can't use this kind of model to conclude that factor X is the primary cause of the rise in CO2. The "beautiful correlation" that Lon is so impressed by in this comment is not provided by the temperature data at all, just by the constant term in his model! So, how do we know that the observed rise in atmospheric CO2 concentration is caused by anthropogenic emissions (from fossil fuels and land-use change), rather than from volcanoes or a warming ocean or something else? It doesn't require calculus. It doesn't require statistics. All it takes is the ability to look at two numbers and say "A is bigger than B" ... something most children can do well before arriving in Kindergarten. We know (from various accounting studies) how much CO2 we are contributing to the atmosphere each year ("A"). We know how much CO2 is accumulating in the atmosphere each year ("B"). Since "A" is bigger than "B" it is blindingly obvious that our emissions are responsible for more than 100% of the annual increase in CO2. As icing on the cake, though, we also know with a very, very high degree of confidence that the oceans are NOT the source of the observed rise, because there is a net flux of CO2 from the atmosphere to the oceans. This has been very, very well established through decades of direct measurement of C chemistry in the upper ocean. (Once again, I direct those who have questions about this to Takahashi 2009 and Sabine 2009). See also points 1-4 from my comment above, which still stand.
    0 0
  32. Ned, you have the patience of a saint. Thanks for all your work on this! Lon @78, Sorry, but I honestly do not know what you are trying to say.
    0 0
  33. Ned, kudos for continuing to try and communicate. Can I suggest you copy your post to WUWT as well in case any intelligent life visits there?
    0 0
  34. Really I think Ned at 71 nailed it. That graph shows that virtually all of the predictive power of Lon's model is the result of assuming a constant rate of increase in CO2, month on month as indicated by the INTERCEPT of his regression. Temp may be important for looking at changes in the rate of change on short time scales, but it tells you nothing about the trend in CO2. Looking at the r2 of the temp vs dCO2/dt regression is very misleading in this case. The r2 only tells you the proportion of the variance AROUND THE MEAN that is explained. It says nothing about how far the mean of the response variable is above zero relative to the variation around the mean. It wouldn't matter in most cases, but here you have an iterative calculation, where the intercept is added at each sequential time step.
    0 0
  35. Took too long to post! Ned at 81 not only nailed it, he sunk the nail, spackled the hole, and painted the wall a nice pretty color of red. Lovely.
    0 0
  36. Wonderful work, Ned. I really appreciate your input. Now let me add another challenge. Make a model that makes sense physically and fits the data, including the kinks. Use an anthropogenic term, but add a term allowing for the CO2 sink that you know exists, and makes sense physically. I would imagine that this term should be proportional amount of CO2 in the air, and to the temperature anomaly plus some value related to the temperature at which the ocean is saturated with CO2 at that temperature (the bigger this difference,the more it will be able to absorb). If and when you find a fit, you will have coefficients that mean something! My model is similar to this, except that it claims that the very top surface (averaged over the ocean) is in equilibrium with the atmosphere, but it there is a huge time constant associated with the mixing of the surface and the whole ocean, so the system is in an approach to equilibrium state where the CO2 rate of change is proportional to the difference between the current ocean CO2 level and the level it would reach if the mixing had occurred. You could put a time constant in your absorption equation too. Albatross: The temperature anomaly is a temperature referenced to an arbitrarily assigned starting temperature. As I remember, in this case it's the average of temperatures between 1980 and 1990. The .58 in my equation moves this reference back to temperatures that are generally accepted as being seen in about 1850, when they were considered relatively constant, and coincidentally when anthropogenic contributions were relatively small.
    0 0
  37. My model is similar to this, except that it claims... Not so simple after all, it seems. Natch, the first claim generates more exceptions, more claims. I don't think Lon intends this to be taken seriously, as a substitute for research, but I presume to say that. Anyway, what about the maths error?
    0 0
  38. Doug, all that was in my original posting, though not in as much detail, as I figured most folks could follow what I had written. I guess you didn't read the original posting, or if you did, you certainly didn't understand it. What maths error?
    0 0
  39. Sigh - the McLean maths issue. Try doing same trick tamino did your data. Add an arbitrary linear trend to the raw data, repeat your analysis. Aside from that. "Make a model that makes sense physically". Yes indeed. In real world oceans are still absorbing CO2 where deep water is created. Sure there is outgassing of CO2 where deepwater rises to surface - that detrended signal you are seeing - but net effect is that oceans are still net sink. Your model is not physically reasonable in this light. It is contradicted by CO2 accounting, by ocean acidification and by isotope measurements.
    0 0
  40. Lon, I don't think what Ned is saying to you is sinking in. Ned has pointed out that the reason your model is able to recreate the modern CO2 trend from temperature data, is that the background trend of CO2 release has been hard coded into your model as a constant multiplier. You cannot draw any conclusion whatsoever from this as to where that background trend comes from, your model just assumes it exists as a static value. When you are "reconstructing" the CO2 trend from temperature using your model, all you are doing is taking that background trend and combining it with the temperature signal. Basically all this exercise accomplishes is to restate the conlusion that the rate of CO2 accumulation is correlated to temperature. This is the only conclusion you can come to. Attempting to extrapolate this to suggest that the level of CO2 is correlated to temperature to the same degree is logically invalid. I have a counter-challenge for you: try applying your model to some out of sample data, specifically a time period where the rate of CO2 release was significantly different from that of the last 30 years. If Ned is right, your model will fall apart rather quickly.
    0 0
  41. It may well be that the appropriate moment for a graceful climbdown passed unnoticed while Lon was issuing jibes about "freshman calculus." History analogizes itself again?
    0 0
  42. scaddenp: Challenge response: Pull back to 1850. According to most data, the temperature was pretty much flat at a value about 0.8C less than now. My model would show CO2 would stay constant. Linear Trend response: Add a linear trend to the Mauna Loa CO2 data, and the 0.58 term would change accordingly. Figure 2 would look the same, since the equation would subtract out the revised 0.58 value, and the shape of the Modified Mauna Loa data would be reproduced. Doug: I'm not sure what you mean by that, but if you are suggesting backing off the rhetoric, I all for it.
    0 0
  43. Lon, my point is that you add a trend to the data so it was even an anti-correlation between temperature and co2, you would still be able to derive your model. ie it makes no statement about trend. On top of this, you still have to explain the magic by which co2 comes from ocean while ocean co2 increases and how to reproduce the atmospheric isotope data with an increase in ocean CO2.
    0 0
  44. scaddenp: Sorry I don't understand what you are saying. Add a linear trend to what? No need for magic. The equilibrium is between the bottom of the atmosphere and the top of the ocean, and if the ocean needs to add CO2 to the atmosphere to keep equilibrium, it will add it. If it needs to sink it, it will sink it. If you dump CO2 into the atmosphere more quickly than the change in the surface temperature would demand, it sinks it. All: Many thanks for all your contributions to this thread. Clearly, I did not do a good enough job of presenting my model. Time to do a rewrite instead of trying to address your questions one at a time. Keep your eyes on WUWT!
    0 0
  45. Lon Challenge response: Pull back to 1850. According to most data, the temperature was pretty much flat at a value about 0.8C less than now. My model would show CO2 would stay constant. No! It would show the RATE of CO2 accumulation would be constant. You have to integrate to get back to the change in LEVEL. Why do you persist in making this elementary error? The question remains, is the rate your model predicts accurate? How about you actually try it out? Ned at least put a little effort into his argument.
    0 0
  46. e: Month(n) CO2 = Month(n-1) CO2 + 0.22*(Month(n) Anomaly + 0.58) Plug in the value for current anomaly, and you get Month(n) CO2 = Month(n-1) CO2; no increase of CO2 You need help with your math.
    0 0
  47. I assume what Lon is trying to say in this comment is that a temperature anomaly of -0.58 would give no change in the CO2 concentration. As far as I can tell, that's just about the only correct statement he's made here. It's also a sign of the obviously unphysical behavior of Lon's model, since an anomaly of -0.58 would produce an ocean/atmosphere equilibrium regardless of what the CO2 level was at the time -- it could be 100 ppm, 300 ppm, or 1000 ppm. But this is all getting away from the point. Lon, it's been clearly established here that almost all the explanatory power of your model comes from the constant upward trend that's hard-wired into it. You can get more or less similar results by taking temperature anomaly out and plugging in almost anything else -- time, or emissions, or whatever. You can even make a Hocker-style model that predicts CO2 as a function of a series of random numbers ... and it gets the overall trend right. Instead of telling me to make more changes to this or that model, and to try different things, and telling other people that they don't understand math, why don't you try addressing the point of this thread? Here it is, in a nutshell, in case you've forgotten it: (1) Your post at WUWT claimed that "the rise in CO2 is a result of the temperature anomaly" and that "This is the exact opposite of the IPCC model". (2) As discussed repeatedly in this thread, your model actually builds in a linear rising trend in CO2, which is then slightly modified by the temperature anomaly. But almost all the explanatory power of your model comes from the constant trend, and has nothing to do with temperature anomaly. This has been explained both mathematically and visually. (3) As pointed out by Joel Shore at WUWT, and as I repeated here, the idea that there are positive carbon-cycle feedbacks is not news to the IPCC or anyone else in climate science. The small additional CO2 added or removed as a feedback during the ENSO cycle has been discussed in the literature for at least three decades and is covered in the IPCC AR4 WG1 report. In other words, not only does your model not contradict the IPCC's findings, it actually reiterates them. (4) This kind of model cannot answer the question of what causes the observed rise in CO2. However, there is a large body of evidence that leads us to conclude that anthropogenic emissions are responsible for the entire observed increase, and that additional anthropogenic CO2 is being taken up from the atmosphere by the oceans. There are other minor points that have been made along the way (like the fact that the actual source of the carbon-cycle feedback during ENSO is mostly from the terrestrial biosphere, not the oceans). But it would be nice if you would just for once address the main point of this thread.
    0 0
  48. Lon, If temperatures just happen to stay at an anomaly of -.58, then yes, your model predicts no change in CO2, however consider what happens if temperatures remain "flat" at any other anomaly: Your model predicts that CO2 will continue changing forever. To summarize: if temperatures remain at an anomaly of exactly -.58, then your model predicts CO2 level will never change, if temperatures remain at any other anomaly, then the CO2 level changes forever. Also, if temperature anomaly is less than -.58, your model predicts a drop in CO2 levels, even if temperature has been increasing year to year! And the corollary: if temperature anomaly is greater than -.58, your model predicts an increase in CO2 levels, even if temperature is dropping! Does that really make sense to you? What's so magical about an anomaly of -.58 that the physics of CO2 accumulation hinges on it? This unphysical prediction is a direct result of what Ned has been telling you over and over again: your model is nothing but a hard-coded linear trend scaled by temperature anomaly. Replace temperature with any other linear trend and you can construct a model that is just as good as yours. The model has no real predictive power outside your sample set, and it certainly has no physical implications beyond a restatement of what was already known.
    0 0
  49. e: No it wouldn't rise forever, it would asymptotically head for a saturation value. Clearly, you need to reread the original posting.
    0 0
  50. Lon writes: No it wouldn't rise forever, it would asymptotically head for a saturation value. Clearly, you need to reread the original posting. Lon, your model says that if T_anom stays constant at any value above -0.58, CO2 will rise linearly without bound. If it stays constant at any value below -0.58, CO2 will decrease without bound (eventually becoming negative!) You may say that this wouldn't happen in the real world. But "e" is obviously correct in stating that this is what happens with your model. I note that we're now at 100 comments (48 since you joined) and you have still not addressed the primary points of this thread. * Your model doesn't prove what you said it proves. You appear not to understand how your model actually functions. * The actual meaning of your model (not your misinterpretation of it) is something scientists have known for decades and is discussed in the IPCC AR4 report. * The oceans are currently a net sink, not a net source, for CO2.
    0 0

Prev  1  2  3  Next

You need to be logged in to post a comment. Login via the left margin or if you're new, register here.


The Consensus Project Website

THE ESCALATOR

(free to republish)


© Copyright 2024 John Cook
Home | Translations | About Us | Privacy | Contact Us