Climate Science Glossary

Term Lookup

Enter a term in the search box to find its definition.

Settings

Use the controls in the far right panel to increase or decrease the number of terms automatically displayed (or to completely turn that feature off).

Term Lookup

Settings


All IPCC definitions taken from Climate Change 2007: The Physical Science Basis. Working Group I Contribution to the Fourth Assessment Report of the Intergovernmental Panel on Climate Change, Annex I, Glossary, pp. 941-954. Cambridge University Press.

Home Arguments Software Resources Comments The Consensus Project Translations About Support

Bluesky Facebook LinkedIn Mastodon MeWe

Twitter YouTube RSS Posts RSS Comments Email Subscribe


Climate's changed before
It's the sun
It's not bad
There is no consensus
It's cooling
Models are unreliable
Temp record is unreliable
Animals and plants can adapt
It hasn't warmed since 1998
Antarctica is gaining ice
View All Arguments...


Username
Password
New? Register here
Forgot your password?

Latest Posts

Archives

NASA-GISS: July 2010-- What global warming looks like

Posted on 13 August 2010 by Doug Bostrom

"Where's the evidence" is the frequent demand of folks doubting what science tells us of climate change. This isn't surprising because we're looking at a system with enormous inertia and so climate shifts will generally show up as incremental creep over a long period of time. We can look at years of results nicely presented by such tools as NOAA's "Climate Indicators" visualization page but what we see there is nothing we'll notice happening on a day by day basis in our lives.

Weather effects of climate change are elusive when it comes to attribution; an unusual spate of hot weather simply can't be put down to a variation in climate without being viewed in a larger context. Indeed it's best for us laypersons to avoid attributing weather we may feel is unusual to any particular cause. Heavy snowfall last winter was frequently cited as evidence of a halt in global warming or evidence that anthropogenic climate change had been exaggerated; our personal feelings overrode what science told us we could expect of climate change.

There is however a means of separating our gut instinct about today's weather from more objective means of assessment. We can look at any day's weather from a statistical viewpoint. Compared to typical climatology, how does today's weather stack up? How does a sequence of days look? What does the frequency and magnitude of new weather records tell us?

Meehl 2009 looked at weather statistics from the perspective of the ratio of record high and low temperatures over the past few decades. In general we'd expect a large thermometer network of stations in operations for many decades to exhibit a more or less 1:1 relationship of new record highs versus lows. But the statistics clearly show otherwise:
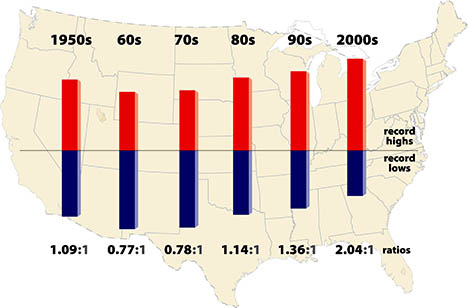
Meehl shows how a statistical look at weather events can tease out information about which way our climate is heading. But this is still not something that can be described as a notable phenomenon, an event that gives us an intuitive feel for the changing behavior of our climate.

Sometimes however unusual weather events and patterns can emerge from the statistical background as a noticeable cluster, a burst of dramatic activity that catches our notice. Our intuition may lead us to wonder if we we're witnessing something more significant than weather.

Weather around the planet so far this year has indeed included some unusual events, to put it mildly, occurrences that are notable from a statistical viewpoint and extend a remarkable recent  bulge in records. 75 countries or 33% of the nations on Earth have set historical high temperature temperature records in the past 10 years, versus 15 countries setting record lows. 17 countries have set all-time national high temperature records this year, with only a single country reaching a record low. This has happened in a year where global temperature for January through July of this year is the hottest on record. The 12-month running mean of global temperature is at a record high. Unprecedented monsoon flooding in Pakistan has left some 10% of citizens suffering from flood effects with river flows on the Indus exceeding any past measurements. Russia has seen prolonged temperature extremes far outside the historical record, leaving probability in the neighborhood of 1:1000 in terms of how often we'd expect to see such a phenomenon.

These statistics are in fact so startling that NASA-GISS was moved to title their July 2010 Surface Temperature Analysis "July 2010-- What global warming looks like." The report notes the "statistical loading of the dice" produced by climate change:

"The location of extreme events in any particular month depends on specific weather patterns, which are unpredictable except on short time scales. The weather patterns next summer will be different than this year. It could be a cooler than average summer in Moscow in 2011.

But note in Figure 1, and similar maps for other months, that the area warmer than climatology already (with global warming of 0.55°C relative to 1951-1980) is noticeably larger than the area cooler than climatology. Also the magnitude of warm anomalies now usually exceeds the magnitude of cool anomalies.

What we can say is that global warming has an effect on the probability and intensity of extreme events. This is true for precipitation as well as temperature, because the amount of water vapor that the air carries is a strong function of temperature. So the frequency of extremely heavy rain and floods increases as global warming increases. But at times and places of drought, global warming can increase the extremity of temperature and associated events such as forest fires."

As usual, graphics help us understand the data better. We can see the situation in Russia clearly indicated:
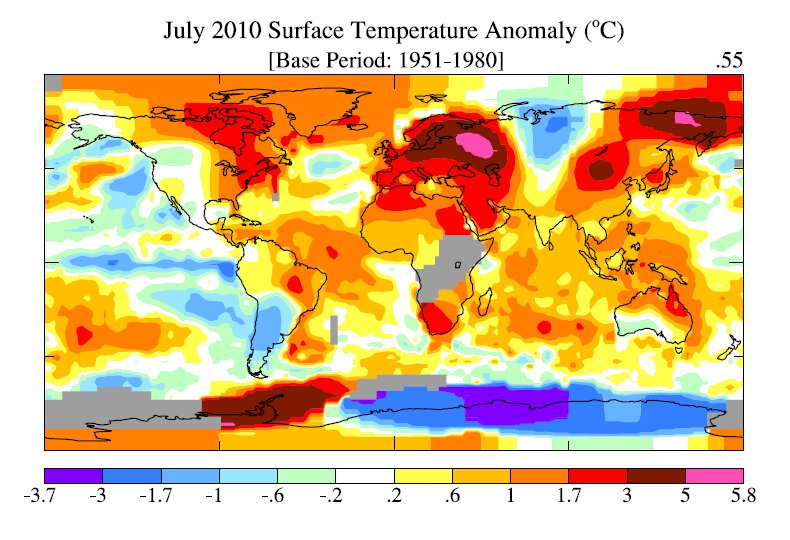
Figure 1 July 2010 NASA-GISS Surface Temperature Anomaly

As we can see from the following graph, the 12 month running mean temperature is at an all time high:
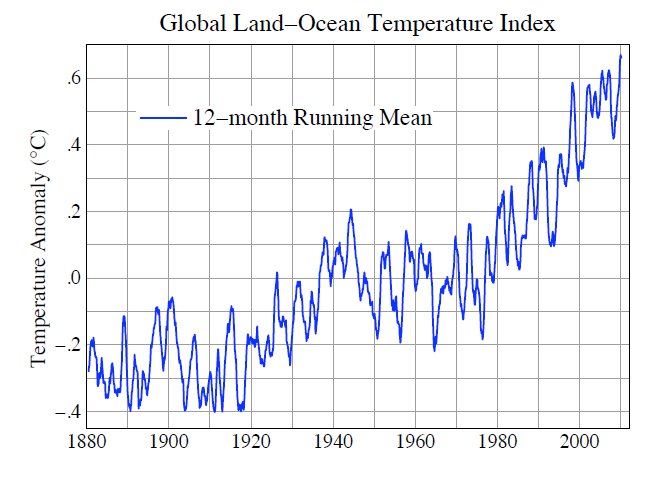
Figure 2 July 2010 NASA-GISS Surface Temperature Analysis

The World Meteorological Organization (WMO) looks at this year more from a weather perspective. In "Current Extreme Weather Sequence" the WMO takes note of the conspicuous nature of this year's weather in Russia:

"According to Roshydromet, the Russian Federal Service for Hydrometeorology and Environmental Monitoring, July 2010 is the warmest month ever in Moscow since the beginning of modern meteorological records, 130 years ago. Temperature has exceeded the long-term average by 7.8° C (compared to the previous record in July 1938 with 5.3° C above average). Record high temperatures varying between 35° C and 38.2° C were registered for more than 7 consecutive days end July, with the heatwave continuing into August. The daily temperature of 38.2° C on 29 July was the highest ever in Moscow (compared to a long-term average of approximately 23° C). The minimum temperature of nearly 25°C (recorded during the night before sunrise) also scored a significant increase compared to the historical average of about 14° C."

The WMO goes on to note events in Pakistan:

"The floods in Pakistan were caused by strong monsoon rains. According to the Pakistan Meteorological Department, the instant rain intensity reached 300 mm over a 36-hour period. The strong monsoon rains led to the highest water levels in 110 years in the Indus River in the northern part of the country, based on past records available from 1929. More areas in central and south Pakistan are affected by the floods. The death toll to date exceeds 1 600 and more than 6 million people have been displaced. Some reports indicate that 40 million citizens have been affected by the floods."

Similarly to NASA-GISS, while careful not to make a bald pronouncement about attribution of these events, neither does WMO avoid pointing out the congruence of unprecedented extreme weather with predictions from climate science:

"Several regions of the world are currently coping with severe weather-related events: flash floods and widespread flooding in large parts of Asia and parts of Central Europe while other regions are also affected: by heatwave and drought in Russian Federation, mudslides in China and severe droughts in sub-Saharan Africa. While a longer time range is required to establish whether an individual event is attributable to climate change, the sequence of current events matches IPCC projections of more frequent and more intense extreme weather events due to global warming. The Monsoon activity in Pakistan and other countries in South-East Asia is aggravated by the la Niña phenomenon, now well established in the Pacific Ocean"

The WMO has more to say on this in their update. It's conspicuous and of course admirable that neither NASA-GISS nor WMO attempt to say "Here's your proof of global warming." Equally it's important that both organizations continue to use their analytic resources to mark those occasions when observations coincide with predictions. 2010 has so far provided ample opportunities for such connections to be pointed out.

All of us live just a single human lifespan; nobody reading these words is likely to wake up 100 years from now and wax nostalgic for the way the weather used to be. As NASA-GISS' title implies, for those of us living in 2010 clusters of statistically extreme weather events are the best grip any of us as individuals will get on what global warming looks like.


0 0

Printable Version  |  Link to this page

Comments

Prev  1  2  3  4  Next

Comments 101 to 150 out of 153:

  1. Argus wrote : "I am very open for the addition of possible new local (state) records within the U.S. (I did write 'so far'.) I just didn't find any such records where I looked (www.infoplease.com). Way to go, Delaware and Rhode Island!" Did you miss this bit : The persistence of this pattern over the last several months has resulted in the warmest May-July on record for several east coast states from South Carolina to New Hampshire. Have a look at the rest of the NOAA report for July for more details, and to pick other months this year to find more possible records.
    0 0
  2. Argus if you dig into records you'll see that all-time high records were set pretty much across Russia from St. Petersburg to Siberia. Lots of media focus on Moscow, but the impact of the heat wave was much broader. Anyway, this is a "lost in the weeds" argument; persistently zeroing in on distractions about the proper comportment of how information is conveyed is suggestive of a wish or need to ignore a larger message.
    0 0
  3. Argus, I did not notice your post of your result. Once I see the data we can discuss it. Keep in mind that 17 all time high records have been set so far this summer. You are attempting to cast doubt on how hot it has been this summer by quibbling over a statistic. Look at figure 1 above and tell me where your doubt comes from. The GISS record is at an all time record high. I see no resonable room for doubt. As John often says, look at the whole picture.
    0 0
  4. Pete Ridley, you need to read a bit more widely on this site, especially Climate's changed before, It's just a natural cycle, and Humans are too insignificant to affect global climate With regard to ice ages, see this : Next Ice Age Delayed by Global Warming, Study Says
    0 0
  5. I am puzzled as to why my comment was removed but have modifeid it slightly and hope that it stays posted this time. Doug, “ .. if you dig into records you'll see that .. “ the world has experienced warming and cooling numerous times before and almost certainly will continue to do so. We have been coming out of an ice age for a few thousand years so it is bound to be warming up. It would have done this even if we had never found a use for oil or coal or gas. Changes to global climates have been going on since the beginning, as a result of natural (not human) processes and drivers. Global climates change drastically as a result of long periods of bitterly cold and pleasantly warm. We are presently in between these two extremes of global temperature conditions but have no idea for how long. Humans can exert no control over this on a global or even regional basis. All that we can hope to achieve is what we have always had to do, react to and protect against such changes as best we can. You say “ .. all-time high records were set pretty much across Russia from St. Petersburg to Siberia. ..” Since worthwhile temperature measurement only started in the 1700s it is difficult to accept that as gospel. The historical record tells us that there is nothing unusual about current weather events around the globe. According to the 2004 paper “Geography of Droughts and Food Problems in Russia (1900-2000)” (Note 1) by Golubev and Dronin, Department of Geography, Moscow State University, the “Numbers of years with droughts in the main economic regions of the Russian Federation in 1891-1983” are: - North West 21, - Central 29, - Central Chernozem 32, - Northern Caucasus 24, - Volga-Vyatka 32, - Volga 28, - Urals 28, - West Siberia 18 Joe Romm quotes from the Russian Met. Centre “There was nothing similar to this on the territory of Russia during the last one thousand years in regard to the heat.” (Note 2). The validity of that claim needs substantiation. I’m not aware that there was a mechanism for measuring heat as long ago as that. Can you advise on this? According to “Across the Nations .. the World’s Worsts Disasters” (Note 3), floods occurred in China in: - 1642 Flooding takes about 300,000 lives. - 1887 The Yellow River overflowed, causing the death of about 900,000 people. - 1911 Yangtze River flood - approx: 100,000 deaths. - 1931 A flood on the Changjiang River took at least 145,000 people - 1935 Another Yellow River flood "caused 27 counties inundated and 3.4 million victims". There is no reason to believe that the future will be any different, regardless of how much fossil fuel we continue to use. As for the two beautiful graphics in Joe Romm’s article comparing 2003 & 2010 (and the one above), I prefer this couple for 1936 and 2010 (Note 4). NOTES: 1) see http://www.usf.uni-kassel.de/ftp/dokumente/projekte/droughts_and_food_in_russia.pdf 2) see http://climateprogress.org/2010/08/09/russia-heat-wave-one-thousand-years-global-warming/ 3) see http://across.co.nz/WorldsWorstDisasters.html 4) see. http://www.c3headlines.com/2010/08/nasas-giss-moscow-is-burning-human-co2induced-unprecedented-global-warming-is-to-blame-not.html Best regards, Pete Ridley
    0 0
  6. Pete, historical temperature records have been broken in many places across the globe this year. Seizing on the omission of a qualifier in a single sentence in a blog comment does not change that fact. Past changes in climate or the notion that we are unable to modify the climate somehow gets us off the hook today are ill-founded ideas and do not affect physical facts today. Here are some places you can take those arguments if you wish to pursue them: What does past climate change tell us about global warming? Are humans too insignificant to affect global climate? In fact, the historical record does say this year is unusual and as well the past 10 years exhibit a notable statistical aberration in terms of extreme heat records. You can repeat over and over again that you don't believe so, but the numbers written in meteorological records will not change as a result. As to the statistical probability of Russia's heatwave, that's been looked at and of course it's possible to draw some conclusions. Here's a professional meteorologist's description of how it's done, using only the month of July as an example. Taking the whole pattern of this summer's weather over Russia into account, odds of such an occurrence lie somewhere between 1:1000 and 1:3000. See a treatment of the anomalous heat from June leading into August here.
    0 0
  7. Happily, Russia's heatwave is set to end today, after a final excursion reaching 93F. Less happily, Pakistan's trial by rain continues. See Jeff Masters' blog for details.
    0 0
  8. Pete Ridley - Your statement "Humans can exert no control over this on a global or even regional basis" is both very curious and quite unsupported. We're pumping 29 GT of CO2 into the atmosphere, with noticeable effects - global warming, ocean acidification, arctic melt, etc. Some of the mitigation proposals involve equally large inputs into the climate system. Dougs links are also relevant. Throwing up ones hands and saying "We can do nothing" is simply a call to inaction. Nonsense! Changing our CO2 output is possible at fairly small cost and possibly large reward ($$$ reward, aside from the obvious benefits of avoiding more drastic climate change). Pete, you've argued both "It's not happening" and "It's happening, there's nothing we can do". I find that quite contradictory... which is it?
    0 0
  9. As an aside - I agree with a previous poster (sorry I can't find it right now): It's very odd that some skeptics will say "We can adapt to whatever climate changes occur", and yet in the same breath say "It will destroy us to make the changes needed to reduce CO2 levels".
    0 0
  10. Now here's an interesting perspective on statistics, offered by climate scientist Steven Sherwood: The “loading the dice” analogy is becoming popular but it misses something very important: climate change also allows unprecedented (in human history) things to happen. It is more like painting an extra spot on each face of one of the dice, so that it goes from 2 to 7 instead of 1 to 6. This increases the odds of rolling 11 or 12, but also makes it possible to roll 13. What happens then? Since we have never had to cope with 13’s, this could prove far worse than simply loading the dice toward more 11’s and 12’s. I’m not sure whether or not what is happening in Russia or Pakistan is a “13″ yet, but 13’s will eventually arrive (and so will 14’s, if carbon emissions continue to rise). Via Andy Revkin
    0 0
  11. Models say less frequent but more intense rainfall. Weather statistics say: The River Niger - the third largest in Africa - reached its highest level for 80 years, said the regional river authority, the ABN. But the rains came too late to rescue this year's crops, which have already failed. "This year was a double whammy," Christy Collins of the aid agency Mercy Corps told the Associated Press news agency. In most years, even if the country's primary crop fail, at least the secondary crops survive, she explained. This year there was so little rain during the growing season that not only did the fields of millet not bloom, but the secondary greens used for animal fodder also failed. Not only are many villagers going short of food, but their livestock - their only asset - have died off. BBC "Niger hunger 'worse than 2005'" Wasn't somebody talking on this site about the putative beneficial effects of climate change on states on the southern border of the Sahara?
    0 0
  12. JMurphy, doug_bostrom, and michael sweet (101, 102, 103): Thank you for your responses! I have duly noted that 2010 is an exceptional year when it comes to heat records. 17 national records certainly sends a powerful message of how warm this year has been so far all over the earth, even after taking into account that the nations listed are very different in size (one has only 1/20000th of the area of one other, guess which ones!). I acknowledge the significance of these records as such (and also of the many 'almost-records'). I merely in my comments objected to the way of presenting singular records in various countries, in the form of a carefully calculated, exact portion of the earth's surface. That way of adding areas is misleading. Even if as much as a third or half of Russia's area has experienced heat records, only those areas should be added--not the whole of Russia. -- BUT I did also point out the adverse effect of counting whole nations: If any U.S. states, or parts of states, (or provinces of Sweden, cantons of Switzerland, etc.) have experienced heat records, the corresponding areas are not counted at all, because there is no new national record. If my criticism of the presentation method, summarized above, was interpreted as being "suggestive of a wish or need to ignore a larger message" (doug_bostrom), it is completely in the reader's mind. It was never my intention to wish anything of the sort. Thanks to JMurphy for pointing out the NOAA report for July! "You are attempting to cast doubt on how hot it has been this summer by quibbling over a statistic. ... I see no reasonable room for doubt.", writes michael sweet. Excuse me, but where exactly did I attempt to cast doubt? I certainly do not doubt that 2010 is an unusually warm year. I just questioned the way data were presented, and advocated a method of observing and adding smaller area units than nations. Sometimes AGW enthusiasts seem very touchy…
    0 0
  13. Doug, you opine that historical temperature records have been broken in many places across the globe this year. This opinion is shared by others in “Widespread changes in extreme temperatures have been observed in many regions of the world over the last 50 years; most notably the higher frequency of high-temperature days and nights and heat” (Note 1). Of course, those responsible for that report fall under the umbrella of that august body the UN, whose real agenda has nothing to do with trying to control the natural global climate change (which humans have never been able to do but have always had to adapt to). An opposing opinion has been expressed by someone who is much more expert than you or I in such weather events, Joseph D’Aleo, Fellow of the American Meteorological Society. In his article “Debunking the Claims Heat Waves are Becoming More Common” (Note 2) he starts by quoting the above then goes on to say “REALITY, there is no indication that record heat is increasing in frequency, in fact the data shows a precipitous decline in the number of heat records in recent decades. The early 20th century dominates the heat statistics for the United States and the world. The presumption that global heat waves and extremes have increased in frequency is not supported by the official government data. NOAA’s NCDC shows that record high temperature by continent have occurred mainly in the 1880s and early 1900s, with only 1 post 1950 (Antarctica in 1974)”. D’Aleo then goes on to provide evidence in support of his opinion. You also comment on the current flood disaster in Pakistan, reported in the Daily Telegraph as “ .. the worst in the UN's history: The United Nations has rated the floods in Pakistan as the greatest humanitarian crisis in recent history ..”. Supporters of The (significant human-made global climate change) Hypothesis appear to overlook the fact that severe floods and severe droughts are nothing new in Pakistan or elsewhere in Asia. Although in the media this was distorted to read as though it is the “.. worst in history .. ” what is conveniently overlooked is that Pakistan’s history didn’t start until 1947. Records of such catastrophic weather events in the area now known as Pakistan go back many centuries before the UN was established just 2 years prior to the creation of Pakistan.. Monsoons are essential for survival in Asian countries, providing them with their water for the whole year, even though they often bring extensive flooding. When the monsoons fail there is drought. The Rupee News article “History of floods in the Indus Valley of the 9000 year old Pakistani Civilization” (Note 3) has some very interesting information, including QUOTE: During a warm period 6,000 years ago, the Indus was a monster river, more powerful and more prone to flooding than today. Then, 4,000 years ago, as the climate cooled, a large part of it simply dried up. Deserts appeared whether mighty torrents once flowed. .. But what caused these thousand-year cycles of Indus drought and flood? .. Professor Martin Gibling of Dalhousie University in Halifax, Canada, a river expert who has worked in the region, thinks that changes in the strength of the monsoon caused by climate change may be to blame. .. So, will global warming have the reverse effect, returning the Indus to the monster river of 6,000 years ago? “That is the million-dollar question”, said Professor John Clague, from Simon Fraser University in Burnaby, Canada, an expert on the Asian monsoon. “There is huge uncertainty… and this is a matter of heated debate amongst scientists at present.” UNQUOTE. There’s a scientist using that word “uncertainty” again, but “huge” this time. Another point to bear in mind as far as the consequences of such flooding is concerned is the manner in which the Indus is being managed and the changes brought about by population growth QUOTE: .. Due to the population growth, the people are today living in the alluvial flood plains which used to left for the river to meander about. Today the river is changing its course and as it flows down, it engulfs many of the populated areas. 500 km of river bed’s floodzone is called “kacha”. This is the natural flood plain of the river. However today the “kacha area” is inhabited by millions of people. Those who live in the flood plain (kacha) are poor people who do not have the means to live in safe lands. .. Climate change may not be the only cause of Pakistan’s woes. There is also a sense that the current floods have been exacerbated by the way the Indus has been managed. .. “What we’ve done is apply a system from the West that just doesn’t work [in South Asia],” said Professor Sinha. That problem has been made worst by deforestation. Trees protect the headwaters from erosion. But over the past half century, more sediment has been flushed down the rivers as forests have been cut. .. UNQUOTE. It is speculative to suggest that the catastrophe caused by current floods (and droughts) around the globe are due to our use of fossil fuels. Have a read of the article and learn from it. KR, please would you be kind enough to point me to where I have said categorically of “global warming, ocean acidification, arctic melt, etc .. ” that "It's not happening". I’ll be happy to post a retraction if I have. I believe that I have always been “absolutely clear” (a popular politicians comment) that global warming (and cooling) and ice melting (and forming, whether Arctic, Antarctic or elsewhere) take place as natural occurrences. I’m also pretty sure that my comments about ocean acidification have simply expressed my preference for describing it as reducing alkalinity. Please note that I am posting the NOTES; separately as I think they may be the reason my comments get diverted into the “for moderation” folder.. Best regards, Pete Ridley
    0 0
  14. NOTES: (for my comment of 20th August @ 05:03) 1) see http://www.unisdr.org/eng/risk-reduction/climate-change/docs/Climate-Change-DRR.pdf 2) see http://icecap.us/images/uploads/HeatWaves_Icecap.doc 3) see http://rupeenews.com/2010/08/15/history-of-floods-in-the-indus-valley-of-the-9000-year-old-pakistani-civilization/
    0 0
  15. Pete Ridley - I've based my comments about global warming and "It's not happening" on your repeated and well expressed doubts about surface temperature records. I mentioned Icecap melt and acidification as supporting evidence for global warming - sorry if I was unclear. The temperature records are there, in multiple independent data sets (3 major ones), lots of different analyses, and they all show the same trends of ~0.13 to 0.16C / decade, most likely closer to 0.16.
    0 0
  16. Pete Ridley - You've added to the "It's not happening" statements you've made with this posting.
    0 0
  17. Pete, the reason your comments so often vanish is because you're apparently almost unable to make remarks on this topic without veering off into strange theories about conspiracies, to wit: Of course, those responsible for that report fall under the umbrella of that august body the UN, whose real agenda has nothing to do with trying to control the natural global climate change... That's a better job than usual; you've carefully calibrated your wording to fall just within moderation guidelines. Good tuning, congratulations! Meanwhile, elliptically referring to what I assume you believe is some plot by politicians does not actually serve as a refutation of meteorological records. Outlier skeptic D’Aleo is notably in disagreement not only with folks with a better grasp on this matter such as Meehl, but as well is disagreement with the AMO. Conflation of Pakistan's national history versus weather records transcending the history of Pakistan's split from India is pointless, rather silly and frankly desperate. I don't blame skeptics for becoming so creative because after all, they're faced with a very tough task in trying to minimize this year's weather. Mashing Pakistan's political history together with weather records and hoping nobody notices the continuum of record keeping spanning the rearrangement and creation of borders is one way of doing that. As to Pakistan and the monsoon, parts of the country have experienced rainfall equal to a year's precipitation in the course of 3 days. These records are from places where statistics of course record monsoons, so not only are they exceptional but the monsoon season is not an explanation. How about a straw poll, slightly off-topic. Does anybody care to weigh in on what Pete's implication about the UN references?
    0 0
  18. Meanwhile, leaving the edge-of-the-bell-curve world of Joseph D’Aleo and his counterfactual cohorts, we're yanked sharply back to emerging facts: Pakistan -- a Sad New Benchmark in Climate-Related Disasters Devastating flooding that has swamped one-fifth of Pakistan and left millions homeless is likely the worst natural disaster to date attributable to climate change, U.N. officials and climatologists are now openly saying. Most experts are still cautioning against tying any specific event directly to emissions of greenhouse gases. But scientists at the World Meteorological Organization (WMO) in Geneva say there's no doubt that higher Atlantic Ocean temperatures contributed to the disaster begun late last month. Atmospheric anomalies that led to the floods are also directly related to the same weather phenomena that a caused the record heat wave in Russia and flooding and mudslides in western China, said Ghassem Asrar, director of the World Climate Research Programme and WMO. And if the forecasts by the Intergovernmental Panel on Climate Change (IPCC) are correct, then Pakistan's misery is just a sign of more to come, said Asrar. "There's no doubt that clearly the climate change is contributing, a major contributing factor," Asrar said in an interview. "We cannot definitely use one case to kind of establish precedents, but there are a few facts that point towards climate change as having to do with this." There's also no doubt that the Pakistan flooding will join the ranks of the worst natural disasters in recorded history. ... During the most intense storms, about a foot of rain fell over a 36-hour period. Parts of the affected areas, in particular Khyber-Pakhtunkhwa province (formerly Northwest Frontier province) received 180 percent of the precipitation expected in a normal monsoon cycle. More rain is expected in the days ahead. Records show that the famed Indus River is at its highest water level ever recorded in the 110 years since regular record-keeping began. Estimates put the number of displaced people at somewhere between 15 million and 20 million, and the government believes about 1,600 are confirmed dead. More
    0 0
  19. Doug Bostrom : "How about a straw poll, slightly off-topic. Does anybody care to weigh in on what Pete's implication about the UN references? It's all part of that great big conspiracy, obviously ? The New World Order/Secret Government/Black Helicopters/Masons/Marxist-Leftist UN, who want to take over the world and tax us all to within an inch of our lives. Well, that's what that Monckton chap reckons and it seems that a few so-called skeptics take him at this word. No, seriously...
    0 0
  20. A natural disaster is generally only deemed such when two separate factors are bought together, a natural event, and an affected population. A natural event, even an extreme event, is in itself not a disaster, in fact in many cases it's effects may be all beneficial and necessary for the natural world. Whilst it may be debated whether or not humans are changing the weather, what is certain is that if infrastructure is built where it is in the natural path of where flood waters, high winds or fire pass in the normal course of events, then it is obvious that the two combined factors will result in a disaster of varying magnitude. I don't think that 300mm of rain in a 36 hour period is as an uncommon event as suggested. If it falls over the ocean it would be ridiculous to nominate it as a disaster. Cyclonic winds that originate at sea only become a disaster in they make landfall over a populated area, and there is now some thinking that such large populated areas do create conditions that "draws" such events towards them, but that is another story. Some of the biggest wildfires go virtually unknown because they burn unchecked in remote unpopulated areas, but when humans are attracted to settle in areas most prone to extreme fire conditions, the makings of a disaster are put in place irrespective of whether the climate changes or not. Traditionally humans populate the most fertile land first, and this is frequently land formed through alluvial deposits, river flats, flood plains and the like. Without any human built infrastructure the area is formed because the silt carried from other areas is dropped as the waters spread out and slow down. Any obstructions built in the path of the flow work the opposite causing the water to speed up and washing away the obstructions and exposed land, and thus what was previously a positive event becomes a disaster, not because nature has changed, but because of the presence of human habitation. The next phase of the current floods in Pakistan is that the vast reservoir of flood water will increase the amount of moisture evaporated that will then be carried and deposited somewhere to the east, bringing either a positive or negative to the next population that it might fall upon.
    0 0
  21. JohnD, are you paying attention? 300mm of rain didn't fall over the ocean, it fell where people live and have been accustomed for a very long time to that not happening. Maybe there really are such things as "denialists." It's a word I use very infrequently because I don't think it applies very well to most people; I don't like generalizations of that kind and our language is excellently suited for conveying nuance. JohnD, what do you think? Is there such a thing as a "denialist?"
    0 0
  22. doug_bostrom at 10:26 AM, what is the point you are trying to make? 1. 300 mm of rain in 36 hours has never before happened anywhere in the world at any time in recorded history, or 2. 300mm of rain in 36 hours only ever falls where it impacts adversely upon humans, or 3. if that occurs, the effects are worse if they have not been subjected to such an event for a very long time. The definition of denialist confines it's use to political debates, so you can continue to correctly use it with confidence in the political aspect of any debates you pursue. "denialist noun one who denies an assertion in a controversial political debate. usage note: This is usually used by those who make the assertion, or by those who implicitly hold the assertion to be true, of others. It is rarely used self-descriptively." http://www.allwords.com/word-denialist.html
    0 0
  23. The points are in the post up above, JohnD, and they're not really mine. Dither away about how many angels can dance on the head of a pin, it's of course your personal choice to do so. Meanhile, grownups will look after the mess. Pakistan floods 'slow-motion tsunami' - UN chief
    0 0
  24. Rain (from Wikipedia): Most in one minute: 38 millimetres (1.5 in); Barst, Guadeloupe, 1970-11-26. Most in 42 minutes: 300 millimetres (12 in) in 42 minutes. Holt, Missouri, USA. June 22, 1947 Most in 12 hours: 1,144 millimetres (45.0 in); Foc-Foc, La Réunion, January 8, 1966, during tropical cyclone Denise. Most in 24 hours: 1,825 millimetres (71.9 in); Foc-Foc, La Réunion, January 8, 1966 during tropical cyclone Denise. Most in 48 hours: 2,466 millimetres (97.1 in); Aurère, La Réunion, April 10, 1958. Most in 72 hours: 3,929 millimetres (154.7 in); Commerson, La Réunion, April 10, 1958 during Cyclone Gamede. Most in 15 days: 6,083 millimetres (239.5 in); Commerson, La Réunion, January 1980 during tropical cyclone Hyacinthe. Most in one year: 25.4 meters (1000 in); Cherrapunji, India. Highest average annual total: 13.3 meters (523.6 in); Lloro, Colombia. In the last 100+ years, U.K. has experienced 19 rainfalls with more than 200 mm of rain pouring down in 24 hours (also Wikipedia). The devastating effect of 300 mm in 36 hours in Pakistan comes because too many people live too close to a big and changing river. Also, man has made violent rains more dangerous all over the world, by deforestation.
    0 0
  25. Argus, you seem keen to lessen the impact of the recent rain on Pakistan for some reason. Is it, perhaps, their own fault for living too close to a river; or are there too many of them ? Whatever your reasons, and with regard to your list, perhaps you should try to differentiate between those countries which are more used to receiving a lot of rain (e.g. Cherrapunji, which is one of the wettest places on earth; the Choco Department in Columbian, where Lloro is, which is one of the wettest and most humid places on earth; Guadeloupe and Reunion, which annually receive 178cm and 154cm rain per year respectively - as compared to the UK, which we all consider to be a wet country and which receives an average of 59cm); and those countries like Pakistan (49cm per year, even with the monsoon) which aren't so used to these amounts in such a short space of time. (All these can be checked on Climate Temp) Perhaps Pakistan's total of 30cm in 36 hours IS quite unusual after all, eh ?
    0 0
  26. Argus at 21:12 PM, the perception of whether a natural event is extreme or not appears to be increasingly driven by the emotional impact it has on those who experience it first hand, or those who observe it from a distance. As you noted there are always other contributing factors which need to be taken into account so that the human tragedy and the natural event can each be kept in perspective. The connection that is trying to be made by the AGW proponents is that such disasters are due to global warming. If the total annual global rainfall can be demonstrated to actually increase, or decrease, as global temperatures increase, or decrease, then they may have the statistics needed to draw some such worthwhile conclusions. However trying to make a case for such an argument that is largely driven by the emotional impact of separate events rather than what occurs more broadly is hardly what one would expect from those who are supposedly more interested in the science than the politics. It's much the same with accident statistics, more attention is drawn to an accident that claims three lives than six accidents that each claim one life. At the end of the day, it is those who calmly compile and analyse all the statistics who are able to draw worthwhile conclusions, not those whose conclusions are drawn according to the emotional impact of any single event. The records that you posted certainly indicate just what is possible. It can also be assumed that such events impacted on local populations to varying degrees. However for the greater part of the planets surface there are no means to measure precipitation, nor any population to be effected if an extreme rain event occurs, therefore it requires a big leap of faith to draw overall conclusions based solely on what events make it onto front page news or into the record books.
    0 0
  27. johnd wrote : "However for the greater part of the planets surface there are no means to measure precipitation, nor any population to be effected if an extreme rain event occurs, therefore it requires a big leap of faith to draw overall conclusions based solely on what events make it onto front page news or into the record books." This sounds like another so-called skeptical tactic to wish-away inconvenient facts, the way that satellite temperature readings have suddenly fallen out of favour, due to their inconvenient parity to ground-based readings. However, do you feel there can possibly be any records that can possibly be trusted ? E.G. How can we determine the fastest man over 100m ? Someone running for the bus in South Africa, say, may be able to run faster. What about those rainfall records posted by Argus ? Should we ignore them because there might have been more and heavier/faster downpours over the sea, up a mountain or in a forest - unseen, of course. First man on the moon ? The Chinese may have got there first, on the dark side, but it was a disaster so they are keeping quiet. Can that be denied ? Can we be allowed to have any records for anything, do you think, or should we deny them all ?
    0 0
  28. JMurphy at 05:14 AM, it should be self evident, records are not the norm. Good to stir the emotions, and food for the politicians.
    0 0
  29. "AGW proponents." Comical. Some remarks about Pakistan by Dr. Ricky Rood here.
    0 0
  30. KR, ref. your comments at 05.22 and 05:51 on 20th, please stop distorting what I say. I know it’s a popular tactic with supporters of The (significant human-made global climate change) Hypothesis but it simply undermines your credibility when you can’t back up what you claim. Nowhere in that comment to which you link have I said that global warming, ice cap melting or ocean acidification isn’t happening. Even the comments of John O’Sullivan and Charles Anderson which I quote do not say that. What is said is quite different and is perfectly expressed in the final sentence of the final quote “It is now perfectly clear that there are no reliable worldwide temperature records and that we have little more than anecdotal information on the temperature history of the Earth. There is clearly no basis for the claims that the Earth has warmed at unusual rates in recent times or that we know anything more than some local temperatures, mostly from urban heat effect zones”. Doug, my response to your comment has been removed to I've posted on the new thread “Pakistan Flood: Many More Will Die .. ” Best regards, Pete ridley
    0 0
  31. Pete Ridley - I find the juxtaposition of your two statements, "Nowhere in that comment to which you link have I said that global warming, ice cap melting or ocean acidification isn’t happening" and in the same post "There is clearly no basis for the claims that the Earth has warmed at unusual rates in recent times...", clearly contradictory. No basis for claims that the Earth is warming at unusual rates? But not claiming that global warming isn't happening? I suspect I'm not the only person who sees a conflict there.
    0 0
  32. As a followup to my previous post - if the claim is that the earth is warming, but not at unusual rates, stating that there are no reliable temperature records doesn't disprove recent fast warming; it just removes surface temperature records from the list of supportable data. In which case we're back to other evidence: Arctic melting, TOA radiative differences, growth zone movement towards the poles and increasing length of growing seasons, the physics of IR absorption tied to the ~40% increase in CO2 concentration over the last 150 years, several thousand temperature proxies, etc. - all of which indicate recent warming at unusual rates.
    0 0
  33. Pete Ridley, others - As an additional note on this thread, which is also relevant to the Are surface temperature records reliable: I wrote this a while back on the topic of proof and disproof. You cannot disprove global warming by pointing out what you perceive as flaws in individual lines of evidence. That only impacts that line of evidence, not the theory. If you want to disprove global warming, you need solid, reproducible data contradictory to global warming - and I've seen nothing of the sort. If John O’Sullivan or Charles Anderson have something worth saying (I read their articles, and I haven't seen any evidence of that yet), they should write it up along with their data for a peer-reviewed publication. Not blogs.
    0 0
  34. KR, you are seeing a conflict that isn’t there. Between ice ages the globe warms and glaciers retreat then cools and glaciers advance. It’s happened before and will happen again. I repeat (but read the words carefully) “There is clearly no basis for the claims that the Earth has warmed at unusual rates in recent times...” most importantly those words “at unusual rates”. Best regards, Pete Ridley
    0 0
  35. Pete Ridley - there are multiple lines of evidence supporting the conclusion that the Earth is warming "at unusual rates". These include sea level rise, ocean heat content, the well supported surface temperature data, the satellite temperature record, growing seasons advancing faster than anything in the record, the paleo data on climate sensitivity to CO2, on and on and on. All of this evidence points in the same direction - "unusual rates" of temperature increase. Unless you can provide solid, repeatable, confirmable data contrary to this conclusion, or have invalidated all the mutually reinforcing evidence supporting AGW, you have not made your case.
    0 0
  36. And if you get CO2 higher than a certain value,(450? - pliocene level) then you wont get another ice age. Current rates of warming by any measure are an order of magnitude greater than warming within the ice age cycle.
    0 0
  37. Pete Ridley writes: Between ice ages the globe warms and glaciers retreat then cools and glaciers advance. It’s happened before and will happen again. Right. But you don't get a glacial/interglacial cycle of that magnitude based on Milankovich forcing alone without a CO2 feedback amplifying it.
    0 0
  38. Ned at 19:41 PM, re "without a CO2 feedback amplifying it." You also don't get major forcing based on CO2 without water vapour feedback amplifying it, the water vapour being the major factor. Can you show why the water vapour feedback would not occur without any initial CO2 forcing, instead responding directly to other initial forcings such as solar forcing.
    0 0
  39. johnd - You do get a water vapor feedback to the solar forcing at the end of a glacial era. It's just that with increasing CO2 forced from the oceans, raising the temperature over the solar forcing, you then get an additional water vapor feedback from that temperature increase.
    0 0
  40. KR at 04:49 AM, water vapour is produced when solar radiation warms the immediate surface of either the land or oceans, therefore it provides an immediate response to changes in solar radiation. However for CO2 to be released from the oceans the ocean waters have to increase in temperature, something that happens on a much longer time frame. Given the evaporation that produces water vapour transfers heat from the surface, creating a cooling effect, can you explain how it is not always the warming produced by the water vapour that leads to firstly more water vapour, and in turn even more water vapour before any CO2 at all is forced from the oceans. Would not the production of water vapour from the oceans surface have to cease before the ocean waters could warm at all?
    0 0
  41. johnd - I believe the CO2 time scale for deep warming of the ocean is covered in CO2 lags temperature. It's not an instant effect, and in fact appears to lag 800-1000 years behind an immediate solar forcing, while water vapor has a 5-10 day feedback time constant. But when the CO2 does rise, it induces an additional water vapor feedback. "Production of water vapor from the ocean" is a bit of a misnomer - vapor pressure is determined by temperature, and there's constant vaporization/condensation all the time. Changing temperatures just change the equilibrium point.
    0 0
  42. And why would you expect a one to one ratio? Nature seldom does that over thew short haul. Besides that, these records are for the last 100 years. Of course if you come up with couple warm decades you'll see high records fall. These records in a short time set, climatologically speaking. The longer you keep records the more likely you are to see it even out and records decrease in number.
    0 0
  43. Not to reignite the flames of controversy over whether 145 x 10^20 Joules per year of increased energy per year retained on Earth must certainly remain invisible to us but rather just to follow up on the original topic, here are are a couple of items looking back on this past summer, from NASA-GISS: 2010 — How Warm Was This Summer? How Warm Was Summer 2010?
    0 0
  44. Another statistical way of looking things: From CapitalClimate
    0 0
  45. From the WMO statement: "While a longer time range is required to establish whether an individual event is attributable to climate change, the sequence of current events matches IPCC projections of more frequent and more intense extreme weather events due to global warming." (I am posting here to keep from gumming up the 5 BS thread) A longer time range is not needed, only a better understanding of how natural patterns are influenced and changed (if at all) by AGW. The Russian heat wave was caused by blocking, while the IPCC does project more heat in various forms, it does not project more blocking patterns, those are mainly natural http://www.esrl.noaa.gov/psd/csi/moscow2010/ So the second part of the WMO statement above is too vague to be factual. The best explanation of causes of blocking are natural and solar/cosmic, such as reduced UV and/or more GCR. The link I posted should have delved into that a bit more, but is balanced enough as it is.
    0 0
  46. #145: Is this 'blocking' pattern a cause or an effect? From the esrl doc you linked, which is "evolving research assessment and not a final report," Dr. Hoerling can't seem to make up his mind: Whereas this phenomena has been principally related to a natural extreme event, its impacts may very well forebode the impact that a projected warming of surface temperatures could have by the end of the 21st Century due to greenhouse gas increases. I prefer this explanation without such equivocation, which came out a month after the 'blocking' note: Weather in a given region occurs in such a complex and unstable environment, driven by such a multitude of factors, that no single weather event can be pinned solely on climate change. In that sense, it's correct to say that the Moscow heat wave was not caused by climate change. However, if one frames the question slightly differently: "Would an event like the Moscow heat wave have occurred if carbon dioxide levels had remained at pre-industrial levels," the answer, Hansen asserts, is clear: "Almost certainly not." The frequency of extreme warm anomalies increases disproportionately as global temperature rises. "Were global temperature not increasing, the chance of an extreme heat wave such as the one Moscow experienced, though not impossible, would be small," Hansen says. -- emphasis added
    0 0
  47. Hansen is not correct in claiming "Almost certainly not". The probability of a sustained blocking pattern of the type we saw has nothing to do with CO2 levels. The length of the blocking event and the depth of atmospheric blocking points to weather changes originating in solar UV and perhaps solar magnetic. What changes with CO2 is some added heat in the heat wave, not the heat wave itself. There is plenty of evidence to back this up such as the negative NAO in summer http://www.cpc.noaa.gov/products/precip/CWlink/pna/nao.timeseries.gif While not a direct cause of that particular blocking, it is a cause of nearby blocking and is not correlated to CO2 or Arctic ice. Working backwards, negative NAO comes from ENSO, other weather and solar (e.g. UV)
    0 0
  48. Eric @147, I agree with some of what you say, but only to a point. Also, keep in mind that Hansen was trying to epxlain the situation to the public, not fellow scientists. Regardless, research by Stott et al. (2004) and others have demonstrated that: "Using a threshold for mean summer temperature that was exceeded in 2003, but in no other year since the start of the instrumental record in 1851, we estimate it is very likely (confidence level >90%) that human influence has at least doubled the risk of a heatwave exceeding this threshold magnitude." The science reported in the IPCC also states that it is "likely" (>66% probability) that heat waves have increased since 1950 and modelling studies expect more heat waves in the future. for more heat waves. Recent major heat waves in Europe, Russia, N. America and Australia and elsewhere are consistent with that. More in AR8 (8.2.1.1).
    0 0
  49. #147: "a sustained blocking pattern of the type we saw has nothing to do with CO2 levels" A quick search of 'Russian heat wave 2010' shows how this immediately became the darling of the deniersphere. One-liners snipped from the Hoerling report you cited were repeated verbatim, with the usual smug 'See, it's not warming that's making it so warm'. The same 'blocking' gave us the Pakistan floods. Not one of these cherry-handed oafs asked the essential question posed in #146: Is this 'blocking' a cause or an effect? Here's Jeff Masters' take: Long-lived "blocking" episodes like this are usually caused by unusual sea surface temperature patterns, according to recent research done using climate models. For example, Feudale and Shukla (2010) found that during the summer of 2003, exceptionally high sea surface temperatures of 4°C (7°F) above average over the Mediterranean Sea, combined with unusually warm SSTs in the northern portion of the North Atlantic Ocean near the Arctic, combined to shift the jet stream to the north over Western Europe and create the heat wave of 2003. I expect that the current SST pattern over the ocean regions surrounding Europe played a key role in shifting the jet stream to create the heat wave of 2010. From Feudale and Shukla 2010 The results suggest that the SST anomalies had an additional effect of reducing the baroclinicity in the European area reinforcing the blocking circulation and helping to create ideal conditions for the establishment of the heat wave. So rather than add to the firestorm of repetition, look to causes and ask: What caused the increased SSTs that led to the summers of 2003 and 2010 and is highly likely to cause an increasing frequency of these events in years to come? "weather changes originating in solar UV and perhaps solar magnetic." Any evidence for those easily-detectable phenomena? We have satellites keeping their UV eyeballs on the sun. Interestingly, the deniersphere fixated on an anomalous jetstream as their cause for these heat waves, yet the disturbed jetstream cannot possibly be the cause for this winter's early snow. That's labeled as 'climate astrology'. An example of extreme hypocrisy in action. The deniers cling to whatever idea-of-the-day appeals to them, are blind to the over-arching patterns and are incapable of seeing that events must have causes.
    0 0
  50. Albatross, the explanation to the public should include possibilities and suggest likelihoods, but then should include all possibilities including the natural causes. I would also be careful about using model runs to derive a standard deviation to use to suggest a probability of an event. There are a lot of input parameter probability distributions and internal model relationships that control the probabilities of those events that need to be calibrated and/or validated. Muoncounter, in your original post I didn't answer whether SST anomalies are a cause or an effect. The first part of the answer is that the anomaly itself is not the issue, it the absolute temperature that matters. Temperature causes things, not delta T. The second part is that throughout history and the instrument record, blocking events have occurred with natural causes. Putting those two together, we get the possibility that natural factors cause the overall stratospheric cooling most often associated with blocking but the specific positioning of the resulting jet stream is determined through terrestrial factors including SST. After that, SST becomes another effect like any other. The UV connection to blocking is an inverse relation, with less UV creating the possibility of more blocking as represented by negative NAO. UV is both measured and reconstructed such as here: http://www.mps.mpg.de/homes/natalie/PAPERS/jasr-haberreiter.pdf and comparing their graph of solar UV to my link in 147, we see more positive NAO with higher UV and more negative NAO with lower UV. The relationship is crude which means terrestrial factors are involved.
    0 0

Prev  1  2  3  4  Next

You need to be logged in to post a comment. Login via the left margin or if you're new, register here.


The Consensus Project Website

THE ESCALATOR

(free to republish)


© Copyright 2024 John Cook
Home | Translations | About Us | Privacy | Contact Us