Climate Science Glossary

Term Lookup

Enter a term in the search box to find its definition.

Settings

Use the controls in the far right panel to increase or decrease the number of terms automatically displayed (or to completely turn that feature off).

Term Lookup

Settings


All IPCC definitions taken from Climate Change 2007: The Physical Science Basis. Working Group I Contribution to the Fourth Assessment Report of the Intergovernmental Panel on Climate Change, Annex I, Glossary, pp. 941-954. Cambridge University Press.

Home Arguments Software Resources Comments The Consensus Project Translations About Support

Bluesky Facebook LinkedIn Mastodon MeWe

Twitter YouTube RSS Posts RSS Comments Email Subscribe


Climate's changed before
It's the sun
It's not bad
There is no consensus
It's cooling
Models are unreliable
Temp record is unreliable
Animals and plants can adapt
It hasn't warmed since 1998
Antarctica is gaining ice
View All Arguments...


Username
Password
New? Register here
Forgot your password?

Latest Posts

Archives

How we know the sun isn't causing global warming

Posted on 9 September 2010 by dana1981

The Sun's largest influence on the Earth's surface temperature is through incoming solar radiation, also known as total solar irradiance (TSI).  Changes in TSI can be converted into a radiative forcing, which tells us the energy imbalance it causes on Earth.  This energy imbalance is what causes a global temperature change.

The solar radiative forcing is TSI in Watts per square meter (W-m-2) divided by 4 to account for spherical geometry, and multiplied by 0.7 to account for planetary albedo (Meehl 2002).  The albedo factor is due to the fact that the planet reflects approximately 30% of the incoming solar radiation.

dF = 0.7 * d(TSI)/4

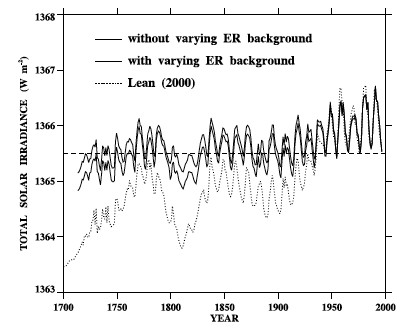
This is a very straightforward and easy to understand formula - the larger the change in solar irradiance, the larger the energy imbalance it causes, and thus the larger the radiative forcing.  Studies have reconstructed TSI over the past 300 years.  Wang, Lean, and Sheeley (2005) compared a flux transport model with geomagnetic activity and cosmogenic isotope records and to derive a reconstruction of TSI since 1713.
Wang 2005

Figure 1: Total Solar Irradiance from 1713 to 1996 (Wang 2005)

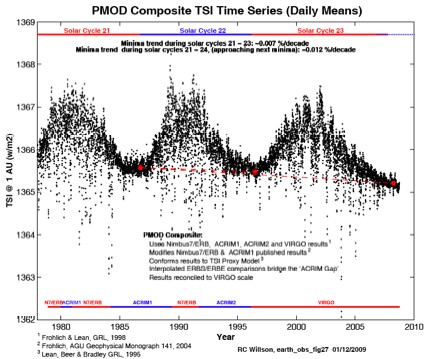
Satellites have directly measured TSI since 1978.
PMOD TSI

Figure 2: Total Solar Irradiance as measured by satellite from 1978 to 2010

As you can see, over the past 32 years, TSI has remained unchanged on average.  In the early 20th century, from about 1900 to 1950 there was an increase in TSI from about 1365.5 to 1366 W-m-2.  The change in global temperature in response to a radiative forcing is:

dT = ?*dF 

Where 'dT' is the change in the Earth's average surface temperature, '?' is the climate sensitivity, usually with units in Kelvin or degrees Celsius per Watts per square meter (°C/[W-m-2]), and 'dF' is the radiative forcing.

So now to calculate the change in temperature, we just need to know the climate sensitivity. Studies have given a possible range of values of 2 to 4.5°C warming for a doubling of CO2 (IPCC 2007), which corresponds to a range of 0.54 to 1.2°C/(W-m-2) for ?.  We can then calculate the change in global temperature caused by the increase in TSI since 1900 using the formulas above.  Although Wang, Lean, and Sheeley's reconstruction puts the change in TSI since 1900 at about 0.5 W-m-2, previous studies have shown a larger change, so we'll estimate the change in TSI at 0.5 to 2 W-m-2.

dF = 0.7 * d(TSI)/4  = 0.7*([0.5 to 2 W-m-2]/4) = 0.1 to 0.35 W-m-2

This matches up well with the IPCC solar forcing range of 0.06 to 0.30 W-m-2, with a most likely value of 0.12 W-m-2.  We can then calculate the associated surface temperature change:

dT = ?*dF = (0.1 to 0.35 W-m-2)*(0.54 to 1.2°C/[W-m-2]) = 0.05 to 0.4°C, with a most likely value of 0.15°C.

We can confirm this by comparing the calculation to empirical observations.  From 1900 to 1950 the Earth's surface temperature warmed by approximately 0.4°C.  Over that period, humans increased the amount of carbon dioxide in the atmosphere by about 15 parts per million by volume (ppmv), from approximately 295 to 310 ppmv.  This corresponds to an anthropogenic warming of:

dT = ?*dF = 5.35*(0.54 to 1.2°C/[W-m-2]*ln(310/295) = 0.14 to 0.32°C with a most likely value of 0.22°C.

Therefore, the solar forcing combined with the anthropogenic CO2 forcing and other minor forcings (such as decreased volcanic activity) can account for the 0.4°C warming in the early 20th century, with the solar forcing accounting for about 40% of the total warming.  Over the past century, this increase in TSI is responsible for about 15-20% of global warming (Meehl 2004).  But since TSI hasn't increased in at least the past 32 years (and more like 60 years, based on reconstructions), the Sun is not directly responsible for the warming over that period.

Indirect Solar Effects

Ultraviolet Radiation

It has also been proposed that ultraviolet (UV) radiation, which varies more than other solar irradiance wavelengths, could amplify the solar influence on the global climate through interactions with the stratosphere and atmospheric ozone.  Shindell et al. (1999) examined this possibility, but found that while this UV variability has a significant influence over regional temperatures, it has little effect on global surface temperatures.

"Solar cycle variability may therefore play a significant role in regional surface temperatures, even though its influence on the global mean surface temperature is small (0.07 K for December–February)."

Moreover, Shindell et al. found that anthropogenic ozone depletion (via chlorofluorocarbon emissions) may have reduced the impact of UV variability on the climate, and may have even offset it entirely.

"Another consideration is that upper stratospheric ozone has decreased significantly since the 1970s as a result of destruction by halogens released from chlorofluorocarbons.  This ozone decrease, which has been much larger than the modeled solar-induced ozone increases, may have limited the ability of solar irradiance changes to affect climate over recent decades, or may have even offset those effects."

Galactic cosmic rays

Henrik Svensmark has proposed that galactic cosmic rays (GCRs) could exert significant influence over global temperatures (Svensmark 1998).  The theory goes that the solar magnetic field deflects GCRs, which are capable of seeding cloud formation on Earth.  So if solar magnetic field were to increase, fewer GCRs would reach Earth, seeding fewer low-level clouds, which are strongly reflective.  So an increased solar magnetic field can indirectly decrease the Earth's albedo (reflectivity), thus causing the planet to warm.  Thus in order for this theory to be plausible,

  1. Solar magnetic field must have a long-term positive trend.
  2. Galactic cosmic ray flux on Earth must have a long-term negative trend.
  3. Cosmic rays must successfully seed low-level clouds.
  4. Low-level cloud cover must have a long-term negative trend.

Fortunately we have empirical observations with which to test these requirements.

Solar magnetic field

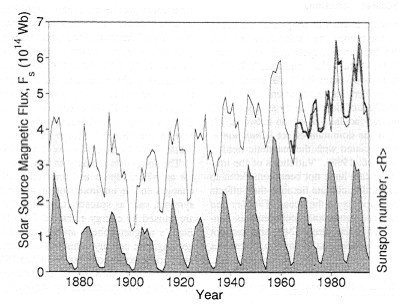
Solar magnetic field strength correlates strongly with other solar activity, such as TSI and sunspot number.  As is the case with these other solar attributes, solar magnetic field has not changed appreciably over the past three decades (Lockwood 2001).
Lockwood 2001 

Figure 3: Solar Magnetic Flux from 1850 to 2001

Galactic Cosmic Ray Flux

Cosmic ray flux on Earth has been monitored since the mid-20th century, and has shown no significant trend over that period.

cosmic ray flux

Figure 4: Cosmic Ray Intensity (blue) and Sunspot Number (green) from 1951 to 2006 (University of New Hampshire)

GCR Cloud Seeding

Numerous studies have investigated the effectiveness of GCRs in cloud formation.  Kazil et al. (2006) found:

"the variation of ionization by galactic cosmic rays over the decadal solar cycle does not entail a response...that would explain observed variations in global cloud cover"

Sloan and Wolfendale (2008) found:

"we estimate that less than 23%, at the 95% confidence level, of the 11-year cycle changes in the globally averaged cloud cover observed in solar cycle 22 is due to the change in the rate of ionization from the solar modulation of cosmic rays."

Kristjansson et al. (2008) found:

"no statistically significant correlations were found between any of the four cloud parameters and GCR"

Calogovic et al. (2010) found:

"no response of global cloud cover to Forbush decreases at any altitude and latitude."

Kulmala et al. (2010) also found

"galactic cosmic rays appear to play a minor role for atmospheric aerosol formation events, and so for the connected aerosol-climate effects as well."

Low-Level Cloud Cover

Unfortunately observational low-level cloud cover data is somewhat lacking and even yields contradictory results.  Norris et al. (2007) found

"Global mean time series of surface- and satellite-observed low-level and total cloud cover exhibit very large discrepancies, however, implying that artifacts exist in one or both data sets....The surface-observed low-level cloud cover time series averaged over the global ocean appears suspicious because it reports a very large 5%-sky-cover increase between 1952 and 1997. Unless low-level cloud albedo substantially decreased during this time period, the reduced solar absorption caused by the reported enhancement of cloud cover would have resulted in cooling of the climate system that is inconsistent with the observed temperature record."

So the jury is still out regarding whether or not there's a long-term trend in low-level cloud cover.

Inability to explain other observations

In addition to these multiple lines of empirical evidence which contradict the GCR warming theory, the galactic cosmic ray theory cannot easily explain the cooling of the upper atmosphere, greater warming at night, or greater warming at higher latitudes.  These are fingerprints of the increased greenhouse effect, the major mechanism of anthropogenic global warming.

Dansgaard-Oeschger Events

Some individuals, most notably Fred Singer, have argued that Dansgaard-Oeschger (D-O) events could be causing the current global warming.  D-O events are rapid climate fluctuations that occur quasi-periodically with a 1,470-year recurrance time and which, according to Singer, are "likely caused by the sun."  However, there is significant debate as to the cause of these D-O events, with changes in solar output being just one possibility (NOAA Paleoclimatology).

Regardless, the most obvious flaw in this argument is that the planet wasn't warming 1,470 years ago.  The previous warm event was the Medieval Warm Period approximately 1,000 years ago.

Figure 5: Global temperature reconstructions over the past 2,000 years (Globalwarmingart)

Bond et al. (1999) added further evidence that the timing of D-O events disqualifies them from being responsible for the current warming, by showing that the most recent D-O event may have contributed to the Little Ice Age (LIA):

"evidence from cores near Newfoundland confirms previous suggestions that the Little lce Age was the most recent cold phase of the 1-2kyr cycle"

And a study by Rahmstorf (2003) also concludes that the LIA may be the most recent cold phase of the D-O cycle, and his research suggests that the 1,470-year periodicity is so regular that it's more likely due to an orbital cycle than a solar cycle.

"While the earlier estimate of ±20% [Schulz, 2002] is consistent with a solar cycle (the 11-year sunspot cycle varies in period by ±14%), a much higher precision would point more to an orbital cycle. The closest cycle known so far is a lunar cycle of 1,800 years [De Rop, 1971], which cannot be reconciled with the 1,470-year pacing found in the Greenland data. The origin of this regular pacing thus remains a mystery."

However, according to Braun et al. (2005), D-O events could be caused by a combination of solar cycles and freshwater input into the North Atlantic Ocean.  But their study also concludes that D-O events are not expected to occur during the Holocene (the current geologic epoch).

"the 1,470-year climate response in the simulation is restricted to glacial climate and cannot be excited for substantially different (such as Holocene) boundary conditions...Thus, our mechanism for the glacial ,1,470-year climate cycle is also consistent with the lack of a clear and pronounced 1,470-year cycle in Holocene climate archives."

The bottom line is that regardless of whether or not the D-O cycles are triggered by the Sun, the timing is clearly not right for this cycle to be responsible for the current warming.  Particularly since solar output has not increased in approximately 60 years, and has only increased a fraction of a percent in the past 300 years, as discussed above.

Ironically, prior to publishing a book in 2007 which blamed the current warming on D-O cycles, Singer argued that the planet wasn't warming as recently as 2003.  So the planet isn't warming, but it's warming due to the D-O cycles?  It's quite clear that in reality, neither of these contradictory arguments is even remotely correct.

Inability to explain empirical observations

Aside from the fact that solar effects cannot physically explain the recent global warming, as with GCRs, there are several empirical observations which solar warming could not account for.  For example, if global warming were due to increased solar output, we would expect to see all layers of the atmosphere warm, and more warming during the day when the surface is bombarded with solar radiation than at night.  Instead we observe a cooling of the upper atmosphere and greater warming at night, which are fingerprints of the increased greenhouse effect.

It's not the Sun

As illustrated above, neither direct nor indirect solar influences can explain a significant amount of the global warming over the past century, and certainly not over the past 30 years.  As Ray Pierrehumbert said about solar warming,

“That’s a coffin with so many nails in it already that the hard part is finding a place to hammer in a new one.”

This post is the Advanced version (written by dana1981) of the skeptic argument "It's the sun". There is also a basic version.

0 0

Printable Version  |  Link to this page

Comments

Prev  1  2  

Comments 51 to 58 out of 58:

  1. Ken, I do not have any number by myself but I do know that those calculations do not consider the net clouds effect. More specifically, clouds block outgoing IR radiation too and emit (and reflect) electromagnetic waves differently depending on the type of cloud and altitude. Any discussion on the energy balance has to consider all these terms. I find those trivial calculations almost completely meaningless.
    0 0
  2. Given the rapid changes in science - the influence of the Sun on the climate (especially) - should be based on the latest studies. The latest textbook (110 pages!) describing the impact of the sun on climate, is: Solar Influences on Climate, L.J. Gray, J. Beer, M. Geller, J.D. Haigh, M. Lockwood, K. Matthes ,U. Cubasch, D. Fleitmann, G. Harrison, L. Hood, J. Luterbacher, G. A. Meehl, D. Shindell, B. van Geel, W. White (Reviews in Geophysics, 2010). There are, admittedly, such a sentence: “... indicate that solar forcing is playing at most a weak role in current global temperature trends (Lockwood and Fröhlich, 2007).” In his earlier work (Solar change and climate: an update in the light of the current, 2010) Lockwood also writes: “It is important not to make the mistake made by Lord Kelvin and argue that there can be no influence of solar variability on climate: indeed, its study is of scientific interest and may well further our understanding of climate behaviour. However, the popular idea (at least on the Internet and in some parts of the media) that solar changes are some kind of alternative to GHG forcing in explaining the rise in surface temperatures has no credibility with ALMOST ALL climate scientists.”. At the same time defines the problem: “From the GMAST record, we know that we need to explain _TS of +0.8K since pre-industrial times, around a mean value of 287.4 K. This makes the left-hand side of equation (10.1) equal to 4.30 + 0.85=5.15Wm−2 (adopting 0.85Wm−2 for the current value of γ and assuming that Earth was in radiative equilibrium in pre-industrial times). In §2, we discussed how observed GHG changes give a total radiative forcing (contribution to _G) of 2.45Wm−2. Thus feedback loops, through their net contribution to the _A and _G terms, are required to supply a further 2.46Wm−2. In other words, the feedback must essentially double the GHG forcing if they are the cause of the GMAST rise. On the other hand, our best estimate of the first term on the right-hand side of equation (10.1) is 0.23Wm−2 (_ITS =1.3Wm−2). If the analysis of Scafetta (2009) were correct and 65 per cent of the observed warming were due to solar effects, then the first term on the right-hand side of equation (10.1) plus the feedback would need to supply 0.65 × 5.15=3.35Wm−2.” Returning to the "Solar Influences on Climate ', where he co-authored by Lockwood, we find such attempts to solve this problem: „A value of 0.24 Wm-2 solar radiative forcing difference from Maunder Minimum to the present is currently considered to be more appropriate than the 0.12 Wm-2 estimated by IPCC (c.f. the range of 0.16-0.28 Wm-2 ...)” “Periodicities, trends, and grand minima are features of solar activity which, if detectable in climate records, can be used to attribute climate changes to solar forcing (Beer et al. 2000; Beer and van Geel, 2008). However, one must be aware that this may not always work well because there are other forcings as well and the climate is a non-linear system which can react in a variety of ways.” “... other forcings ...” and: “There are additional uncertainties in estimates of solar radiative forcing which also require further consideration.” ... eg: “... there could be effects of magnetic fields deeper in the convection zone, the so-called ‘shadow effects’ and there may small solar radius changes (Lockwood, 2010). The SATIRE modelling has shown that surface emissivity effects explain recent solar cycles in TSI rather well, and these shadow (and solar radius) effects are not significant effects over the past 30 years or so. However, this does not eliminate them as factors on longer timescales.” “Nevertheless, using short-term (3-hourly) ISSCP data, high-pass filtered to remove long term trends, a positive correlation between low cloud and GCR is still evident, indicating a 3% cloud variation (Brown, 2008).” “With the greater spatial and spectral resolution available in the MODIS satellite data, Kristjánsson et al. (2008) found only weak negative correlations between GCR and cloud properties during Forbush events, except for the eastern Atlantic Ocean region in which both the negative correlations between GCR and cloud, and between GCR and cloud thickness were statistically significant.” ... although it is true that: “... no significant effect of cosmic rays on low cloud cover could be found (Calogovic et al. 2010).” ... however: Solar modulation in surface atmospheric electricity, Harrison & Usoskin, 2009.: „Both the lower troposphere atmospheric electricity quantities are significantly increased at cosmic ray maximum (solar minimum), with a proportional change greater than that of the cosmic ray change.”
    0 0
  3. Riccardo #51 and Andreas #52 My unanswered post in **"What caused early 20th century warming"** is revised here and I think a non-trivial calculation Riccardo. All the 'anthropogenic forcings' in Fig 2.4 IPCC AR4 and repeated by Dr Trenberth's famous paper in Figure 4, are relative to a baseline of 'zero' in AD1750. The +0.12W/sq.m for 'natural' Solar forcing is baselined to what? Was it zero in AD1750? If it was not or we don't know; then it should not be added and subtracted from the AG forcings based on 'zero' in AD 1750. Figure 1 from **cited** thread (1713-1996) seems to suggest a baseline TSI at 1365.5W/sq.m, but who is to suggest that the solar forcing was 'zero' in AD1713 given the complex orbital cycles which vary the Earth's exposure to the sun over interglacial time scales. Is 1365.5W/sq.m the 'zero' baseline where the Earth system is neither warming nor cooling in the absence of human induced post-industrial forcings?? The critical point is that the energy accumulation of the Earth system does not necessarily stop when the TSI is flat. This energy is the integral of a constant unbalanced 'forcing' in W/sq.m wrt time represented by the area under the forcing curve which rises linearly with time elapsed. A constant 0.12W/sq.m forcing over one year is 20E20 Joules, which over a century is 2000E20 Joules. 5-6E20 Joules/year covers all the arctic ice melt, land ice melt and land heating (according to Dr Trenberth). So if for example the Earth was warming in AD1713 at a small Solar forcing of say 0.06W/sq.m (half the current IPCC Solar forcing number), and we assume the same shape of the TSI curve since then is offset by an extra 0.06 x 4 /0.7 = 0.34W/sq.m then that would add an extra 10E20 Joules/year to the Earth system for nearly 300 years which is an extra 3000E20 Joules - a big number - most of which must go into OHC. Andreas suggests that the unbalanced forcing was more like 0.24W/sq.m referenced from the Maunder Minimum which would add 40E20 Joules/year for roughly 300 years from AD1715 - which is 12000E20 Joules. Given Dr Trenberth's claimed current warming imbalance from AG and Solar forcings is 145E20 Joules/year, 12000E20 Joules equals 83 years warming at the current rate and much longer at reduced rates averaged over the last 50-100 years. If something like 90% of 12000E20 Joules were sequestered in the oceans over 300 years by the known processes of heat transfer and upper layer circulation, with exhanges released to the atmosphere via complex events like ENSO, La Nina and AMO - I suggest it is entirely feasible for a large portion of observed warming to be accounted for by long term Solar imbalance since the LIA.
    0 0
  4. Ken Lambert, my point was only on a change in albedo due to an increase in cloudiness. Just to say that we need to consider all the effects produced by a given change.
    0 0
  5. Let's go back to reading the textbook: “Solar Influences on Climate”: “As in the ozone analysis, the lower stratospheric temperature response is indicative of a large-scale dynamical response, e.g. changes in net equatorial upwelling rates (Shibata and Kodera 2005; Gray et al. 2009).” “... the majority of climate models employed to date ... ... represent primarily the ‘bottom-up’ TSI mechanism and have a very poor, or no, representation of the ‘top-down’ mechanism that requires spectral variations in solar radiative input and ozone feedback effects. Only a few have an adequate representation of the stratosphere and even those do not generate a complete representation of stratospheric effects such as an internally consistent quasi biennial oscillation. Some of the models employed for future IPCC assessments are planned to incorporate these processes, and thus should be better placed to assess the importance of these effects.” “Thus a precise determination of solar RF depends on the response of stratospheric temperatures and ozone to the changes in solar irradiance. These are not well established (see section 3.1) so that published estimates of the ozone amplification of direct TSI forcing show a very wide range (Haigh 2007; Gray et al. 2009) with even THE SIGN of the effect remaining uncertain.” “Modulation of ENSO by solar forcing appears to be consistent with at least some paleo-climate evidence, especially for the Americas where multiple proxies such as fire scars, lake varves (stratified deposits of glacial clay), tree rings, etc. indicate correlations between precipitation and solar irradiance that are similar to ENSO-related precipitation anomalies (Graham et al. 2007). As discussed in section 3.2.2, a mechanism of coupled atmosphere-ocean response to solar forcing in the tropical Pacific has been proposed (e.g. Meehl et al., 2003, 2008). Additionally, the UV/ozone feedback mechanism appears to cause enough heating near the tropical tropopause to significantly affect the tropical hydrologic cycle, with regional impacts on precipitation that are also broadly similar to those related to ENSO changes (Shindell et al., 2006). Thus the two mechanisms may operate together to create the tropical/subtropical response to solar forcing with associated amplifying cloud feedbacks (Meehl et al., 2009).” ... so even though that: “The PMOD TSI data have fallen to unprecedentedly low levels during the current solar minimum, although estimates vary on the magnitude of this decline (Lockwood, 2010).The mean of the PMOD TSI composite for September 2008 is 1365.1 Wm-2, which is lower than that for the previous minimum by more than 0.5 Wm-2. [back to the level of 1924]” ... “Note, however, that if the recent SORCE/SIM measurements of spectrally resolved solar irradiance (discussed in section 2.2.2) are correct then solar radiative forcing at the tropopause would vary out of phase with tsi. In this case, assessments of solar influence on climate, at least over the 11-yr cycle and possibly on the longer term, would need to be ENTIRELY REVISITED(Haigh et al. 2010).” “Recent measurements of SSI by the SORCE/SIM satellite instrument suggest that variations in the UV may be much larger, by a factor of 4-6, than previously assumed (Harder et al. 2009). If correct, this would imply a very different response in both stratospheric ozone and temperature (Haigh et al. 2010 ...).” Although many questions (!), the title “proudly” proclaims: “ ... the sun isn't causing global warming” I would - though for decency - as he Svalgaard - "?" here: (No?) Century-scale Secular Variation in HMF, EUV, or TSI, (2007.)
    0 0
  6. „... the D-O cycle ...” Rahmstorf said, however, that the 1470 +/- 500 years change, corresponds to the Sun - “We conclude that the glacial 1,470-year climate cycles could have been triggered by solar forcing despite the absence of a 1,470-year solar cycle.” Keeling & Whorf, The 1,800-Year Oceanic Tidal Cycle: A Possible Cause of Rapid Climate Change, 2000, (what's interesting is not quoted by Rahmstorf et al. 2003) writes: “We propose that such abrupt millennial changes, seen in ice and sedimentary core records, were produced in part by well characterized, almost periodic variations in the strength of the global oceanic tide-raising forces caused by resonances in the periodic motions of the earth and moon. A well defined 1,800-year tidal cycle is associated with gradually shifting lunar declination from one episode of maximum tidal forcing on the centennial time-scale to the next. An amplitude modulation of this cycle occurs with an average period of about 5,000 years, associated with gradually shifting separation-intervals between perihelion and syzygy at maxima of the 1,800-year cycle. We propose that strong tidal forcing causes cooling at the sea surface by increasing vertical mixing in the oceans. On the millennial time-scale, this tidal hypothesis is supported by findings, from sedimentary records of ice-rafting debris, that ocean waters cooled close to the times predicted for strong tidal forcing.” Solar cycle counting 2300 years and lunar cycle of 1.800 years. Both cycles are shifted against each other for 500 years. On the "lunar tidal" the Sun has a significant impact. Chaos and Intermittency in the Solar Cycle, Spiegel, 2009.: “We have revealed specific patterns in the magnetic activity between successive grand minima which tend to recur approximately every 2300 yr but occasionally alternate with irregular changes. Such intermittent activity behavior indicates low dimensional chaos in the solar dynamo due to the interplay of its dominant modes. The analysis showed that in order to forecast activity level in forthcoming cycles, one should take into account long-term changes in sunspot activity on a ≈2300-yr timescale. “ Obecne Bond Events mogą wynikać z rezonansu stochastycznego D-O (the inertia of the system - despite the lack of direct impact - a cycle of loading), or - more likely - with the cycles interaction - magnetic and gravity, of the Sun and Lunar. Probably "summation" cycles - above solar and lunar (dependent on the Sun) when the overlap in the respective phases (during glaciations occur after a longer interval between the D-O - multiples of 1,470 years) is "guilty" for the emergence of quasi-cycle - 1470 + / -500 years.
    0 0
  7. It should also refresh the knowledge on the D-O: Orbital modulation of AMOC variability T. Friedrich et al., 2009.: “However, without careful considerations of the orbital influences on internally generated millennial-scale AMOC variability, a convincing assessment of the mechanisms for observed D-O variability remains elusive.” About the differences between D-O and BE decides to sea ice cover on the GIN sea - the polar front position - the Sun, however, both choosing - AMOC. Melting of glaciers is secondary. Millennial and sub-millennial scale climatic variations recorded in polar ice cores over the last glacial period, Capron et al. 2010.: “This shows that for extraordinary long stadial durations the accompanying Antarctic warming amplitude cannot be described by a simple linear relationship between the two as expected from the bipolar seesaw concept. We also show that when ice sheets are extensive, Antarctica does not necessarily warm during the whole GS as the thermal bipolar seesaw model would predict, questioning the Greenland ice core temperature records as a proxy for AMOC changes throughout the glacial period.” “The results display a succession of abrupt events associated with long Greenland Inter Stadial phases (GIS) enabling us to highlight a sub-millennial scale climatic variability depicted by (i) short-lived and abrupt warming events preceding some GIS (precursor-type events) and (ii) abrupt warming events at the end of some GIS (rebound-type events).” Thus, in previous periods of warming in a long time inter LG period, we had BE ... Extreme deepening of the Atlantic overturning circulation during deglaciation, Barker, 2010. It shows that the AMOC is a change from weak to strong, has resulted in: “During the Bølling-Allerød (B–A) warm phase, 14,600 years ago, temperatures rose by 9 degrees Celsius over the course of just a few decades.” Analyzing the same period - Interhemispheric coupling, the West Antarctic Ice Sheet and warm Antarctic interglacials, Holden et al., 2010.: write: “Ice core evidence indicates that even though atmospheric CO2 concentrations did not exceed ~300 ppm at any point during the last 800 000 years, East Antarctica was at least ~3–4 °C warmer than preindustrial (CO2~280 ppm) in each of the last four interglacials. During the previous three interglacials, this anomalous warming was short lived (~3000 years) and apparently occurred before the completion of Northern Hemisphere deglaciation.” “We present two 800 kyr transient simulations using the Intermediate Complexity model GENIE-1 which demonstrate that meltwater forcing generates transient southern warming that is consistent with the timing of WPTs, but is not sufficient (in this single parameterisation) to reproduce the magnitude of observed warmth.
    0 0
  8. Ken Lambert - the radiative forcing calculated in the IPCC report is the *change* since 1750. That's what causes a radiative forcing - a change in the associated causal factor (greenhouse gas concentrations, solar output, etc.).
    0 0
  9. KL #53 Two obvious problems with your post: 1. An incorrect assumption about TSI (see dana1981's response at #58) which means that the logic of your post is not sound. 2. You're still assuming that the OHC estimates are good enough to be able to draw strong conclusion from them.
    0 0
  10. Ken, If we are to be sure that the sun is not responsible for recent climate change we that we fully comprehend all the possible linkages. Therefore, with all due respect to a man who is obviously very sophisticated, I urge you to consider the atmospheric dynamics described at http://climatechange1.wordpress.com/2010/08/17/is-enso-rather-than-a-%E2%80%98greenhouse-effect%E2%80%99-the-origin-of-%E2%80%98climate-change%E2%80%99-by-erl-happ/ It is generally acknowledged that the ENSO phenomenon is not understood. It is my belief that when it is understood, we will understand the the nature of the sun-climate link.
    0 0
    Response: I suggest moving any discussion of ENSO to the "It's El Nino" page
  11. Moved discussion to there...
    0 0
  12. dana1981 #51 The Anthropogenic (AG) forcings and natural 'Solar' in Fig 2.4 AR4 are calculated 'changes' from AD1750, the critical point being that the AG forcings were 'zero' in AD1750, so the AG values are referenced to a zero baseline; whereas the Solar forcing in AD1750 is not nesessarily 'zero'. That means that you can reconstruct the AG forcings (with proxies and theory) back to AD1750 and draw the curves from a 'zero' baseline in AD1750. The area under these curves represents the energy added or subtracted from the Earth system. If you do the same for Solar forcing you need to know what the value was in AD1750, referenced to a 'zero' solar forcing. This 'zero' solar forcing would be the TSI where the Earth was neither warming nor cooling. Since the Earth was warming out of the Maunder Minimum from about AD1715 the chances are that Solar forcing was greater than zero in AD1750, and that the area under a forcing curve drawn from AD1750 to the present will have a stating point above zero, which adds a slice of area (energy) 250 years x starting point (AD1750) forcing in W/sq.m. This could be a large number of Joules. kdkd #59 - this negates your point 1) and 2) OHC measurement is not the issue here - just that 90%+ of any long term heat gain must store in the oceans.
    0 0
  13. KL #53 I meant Arkadiusz, not Andreas. Arkadiusz - your posts are full of interest if hard to read and absorb. A mine of information.
    0 0
  14. Ken #62 "kdkd #59 - this negates your point 1) and 2) OHC measurement is not the issue here - just that 90%+ of any long term heat gain must store in the oceans." The logic in this statement may be obvious to you, but I fear that you have made a logical jump too far. My point 1 related to your comment that: "The +0.12W/sq.m for 'natural' Solar forcing is baselined to what? Was it zero in AD1750? If it was not or we don't know; then it should not be added and subtracted from the AG forcings based on 'zero' in AD 1750. where you basically try to reframe the model assumptions by trying to dodge around them in an illogical manner. My point 2 was that while a very large proportion of the heat does reside in the oceans, we can't (yet?) measure it in a sufficiently precise manner to be able to draw strong conclusions, and have to rely on other proxies for energy accumulation in the atmosphere. Your fairly repetitive post at #62 does nothing to dispell either of these arguments as far as I can see.
    0 0
  15. Dana1981, I still don't think your section on the D-O events is particularly convincing, especially with regards to the so called "timing flaw" you mention. For the sake of argument, if the LIA was the last cold phase of the D-O cycles, we could place the MWP as the peak of the last warm-phase, and subsequently the Earth should be warming now. Remember, the 1470 figure is the periodicity -- the time interval between peaks (or troughs). The Earth was in a trough several hundred years ago, and it should now be heading towards a peak (i.e. warming). So the fact that the LIA may have been the most recent cold phase of the D-O cycles does not preclude them from adding to the recent warming; quite the opposite. Please see my previous post on this thread for my reasoning on why D-O events cannot have had anything more than a negligible affect on global temps over the past few centuries.
    0 0
  16. After doing supliment research, it appears ( -Snip- ) is Arkadiusz Semczyszak. I want to thank him for his posts of papers. There were a few that I had not read yet. The early 20th century warming is still a huge question as to cause.
    0 0
    Response:

    [DB] "The early 20th century warming is still a huge question as to cause."

    Why is it you post virtually the same mantra "Because we can't be SURE, therefore we can't KNOW _________" on every thread?  The act gets tiresome, really.

    And lay off the insults.  You know better than that.  You want to learn & ask questions?  Fine, do so.  In the meantime, straighten up:

    Moderating this site is a tiresome chore, particularly when commentators repeatedly submit offensive or off-topic posts. We really appreciate people's cooperation in abiding by the Comments Policy, which is largely responsible for the quality of this site.
     
    Finally, please understand that moderation policies are not open for discussion.  If you find yourself incapable of abiding by these common set of rules that everyone else observes, then a change of venues is in the offing.

    Please take the time to review the policy and ensure future comments are in full compliance with it.

  17. DB: Why do I ask questions? Because maybe someone can be sure and would share said knowledge. When you look at the currently accepted TSI reconstructions, (which even within those there are substantial variations), none of them show that the early 20th century warming was caused by solar. So, if not caused by solar, what was it caused by? This is important in understanding the validity of the models that are being used in current projections. An aside. If what I wrote was considered an insult, I humbly applogize, and will certainly be more careful in the future and thank you for bringing that to my attention.
    0 0
    Response:

    [DB] Thank you.  In the time I've known you, the majority of the time it is obvious that you take the time and care to construct a comment that adds to the discussion.  Be the resource here that I know you can be is all I ask.

  18. Camburn, can assume that you have seen Meehl 2003? While forcings here are somewhat dated, it should be starting point. What do you mean by "currently accepted" TSI reconstructions? TSI reconstructions are improving all the time, so any modelling is always going to be based on whatever is best published TSI at the time. That said, early 20th Century warming seems to be well within the uncertainties of net known forcings (GHG and aerosols included). Can you be specific about what you think challenges that view?
    0 0
  19. scaddenp: ok.....the paper is based on a TSI reconstruction that does not match any current TSI reconstruction. I am sure the TSI reconstruction was the best available at the time the paper was written. as of late TSI reconstructions, and I don't have the links but I know the names: Svalgaard 2007 Prenminger 2006 Both show flat TSI during the early 20th century. Dr. Svalgaard is coming out/or it might have been published by now a newer reconstruction that re-affirms his previous work. With that in mind, the conclusion of Meehl 2003 is not applicable as they are using solar forcings as part of the bases for the increase in temperature. In the conclusion section of Meehl 2003 they state that the paper re-inforces that solar/ghg and aerosols account for the early 20th century warming. I don't know how to post pictures. I think in my archive I have the TSI reconstruction that Dr. Svalgaard is publishing. It does reflect the current solar max, and flattens the TSI even more in the early 20th century. So scaddenp: The thing that challenges Meehl is that the TSI reconstruction has been updated in peer reviewed papers and would not support his findings. So, I get back to the: what caused the warming in the early 20th century?
    0 0
  20. Dr. Svalgaards paper to be published, and it has been accepted, is based on the results of this paper. In his paper, he refines the data of F. Steinhilber,1 J. Beer,1 and C. Fro¨hlich2. TSI reconstruction for Holocene I am not trying to be a pest. If someone has a paper that is based on the newer TSI reconstructions that can show the early 20th century warming I would very much enjoy reading it.
    0 0
  21. DB: Thank you. I am not here to disrupt. That would be crass of me. There are areas of climate science that I feel the science is very good. There are also areas of climate science that I feel the science is not as up to date as it should be. This is one of those areas. I can't read everything, but collectively the knowledge of each can be shared with all. I am looking for additional knowledge.
    0 0
  22. Camburn, Svalgaard's most relevant is probably this (2011). However, if you put this reconstruction in Meehl, it looks within the uncertainty bands to me. That said it will be interesting to see an update of Meehl with better estimates of all forcings. Someone with more time than me can probably access that from the CMIP5 archive already though it will certainly be part the next IPCC report when it comes out.
    0 0
  23. scaddenp @72, your first link is a link to Meehl et al 2003 rather than to Svalgaard 2011.
    0 0
  24. Camburn, comparing Steinhiber et al to Meehl et al, both show a 0.5 W/M^2 rise in insolation between 1900 and the mid-century peak in insolation. Having said that, Meehl et al indicate that to be the rise in forcing, which suggests it is the globally averaged figure, compared to Steinhiber et al's TSI. In that case based on Steinhiber the rise in solar forcing should be 0.125 W/m2. Krivove et al, 2010 show a similar rise. A deficit of 0.385 W/m^2 is certainly large enough to be of interest. That deficit may be compensated for by a stronger usually accepted aerosol forcing. The early twentieth century saw a distinct lack of major volcanoes, resulting in a drop in the normal level of naturally occurring stratospheric aerosols. That would also require a stronger than currently accepted climate sensitivity per doubling of CO2 to balance anthropogenic aerosols. Alternatively, recent reconstructions showing lower variation in TSI could simply be wrong. After all, some recent reconstructions, notably by Shapiro continue to show a large variance in TSI>
    0 0
  25. Tom: Thank you. I will have to study your links as time permits. I would also hope I have created interest in studying this area again. As you noted, there are quit dramatic differences in reconstructed TSI as of late, which require re-examination of previous reasons of early 20th century warming. Shapiro would be considered an outlier with his results at this time.
    0 0
  26. Tom: Can you tell me more about Shapiro? I looked him up and he seems to be an economist. Is this correct?
    0 0
    Moderator Response: ???

    See Alexander Shapiro
    He works at the World Radiation Center
  27. Camburn @75, I agree it is one of many interesting areas of study in climate science. However, I do not see it as much of a threat to the consensus. To see why, consider this reconstruction of climate forcings over the last 1000 years from Hegerl and Zwiers, based (I believe) on previous work by Hegerl which I'm to tired to chase up at the moment): As you can see, they have no difficulty reconstructing early twentieth century temperatures (or indeed, temperatures for the entire 1000 years) with a change in solar forcing closer to 0.1 than 0.125 W/m^2 over the period 1900-1950. Part of the difference is made up by a stronger volcanic influence than in other reconstructions, however, it should be remembered that on the standard reconstructions for attribution studies as seen in the IPCC can reconstruct all of the 20th early 20th century rise with natural forcings alone. If one of those forcings is weaker than expected, the probable consequence is that natural plus anthropogenic forcings will still be able to reconstruct the temperature series, but that natural forcings alone will do so less well, possibly to the point of statistical significance. You are correct about Shapiro being an outlier. What is more, he uses an innovative technique which I gather to be quiet controversial. Intuitively it is dubious to me, but I think its one the solar physicists are going to have to sort out between themselves.
    0 0
  28. Sorry, link to Svaalsgard is here. Note that this is a review and proposal but it contains a good review of reconstructions.
    0 0
  29. Scaddenp: Thank you. This is not what I was referring to, but it does show the difference within specialists in this field. I asked Dr. Svalgaard about his paper that he had mentioned about 6-8 months ago, and he said he was not in the "TSI food fight at this time" I can only take his advice, that TSI is certainly not deffintive, and even present methods of trying to measure it via satillite are not very good. He did say that Judith Lean does not back her Lean 2000 reconstruction with the newer understandings. So, being the true skeptic that I am, from at least my understanding, I will not accept that the early 20th century warming was tied to an increase in solar as there is too much disagreement within those who are experts in this field to have any confidence level in this idea. Also, the L&P effect is something else new as well. So much to learn, so little known. Thank you very much for your help.
    0 0
  30. Tom: Thank you, I have limitied time right now, but will study the links.
    0 0
  31. Camburn, I think you are misunderstanding a lot about the uncertainties and the value of paleoclimate studies. Just because TSI reconstructions are difficult, does not mean that they are unbound. Climate theory as used in predicting future climate is not based on paleoclimate studies but on straight physics. Paleoclimate is very useful because it provides a test-bed for those theories. However, with anything outside the satellite era you have the issue of accuracy in climate measurement and accuracy of climate forcings. You can invalidate model when it fails to reproduce climate (within uncertainty and prediction window) using forcings within their limits. I dont think you have shown any threat to climate theory with the latest TSI data. I do not think that early 20C warming is SOLELY due to changes in TSI. (GHG and aerosols are also important). Where is that claim made? Also present measures of TSI may have some issues with absolute accuracy, but not with precision. That's important because forcing is about change more than absolute value.
    0 0

Prev  1  2  

You need to be logged in to post a comment. Login via the left margin or if you're new, register here.


The Consensus Project Website

THE ESCALATOR

(free to republish)


© Copyright 2024 John Cook
Home | Translations | About Us | Privacy | Contact Us