Climate Science Glossary

Term Lookup

Enter a term in the search box to find its definition.

Settings

Use the controls in the far right panel to increase or decrease the number of terms automatically displayed (or to completely turn that feature off).

Term Lookup

Settings


All IPCC definitions taken from Climate Change 2007: The Physical Science Basis. Working Group I Contribution to the Fourth Assessment Report of the Intergovernmental Panel on Climate Change, Annex I, Glossary, pp. 941-954. Cambridge University Press.

Home Arguments Software Resources Comments The Consensus Project Translations About Support

Bluesky Facebook LinkedIn Mastodon MeWe

Twitter YouTube RSS Posts RSS Comments Email Subscribe


Climate's changed before
It's the sun
It's not bad
There is no consensus
It's cooling
Models are unreliable
Temp record is unreliable
Animals and plants can adapt
It hasn't warmed since 1998
Antarctica is gaining ice
View All Arguments...


Username
Password
New? Register here
Forgot your password?

Latest Posts

Archives

Ocean Cooling Corrected, Again

Posted on 28 July 2011 by Rob Painting

The ongoing difficulty of accurately measuring the Earth's ocean heat content has led to premature "skeptic" claims about ocean cooling. A recent paper Von Schuckmann & Le Traon (2011) put the kibosh on ocean cooling claims. They find that from 2005 to 2010 the global oceans (10 to 1500 metres down) have continued to warm, although they caution that their result is based on the assumption that there are no more systematic errors in the data gathered from ARGO floats which measure ocean heat.

Figure 1 -Revised estimate of global ocean heat content (10-1500 mtrs deep) for 2005-2010 derived from Argo measurements. The 6-yr trend accounts for 0.55±0.10Wm−2. Error bars and trend uncertainties exclude errors induced by remaining systematic errors in the global observing system. See Von Schuckmann & Le Traon (2011)

The more (data), the merrier 

The ARGO float network began rollout in 2000, but prior to 2005 there wasn't sufficent global coverage, and because of this Von Schuckmann and Le Traon (2011) start their analysis from 2005 onwards. The authors found that only after November 2007 (when ARGO was 100% complete) is the ARGO network sufficiently robust to give accurate short-term trends of what they term 'global ocean indicators'. This being steric sea level changes (sea level rise from thermal expansion as the oceans warm), heat content, and ocean salinity. This is probably best illustrated in the figure below, where the authors apply their method of analysis to the satellite sea surface height (SSH) data (AVISO):
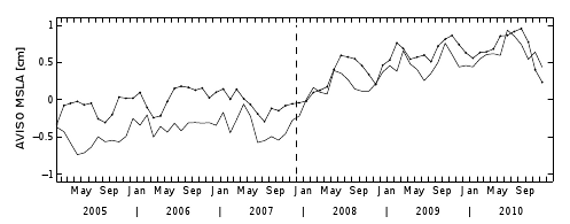
Figure 2 -Method validation using gridded altimeter SSH measurements (AVISO): gridded SSH during 2005–2010 has been subsampled to the Argo pro?le position and the simple box averaging method has been applied. Global mean SSH derived from the AVISO grid (bold line) is compared to its corresponding subsampled result.  

The two lines represent the satellite data and a subsampled set using the position of the ARGO float profiles and the authors 'box averaging' method - a method to account for the irregular distribution of ARGO floats in the ocean, and missing and spurious (faulty) data. After 2007 (vertical dashed line), when the ARGO installation is complete, it is obvious that both sets show greater agreement. This highlights how sensitive the short-term trends are to the number of ARGO floats in the network. 

Errors reduce as the length of observation increases 

Von Schuckmann & Le Traon (2011) also estimate the errors in global trends from the period analysed, and also future error uncertainty. For the 2005-2010 period the error uncertainty is plus/minus 0.1 watt per square metre; quite large considering the global trend over the period is 0.55 watts per square metre. However, after 15 years of observations the uncertainty drops considerably, down to ± 0.02 watts per square metre. This demonstrates how longer periods of observation, along with the complete ARGO network, are critical to derive more accurate long-term ocean trends. 

Ocean warming in context

The warming trend observed is slightly smaller than that seen in Von Schuckmann (2009), where the authors measure down to ocean depths of 2000 metres, and found a warming trend of 0.77 ±0.11 watts per square metre. However, it completely refutes a recent (2010) skeptic paper which suggested the oceans were cooling, based on the upper ocean down to 700 metres. Clearly much heat is finding it's way down into deeper waters. And although small in comparison, the deep ocean is gaining heat too. 

Upper ocean warming (0-700mtrs) is slower than that observed during the 1990's, but the oceans are still gaining heat. Indeed, the slow-down is to be expected if recent papers on increased reflective aerosols in the atmsophere are correct

Conclusion

The ARGO network was completed in November 2007, and only since then has the network been able to provide more robust short-term trends. Over the period 2005-2010 the oceans (10-1500 meters down) have warmed 0.55 watts per square meter, but error uncertainty is almost 20%. Uncertainty will reduce as the length of the observational record increases, but Von Schuckmann and Le Traon (2011), caution that this is provided no more systematic errors remain in the network.    

0 0

Printable Version  |  Link to this page

Comments

1  2  Next

Comments 1 to 50 out of 70:

  1. What is the conversion factor between watt/sq metre or joules/sq metre (used here) & zeta joules (used by Levitus & others)?
    0 0
  2. Here's what they write cited skeptics on this real meaning - importance ”systematic errors”: „It is possible that some unknown systematic error in the Argo float system is causing the flattening. Such an error would not explain the non-Argo NODC OHC result, nor the surface cooling.” ... and who here writes “the kibosh”? Definitely not Knox & Douglas and von Schuckmann & Le Traon: “Before the end of 2007, error bars are too large to deliver robust short-term trends of GOIs and thus an interpretation in terms of long-term climate signals ARE STILL QUESTIONABLE ...
    0 0
  3. 1 joule = 1 watt second 1 zettajoule = 1,000,000,000,000,000,000,000 joules Thus, zettajoules are most often used to describe very large energy transfers. For instance, 'all human energy use amounts to about 0.5 ZJ' or 'the Earth absorbs about 3,850 ZJ of sunlight per year'. Watts per square meter would describe an amount of energy in an area (e.g. how much a section of ocean surface has warmed) while joules per square meter would describe the amount of energy transfer per second in the area (e.g. the rate at which a section of ocean surface is being warmed).
    0 0
  4. I wonder how you can conclude a 'completely refute' if you compare sandals with boots. Apart from the different time scales, Von Schluckmann uses data down to 1500m (2011), resp. 2000m (2009), while Willis, Loehle, Pielke and Knox&Douglas (used in the 'refuted' paper) only use the upper 700m data. Completely different things.
    0 0
  5. JoeRG, this is no different than someone pointing to declining temperatures in Cherrypickersville and using this to 'conclude' that 'global temperatures are declining'. Yes, a study which then takes temperature trends from all over the world is certainly 'comparing sandals with boots'... but it can make an actual VALID analysis of global temperature trends. Ditto looking at only the top 700m vs 1500 or 2000m of the ocean to determine whether they are warming or not. A 'conclusion' that 'the oceans are cooling' based on very limited data can very definitely be 'completely refuted' by a more thorough analyses showing warming.
    0 0
  6. JoeRG - it intrigues me how you gloss over the obvious. The oceans down to 1500 metres are warming. It utterly refutes the claims made by Knox & Douglass (2010). They basically insinuate that global warming has stopped. They're wrong - as the continuing sea level rise also confirms. Furthermore, you missed the section in my post discussing the sensitivity of analyses based on using the uncompleted ARGO data (pre November 2007) versus the completed network. Peruse the previous analyses highlighted in Knox & Douglass (2010) - there's only 1 year of data using the completed network, making the result even less robust. If you read Von Schuckmann and Le Traon (2011) you'll gain an understanding of some of the issues involved.
    0 0
  7. Rob Painting - Original Post and #6 You say that the latest 2011 result is 0.55W/sq.m and that this "warming trend observed is slightly smaller than that seen in Von Schuckmann (2009), where the authors measure down to ocean depths of 2000 metres, and found a warming trend of 0.77 ±0.11 watts per square metre." Does the 0.55W/sq.m number apply to the surface of the oceans or the whole surface of the globe?
    0 0
  8. KL - The latest analysis covers 60N to 60S, and is equivalent to 0.38 +/- 0.07 W/m2 globally. Be a lot easier if they all used the same terms of reference - see comment @ 1. So still plenty of missing energy if Dr Trenberth is right, but not so much if Dr Hansen is correct.
    0 0
  9. "Clearly much heat is finding it's way down into deeper waters". That can't be the case. Consider Rignot 2011. "Using techniques other than GRACE and MBM, the mass loss of mountain glaciers and ice caps (GIC), including the GIC surrounding Greenland and Antarctica, has been estimated at 402 ± 95 Gt/yr in 2006, with an acceleration of 11.8 ± 6 Gt/yr2 over the last few decades [Kaser et al., 2006; Meier et al., 2007]. Our GRACE estimates and associated errors account for the leakage from the Greenland and Antarctica GIC, and, as discussed earlier, this leakage is small. The MBM estimates completely exclude the GIC. In year 2006, the total ice sheet loss was 475 ± 158 Gt/yr(regression line in Figure 2c), which is comparable or greater than the 402 ± 95 Gt/yr estimate for the GIC. More important, the acceleration in ice sheet loss of 36.3 ± 2 Gt/yr2 is three times larger than that for the GIC. If this trend continues, ice sheets will become the dominant contribution to sea level rise in the next decades, well in advance of model forecasts [Meehl et al., 2007]". I translate it for you. According to Rignot at al. rate of land based ice melt is 877+48.1(t-2006) in gigatons (where t is time in years AD). As it takes about 360 gigatons to raise sea level by 1 mm, in 2011 this rate is 3.1 mm/year. We also have data for rate of sea level rise as measured by satellites. Effect of increasing ocean basin volume due to GIA (Glacial Isostatic Rebound) is already taken into account in these figures (which is about 100 km3/year). We can see there is a slight deceleration (-0.1 mm/yr2) during the satellite era (since the end of 1992). Because of this, rate of sea level rise in 2011 is 2.3 mm/year. That is, sea level rise due to all other factors except melting of land based ice is -0.8 mm/year. Then we can have a look at the NOAA NODC Global Ocean Heat Content site. There we can see current rate of sea level rise due to thermosteric expansion of the upper 700 m of oceans is about 0.3 mm/year. That leaves us with -1.1 mm/year for the rest. There is one more major source contributing to sea level (except abyssal heat storage). It is fluid (not frozen) water storage over land. It can be divided into surface and subsurface waters. On the surface much water is being stored in dams while there is a huge ongoing groundwater depletion. The former process decreases sea level while the latter one increases it. The net result for recent times, according to Llovel 2010 is slightly negative, around -0.2 mm/year. That is, volume of ocean below 700 m is not increasing, but decreasing, by about 0.9 mm/year (320 km3/annum). It means no heat is sequestered there, quite the contrary. The deep ocean is cooling and contracting, it is probably losing more heat than the upper 700 m is gaining. Note that melting ice requires almost two orders of magnitude less heat than thermostreic expansion of water, so talk about recent heat storage in the climate system is inconsistent with claims of accelerating melt of ice sheets and glaciers.
    0 0
  10. Welcome back BP, Maybe you are being unclear, but you are not accurately reporting the satellite estimates of GSL rise. The link you provided shows the trend in GSL is 3.2 mm/yr, not 2.3 mm/yr in 2011 as you cited @9. So that error kinda makes your calculations and attendant hypotheses moot. Is this another case of a 'skeptic' showing confirmation bias? [Source] Additionally, I'm not sure what you believe qualifies you to question or refute the findings of Von Schuckmann & Le Traon (2011), especially if you cannot get the basics correct.
    0 0
  11. Berényi Péter @9: From the abstract of Rignot et al, 2011:
    "In 2006, the Greenland and Antarctic ice sheets experienced a combined mass loss of 475 ± 158 Gt/yr, equivalent to 1.3 ± 0.4 mm/yr sea level rise."
    So how does the sum go if you do not totally misunderstand the paper you are quoting: 2011 Sea Rise 2.3 mm (est) less Ice melt 1.3 mm leaves 1.0 mm. 1.0 mm less the steric sear rise for the upper 700 m of 0.3 mm equals 0.7 mm. 0.7 mm plus the loss of 0.2 mm due to water storage leaves 0.9 mm to be accounted for by steric sea level rise due to warming below 700 m. How quickly do you think Berényi Péter will now find this method so fraught with assumptions as to be worthless, and therefore to be totally ignored?
    0 0
  12. Berényi Péter - "Note that melting ice requires almost two orders of magnitude less heat than thermostreic expansion of water, so talk about recent heat storage in the climate system is inconsistent with claims of accelerating melt of ice sheets and glaciers." My pardon, but I cannot find the logic in this statement. Increasing heat storage in the climate system should both raise sea levels and accelerate ice melt. There is no mutual exclusion there. Can you explain what you mean? Secondly, as Albatross (and your own link!) point out, sea level rise is currently 3.2+/- 0.4 mm/year, not 2.3 mm/year. Where did you get the 2.3 value?
    0 0
  13. #10 Albatross at 01:41 AM on 29 July, 2011 you are not accurately reporting the satellite estimates of GSL rise I am. Sea level rise is clearly decelerating (linear fit is not appropriate). Current rate is 2.3 mm/yr, deceleration is 0.1 mm/yr2.
    0 0
  14. #11 Tom Curtis at 01:47 AM on 29 July, 2011 So how does the sum go if you do not totally misunderstand the paper you are quoting You forget about contribution of mountain glaciers and ice caps (GIC) along with acceleration. Think again.
    0 0
  15. BP @13, Now that gave me a good laugh-- no idea what the goodness of fit is or what the heck that grey line is mean to represent. Good scinetists provide those pertinent and important details. And of course you seem to be under the misguided impression that you know better than eminent scientists studying GSL rise have all got it wrong. Please inform UofC that their trend is incorrect. Try again.....seriously please try again and up your game.
    0 0
  16. #12 KR at 02:17 AM on 29 July, 2011 My pardon, but I cannot find the logic in this statement. Increasing heat storage in the climate system should both raise sea levels and accelerate ice melt. There is no mutual exclusion there. Can you explain what you mean? Yes. Accelerating ice melt and increasing heat storage in the abyss are inconsistent if sea level trend is measured correctly by satellites. Latent heat required to melt that much ice which would increase sea level by the same amount as thermosteric expansion is negligible indeed in comparision. Therefore you can match sea level rise that way without sequestering much heat. It is basic physics.
    0 0
  17. As BP has shown, the numbers obviously do not add up. According to Rignot, et. al., 2011, the accelerated mass loss of mountain GIC and the combinded Greenland / Antarctic ice sheets is 48.1 gT / yr., and therefore, the combined mass loss of 877 gT in 2006 would increase to ~1118 gT in 2011, equating to 3.1 mm in sea level rise. That would equate to the entire sea level rise using the higher value posted by KR and Albatross. If the glacial loss is accelerating at the stated rate, then the sea level rise should be acclerating similarly, unless the ocean has cooled. Clearly, accelerated glacial loss and warming oceans should not yield the sea level plot in #10.
    0 0
  18. BP @16, "Accelerating ice melt and increasing heat storage in the abyss are inconsistent if sea level trend is measured correctly by satellites." So much hand waving (mis-)attributed to "basic physics". Actually, BP you are talking through your hat. Here is why. Have you read Katsman and Voldenborgh (2011)? Probably not. I draw your attention to their section 3.2, "3.2. "Deep ocean warming", in which they say: "In addition, at times when the 8-yr anomalous trend in UOHC [Upper-oceanic heat content, 0 - 700 m] is negative, the deep ocean heat content (DOHC, defined as the integral over 700–3000 m) displays a positive trend that on average compensates 35% of the upper ocean changes (Fig. 4a). In part, this appears to be a response to a decreased Atlantic Meridional Overturning Circulation(AMOC)." And from their section 4: "Long timeseries of DOHC trends that have been corrected for instrumentation problems [Gouretski and Koltermann, 2007; Wijffels et al., 2008; Willis et al., 2009] are not available, but the observation that the OHC over 0–2000 m has risen substantially over 2003–2008 [von Schuckmann et al., 2009; Song and Colberg, 2011] while it has reached a plateau in the upper ocean [Lyman et al., 2010] supports the view that part of the ‘missing heat’ is to be found deeper in the ocean. The uncertainty in the trend over 0–2000 m [von Schuckmann et al., 2009] can easily accommodate the ‘missing’ anomalous DOHC trend of about 35%×0.3 · 1022J yr−1 deduced from the model analysis (Fig. 4a)." Now how about Palmer et al. (2011)? In which they note: "Surprisingly, we find that one must integrate OHC to depths in excess of 4000 m before the gain in information with depth becomes saturated. We note that the upper 4000 m in these models represents about 90% of the total ocean volume." Song and Colbert (2011) find that: "Adding a GRACE-estimated mass trend, the data-model combination explains not only the altimetry global mean SLR but also its regional trends fairly well. The deep ocean warming is mostly prevalent in the Atlantic and Indian oceans, and along the Antarctic Circumpolar Current, suggesting a strong relation to the oceanic circulation and dynamics. Its comparison with available bottom water measurements shows reasonably good agreement, indicating that deep ocean warming below 700 m might have contributed 1.1 mm/yr to the global mean SLR or one-third of the altimeter-observed rate of 3.11 ± 0.6 mm/yr over 1993–2008." These findings are consistent with the analysis of 0-1500 m OHC data presented by Von Schuckmann & Le Traon (2011) above. All of these papers note the importance of abyssal and deep oceans. "Skeptics" wishing for the planet's oceans to be only 700 m deep is a fine example of cherry-picking and confirmation bias.
    0 0
    Moderator Response: [mc] fixed /bold tag.
  19. #18 Albatross at 03:47 AM on 29 July, 2011 All of these papers note the importance of abyssal and deep oceans. I see. What you are effectively saying is that Rignot et al. 2011 is flawed somehow. That is, land based ice (GIC + polar ice sheets) are in fact melting at a much slower, possibly decelerating rate. Is that your opinion? By the way, the 0.1 mm/yr2 deceleration in sea level rise shown by satellite data is not negligible. Its absolute value is about the same as the 36 Gt/yr2 acceleration due to polar ice sheet melt according to Rignot. As for basic physics: Heat of fusion for water is 334 kJ/kg. To raise sea level by 1 mm by adding water to it you need to add 3.6×10¹⁴ kg, and to melt that much land based ice 1.2×10²⁰ J is needed. On the other hand from data published on the NOAA NODC OCL Global Ocean Heat Content page you can easily derive that in the upper 700 m of oceans you need to add 7×10²¹ J to produce the same 1 mm rise by thermal expansion. That is, the same amount of heat is 58 times more efficient in rising sea level if it is expended for melting land based ice than for warming the upper ocean. Specific heat and volumetric thermal expansion coefficient of seawater depends on both temperature and pressure. The former not so much, but the latter one tremendously. It increases with both temperature and pressure. However, while pressure increases with depth linearly, temperature of oceans decreases fast in the upper several hundred meters, but as one goes deeper, this rate of cooling converges to zero. Therefore, although heat content changes below 700 m may be somewhat less effective in changing sea water volume than in the upper 700 m, but not immensely so, and beyond about 1000 m they start to grow increasingly efficient once again (due to pressure). Anyway, you can't put more heat in the abyss and expect its volume to shrink at the same time. Seawater (unlike fresh water) is the most dense at the point of freezing, provided its salinity is greater than about 30 PSU, which is obviously true for all major basins.
    0 0
  20. BP @19, I see. You are ignoring the fact that you are curve sitting the GSL data. Can we deal with one thing at a time please.
    0 0
  21. BP @19, "What you are effectively saying is that Rignot et al. 2011 is flawed somehow." I see also that you are here to try and attribute words and opinions to me that I never uttered. Stop it, I am not here not play word games BP. I do see a lot pontification and hand waving by you, with no published papers provided by you to support your assertions concerning OHC. Do you have any substantive facts to make to challenge Von Schuckmann & Le Traon's (2011) finding that from 2005 to 2010 the global oceans (10 to 1500 metres down) have continued to warm...? Yes or no? "By the way, the 0.1 mm/yr2 deceleration in sea level rise shown by satellite data is not negligible." So by your reckoning, what will the GSL be 10 years from now? Would you bet money on the quoted figure.
    0 0
  22. Berényi Péter - I find it curious that you are arguing against increasing ocean heat content from sea rise numbers, when actual thermometers are measuring said increasing OHC. Curious, and unconvincing. As Albatross asked earlier, do you have any peer reviewed references that contradict Von Schuckmann and Le Traon 2011? Because I think that direct temperature evidence from the ARGO floats is more rather convincing than your indirect arguments (contradicted by direct measurement data). Especially given the error ranges on melt scales, and your quite frankly cherry-picked short term slope estimate.
    0 0
  23. Berényi Péter - From Von Schuckmann 2011: "Our revised estimation of GOIs indicates a clear increase of global ocean heat content and steric height. Uncertainty estimations due to the data handling reveal that this increase is significant during the years 2005–2010 (this does not mean, of course, that these are long term trends)." (emphasis added) Do you have a peer reviewed refutation of this? Because your post here is quite unconvincing considering your short term trend analysis.
    0 0
  24. #21 Albatross at 08:27 AM on 29 July, 2011 So by your reckoning, what will the GSL be 10 years from now? Would you bet money on the quoted figure. Come on, I am talking about facts, you know, events that happened in the recent past (last 19 years or so) and were measured by actual instruments. No one can predict GSL reliably in 10 years from now, the science is simply not mature enough to do that. Perhaps never will be. -snip- So by your reckoning, what will the polar ice sheet melt rate be 10 years from now? Would you bet money on it? -snip-
    0 0
    Moderator Response: Please refrain from making inflammatory comments. Thank you.
  25. I dont see how you can call V&T an "outlier" unless you have other published analyses of the Argo data that give different answers. The paper was primarily about how accurately could measures could be made from the Argo data so have you got a criticism of their conclusions? What there seems to be is a broad consensus that Argo is a better instrument than satellites.
    0 0
  26. I think it is a bit funny to see this line of "skeptical reasoning" unfolding. At the most basic level, talking about inconsistency in a situation with so much fluctuation and so large error margins in the estimates, has little logical foundation. When the sea level rise due to GrL+AntA ice sheets was 1.3+-0.4 mm in 2006, there is in fact a fair chance it was only 0.5 mm - nobody can say for sure, and it may certainly not be used for anything but the most tentative reasoning. Acceleration is even worse, when you can't even differentiate once, you can surely not do it twice. As an exercise to develop some intuition on this, BP may take the raw data and carry out the acceleration calculations back through the 90es. It has varied a lot, and so far has had little predictive value. BP's graphing is extremely misleading in that the running average values say nothing about the actual spread in the observations, and convey the impression of a kind of determinism that simply is not there in the raw data. Furthermore, the fluctuations are far from entirely random, which makes identification/attribution of short time trends even more problematic. Even with a consistent measurement regime in place, it would be problematic to quantify short time trends with any precision, as Rob points out. It may well be that BP's estimates for rise and deceleration turn out to be correct, it's just that it will take several years to get enough data to tell. And the profession of predicting longer term trend shifts from short-time fluctuations over periods where the fluctuations may be an order of magnitude larger than the trend, has a terrible track record. I really can't believe technically adept people will use it for anything unless they are deeply emotionallly invested in the causes they try to prove. For example, the UColorado 60-days moving average was almost flat from 2006 to 2008. Which of course "proved" that sea level rise had virtually halted. Only to suddenly start again 2009-2010. Surprise! Because so many different factors play a significant role, we must be very careful to extrapolate or conclude from the data we have so far. When a system is far from equilibrium, which the radiation imbalance indicates that the earth is now, we may get all sorts of quasi-periodic phenomena. Such phenomena lend themselves to diverse types of pattern matching, and disregarding the basic physics, all sorts of "laws" may be "proved" by the extremely good matches of the ad hoc models. An example here: BP tries to fit the sea level rise almost exclusively by melting, and that would then "prove" than oceans are not heating, that we are, rather in zero or negative radiative balance, which, in turn "proves" that the climate sensitivity must be very low etc etc. But when you build your reasoning on data, zoomed in so that they are overwhelmed by noise, and don't take the noise fully into consideration, the results also become overwhelmed by noise.
    0 0
  27. BP: "Come on, I am talking about facts, you know, events that happened in the recent past (last 19 years or so) and were measured by actual instruments. No one can predict GSL reliably in 10 years from now, the science is simply not mature enough to do that. Perhaps never will be." No, you are talking about estimates. And the quality of those are to be checked by their predictive power. And I think you demonstrate your thinking quite well when you refuse to produce estimates. Estimates will of course have to be qualified by uncertainties, and your whole reasoning breaks down when those are taken into consideration. I tend to stay a bit Popperian: If you are not willing to assert something than can get refuted, you stay outside of natural science. And for scientists of Roy Spencer's caliber: How often and thoroughly will you be refuted, and still consider yourself a significant scientist?
    0 0
  28. SNRatio@27: I would suggest you read the published paper. Reading and understanding it explains a lot and answers a lot of here to fo, unanswered questions.
    0 0
  29. As for the Von Schuckmann & Le Traon paper itself. It would be much easier if the authors broke down their estimates at least above/below 700 m depth. That way their results were directly comparable to online data based on Levitus 2009. Of course it would also help if their results were expressed in Joules (or 1022 J) as it is standard in the literature (instead of W/m2). While we are at it. This 0.55 ± 0.1 W/m2 is actually only 0.39 ± 0.07 W/m2 globally, because they have chosen to project their results to the ocean surface, not the entire planetary surface, as it would be appropriate if one is talking about planetary imbalance. For the six year period between 2005-2010 the Levitus data give 0.14 ± 0.06 W/m2 imbalance for the upper 700 m. It means Von Schuckmann & Le Traon calculates 0.25 ± 0.09 W/m2 (almost twice as much) for the layer between 700 & 2000 m (for the entire surface). One can hardly evaluate how realistic it is with no supplementary material whatsoever. What is more, choosing 2005 as the starting year is kind of cherry picking. For 2004-2010 Levitus data give 0.055 ± 0.047 W/m2 for the upper 700 m, which is essentially zero. Please note that by about mid-2003 ARGO coverage got global (the huge gap previously open in the southern ocean was filled by that time). Between 2004-2007 only density of the network improved further, not its coverage. Therefore dismissing 2004 altogether is not justified. It should be taken into account, with somewhat larger error bars perhaps.
    0 0
  30. It also worth noting that pushing heat into the upper 2000 m of oceans at a rate of 0.55 W/m2 means it would warm at a rate of 0.2°C/century. Compare it to the ~3°C/century IPCC projections for surface warming. In other words, the surface is supposed to warm at a rate 15 times faster than the oceans do.
    0 0
  31. Berényi Péter - "Therefore dismissing 2004 altogether is not justified. It should be taken into account, with somewhat larger error bars perhaps." I strongly suggest you read the paper, in particular looking at Fig. 4, Method validation using gridded altimeter SSH measurements, where Von Schuckmann & Le Traon (2011) demonstrate why they feel that Nov. 2007 is the earliest point where the ARGO data is fully trustworthy. You have not, as far as I can tell, pointed out any serious issues, or contradictory references, that indicate problems with this paper. Direct measurements of temperature and OHC really are more convincing than indirect arguments, particularly with your short term (cherry-picked?) sea level trend.
    0 0
  32. Berényi Péter - "No one can predict GSL reliably in 10 years from now, the science is simply not mature enough to do that. Perhaps never will be." If you are not willing to make testable predictions, Berényi, you are simply not doing science, end of story. Predictions with bounds of uncertainty - those are testable assertions. "No, you're wrong" statements are not, they are just rhetoric.
    0 0
  33. Camburn - What I am noting is that BP has proved nothing - he chose a short period of SLR, fit a trend to it, and made indirectly based claims that there was therefore no OHC increase occurring. Von Schuckmann & Le Traon demonstrated that the last 3-4 years of ARGO data match up with satellite altimeter data (which has considerably longer data sets), validating the ARGO data, and that the ARGO temperature records indicate sequestering of heat in the deeper ocean. They fully acknowledge that there is a significant seasonal variation, but indicate (based on a statistical analysis) that the data is statistically significant over the ARGO data period. BP's claims that Von Schuckmann & Le Traon are wrong are simply handwaving. He has done zero sensitivity analysis, or significance analysis, used a value for SLR 30% off from the measured value, and then claims that he has somehow invalidated the thermometers on the ARGO floats. There is certainly room for more data from the ARGO floats, particularly since they are now providing a more complete sampling. But BP's invalidation is a bad joke.
    0 0
  34. KR: Yes and no. Physics demands that if OHC has increased as Von Schuckmann indicates, thermosteric sea level should be value A. We have in evidence another published paper showing the addition of glacial melt, etc to sea level rise. When you do the math, even on a short time period, the basic physics indicates a different result than Von Schuckmann has found. The early ARGO data has substantial error bars, which are readily admited to in the Von paper. The main thing is, 2-6 years of data does not prove much of anything. We will need at least another 10 years, and even then it will be subject to question. That is the main reason I put little value in Von Schuckmann's paper. After the data splice, there is no effective way of knowing whether the oceans are cooling or warming as the time period is too short.
    0 0
  35. Camburn - "After the data splice, there is no effective way of knowing whether the oceans are cooling or warming as the time period is too short." That is a reasonable position to hold. I can respect that. I would therefore question, however, your (and BP's) assertions that the oceans are not warming, despite the known physics of CO2 levels and radiative balance. You, by your own statements, do not have sufficient data to establish a trend, yet you have repeatedly done so. Perhaps the recent aerosol loads and solar minima are causing a short term downswing (with the concomitant warming upswing later). Perhaps the ARGO data needs more corrections. Perhaps the XBT data requires more corrections. Perhaps transport to the benthic depths is faster than we thought. But we certainly know the physics of radiative balance, and such short term variations only add noise to the larger picture of GHG physics and global warming. My opinions on assertions (such as yours) of non-warming oceans via indirect evidence would violate the Comments Policy - suffice it to say that I am impressed only by the audacity of such statements, and not by the scientific value.
    0 0
  36. "That is the main reason I put little value in Von Schuckmann's paper." And yet you seems to regard the earlier result for 0-700m as more reliable? Why is that?
    0 0
  37. Camburn - Again, you are making assertions that are not statistically supported, such as "...is flat. No warming nor cooling.". The rise in sea levels has been 3.2 mm/y +/-; there is not yet enough information to establish a trend (up, or in particular down) from that. The Von Schuckmann and other papers indicate that there is evidence not contrary to continuing SLR; you on the other hand seem driven by a need to state that the oceans are not warming, or even cooling. I have to view this as a continued campaign to claim it's not happening. The evidence does not, unfortunately, support your claim.
    0 0
  38. BP - What is more, choosing 2005 as the starting year is kind of cherry picking This from my post: " The ARGO float network began rollout in 2000, but prior to 2005 there wasn't sufficent global coverage, and because of this Von Schuckmann and Le Traon (2011) start their analysis from 2005 onwards" The authors specifically identify the lack of coverage in the Southern Ocean. A point which is supported by your graphic posted @ 29. In fact your graphic indicates the exact opposite of what you claim.
    0 0
  39. BP @ 9 - "Clearly much heat is finding it's way down into deeper waters" -That can't be the case. Consider Rignot 2011........." ARGO floats measure ocean temperature, salinity and ocean current velocity as they yo-yo up and down the water column. Seems a tad more direct than relying on sea level budget estimations.
    0 0
  40. #33 KR at 12:02 PM on 29 July, 2011 BP's claims that Von Schuckmann & Le Traon are wrong are simply handwaving. He has done zero sensitivity analysis, or significance analysis, used a value for SLR 30% off from the measured value Sorry for driving you desperate, but acceleration term calculated from satellite sea level data is significantly negative. It is −0.102 ± 0.028 mm/yr2, that is, more than three σ below zero, which is deceleration for all practical purposes. -snip-
    0 0
    Moderator Response: Please tone down the inflammatory language and snark. Thank you.
  41. #35 KR at 12:37 PM on 29 July, 2011 I would therefore question, however, your (and BP's) assertions that the oceans are not warming, despite the known physics of CO2 levels and radiative balance. Of course I have not said that. What I have said is the ocean can't be warming if melt rate of land based ice is accelerating as claimed and satellite SLR is correct. I suppose you are familiar with conditional propositions. It is entirely possible Von Schuckmann & Le Traon are right and the 800 m thick layer between 700 & 1500 m depth is warming twice as fast as the layer above. This setup still lacks a credible physical mechanism, but that may come later. In this case current rate of ocean warming is 0.2°C/century and land based ice is not in immediate peril. I can live with that. But if you still claim some dangerous warming is going on, you have to show 1. how can the surface be warming more than an order of magnitude faster than the oceans 2. where is the error in recent papers purporting large and increasing melt rate of land based ice OR 3. you may try to show us satellite SLR is flawed
    0 0
  42. BP -"It is entirely possible Von Schuckmann & Le Traon are right and the 800 m thick layer between 700 & 1500 m depth is warming twice as fast as the layer above. This setup still lacks a credible physical mechanism, but that may come later." That's not what Von Schuckmann and Le Traon suggest at all - that's a strawman argument. They use a more complete dataset and different analysis (infilling missing profiles with 'averaged anomalies' as opposed to zero anomaly infilling employed by Lyman et al for instance) and measure deeper into the ocean. 10-1500 metres, you will note, includes 690 metres of the top 700 metres of ocean. "Of course I have not said that. What I have said is the ocean can't be warming if melt rate of land based ice is accelerating as claimed and satellite SLR is correct. I suppose you are familiar with conditional propositions" As above, the oceans are warming according to ARGO thermometers. Note the image posted @ 10 by Albatross - calculate 2009 (as you have for 2011) and show us what you come up with.
    0 0
  43. Rob: You are falling into the short time frame trap. There has not been a long enough series of ARGO data to provide sufficient valid data to suggest that the oceans are warming or cooling. Skeptics use this all the time, the short term time frame. I do not believe that you are a skeptic.
    0 0
    Moderator Response: (DB) Please read the OP.
  44. BP - various posts BP - you might want to look at the Trenberth contribution to the debate here: http://www.skepticalscience.com/news.php?p=2&t=70&&n=865 The issue of OHC increase of decrease is a vital one to the whole AGW story. Your point that one can't have a high mass rise (2-3mm/yr) and high steric rise (or any steric rise at all) at the same time when the overall rise is 2.3mm/yr is obviously correct. In energy balance terms, a high mass rise from land ice melt worsens the 'missing heat' part of energy balance markedly; because of your point that 58 ntimes more heat energy is required to get a mm of steric rise compared with a mm of ice melt rise. Dr Trenberth's 0.9W/sq.m global imbalance is getting further away from 0.39W/sq.m which is the 0.55W/sq.m of **oceanic** rise expressed globally. What is needed here is a credible explanation of why the fast held 0.9W/sq.m is not being found as OHC measurement improves.
    0 0
  45. ETR - the steric contribution does indeed appear to have slowed. Consider the differences (even allowing for the different time periods and lack of coverage) between Von Schuckmann 2009 and this study. Ice melt is contributing more and more to sea level rise, but that's a whole world away from BP's claims. Some very recent papers have looked at this issue - and they completely disagree with BP too. I'll post some graphs and links tomorrow. KL - Doc Trenberth may disagree, but there's a paper been submitted to the journal Nature: Heating of earth’s climate system continues despite lack of surface warming in past decade - Loeb (2011) They use new TOA (top of of the atmosphere) satellite radiation, and ARGO OHC data, measurements to show that the 'slow-down' in warming is consistent with radiative forcing - they find warming of 0.52 =/- 0.43W/m2, - i.e the 0.9 figure is wrong. I have no idea when it's likely to be published though. All-in-all supports what I wrote in the "Why wasn't the hottest decade hotter?" thread - there was a slow-down in the rate of global warming during the 'noughties'. Those pesky manmade aerosols are a prime suspect in my view. They would explain a lot of the observations.
    0 0
  46. "Sorry for driving you desperate, but acceleration term calculated from satellite sea level data is significantly negative." Your error term is widely at variance with other estimates - perhaps you might like to show us your working here. Managing the satellite reference frame to 0.1mm/yr I can only assume as truly monstrous cherry pick of short term data. For ITRF accuracy try here. I think you need to look at 10-15 year trends for any real credibility (which applies to claims of acceleration as well).
    0 0
  47. Thanks for the paper Rob. I agree that the aerosols are a prime suspect for the recent slowdown. Although I have not ruled out other possibilities yet.
    0 0
  48. By the way, I am perfectly aware of where to get the SL data from - just not how BP got his error bars.
    0 0
  49. Rob P @45, Nice find. I also found this summary of the Loeb et al. paper on the intertubes: "In a recent study (Loeb et al. 2011) Co-Chair Norman Loeb addresses a seemingly contradictory issue with respect to observed interannual variations in net TOA radiation and ocean heat storage raised by Trenberth and Fasullo (2010). On a global annual scale, interannual variations in net TOA radiation and ocean heat storage should be correlated, since oceans serve as the main reservoir for heat added to the Earth-atmosphere system. Wong et al. (2006) showed that these two data sources are in good agreement for 1992–2003. In the ensuing 5 years, however, Trenberth and Fasullo (2010) note that the two diverge from one another. The new paper by Loeb and co-authors uses improved satellite top-of-atmosphere (TOA) radiation measurements and a new analysis of ocean heat content data to show that while Earth’s energy imbalance and ocean heating rate have exhibited variability consistent with El Niño-Southern Oscillation (ENSO), there is no evidence of a decline during the past decade. Satellite observations of top-of-atmosphere (TOA) net radiation constrained by recent in situ ocean heat content data indicate that during the past decade Earth has been accumulating energy at the rate 0.52 ±0.43 Wm–2. These results suggest that although Earth’s surface has not warmed significantly during the 2000s, energy is continuing to accumulate in the sub-surface ocean at a rate consistent with anthropogenic radiative forcing." [Source] Interesting times.
    0 0
  50. Camburn, Might I also suggest that you read the main post and the paper by von Shuckmann and Le Traon. The trend in OHC (down to 1500 m) was not the main objective of their paper (as indicated by the title "How well can we derive Global Ocean Indicators from Argo data?"), they also have some caveats in there, such as: "Note that our estimations provide an estimation of errors on the trend over a given time period. Such trends even if they are statistically significant cannot be interpreted as long term trends as they are certainly influenced by interannual signals." But when speaking to claims made by some "skeptics" that the oceans have not been accumulating heat since 2004, these data are appropriate , and show such bold (and premature) assertions to be demonstrably false. PS: Disappointing that you so uncritically and unskeptically accept Spencer and Braswell's latest poor effort as some kind of silver bullet. It has not taken long for the real scientists to refute it, see here and here.
    0 0

1  2  Next

You need to be logged in to post a comment. Login via the left margin or if you're new, register here.


The Consensus Project Website

THE ESCALATOR

(free to republish)


© Copyright 2024 John Cook
Home | Translations | About Us | Privacy | Contact Us