Climate Science Glossary

Term Lookup

Enter a term in the search box to find its definition.

Settings

Use the controls in the far right panel to increase or decrease the number of terms automatically displayed (or to completely turn that feature off).

Term Lookup

Settings


All IPCC definitions taken from Climate Change 2007: The Physical Science Basis. Working Group I Contribution to the Fourth Assessment Report of the Intergovernmental Panel on Climate Change, Annex I, Glossary, pp. 941-954. Cambridge University Press.

Home Arguments Software Resources Comments The Consensus Project Translations About Support

Bluesky Facebook LinkedIn Mastodon MeWe

Twitter YouTube RSS Posts RSS Comments Email Subscribe


Climate's changed before
It's the sun
It's not bad
There is no consensus
It's cooling
Models are unreliable
Temp record is unreliable
Animals and plants can adapt
It hasn't warmed since 1998
Antarctica is gaining ice
View All Arguments...


Username
Password
New? Register here
Forgot your password?

Latest Posts

Archives

A Detailed Look at Renewable Baseload Energy

Posted on 25 June 2011 by Mark Diesendorf, dana1981

The myth that renewable energy sources can't meet baseload (24-hour per day) demand has become quite widespread and widely-accepted.  After all, the wind doesn't blow all the time, and there's no sunlight at night.  However, detailed computer simulations, backed up by real-world experience with wind power, demonstrate that a transition to 100% energy production from renewable sources is possible within the next few decades.

Reducing Baseload Demand

Firstly, we currently do not use our energy very efficiently.  For example, nighttime energy demand is much lower than during the day, and yet we waste a great deal of energy from coal and nuclear power plants, which are difficult to power up quickly, and are thus left running at high capacity even when demand is low.  Baseload demand can be further reduced by increasing the energy efficiency of homes and other buildings.

Renewable Baseload Sources

Secondly, some renewable energy sources are just as reliable for baseload energy as fossil fuels.  For example, bio-electricity generated from burning the residues of crops and plantation forests, concentrated solar thermal power with low-cost thermal storage (such as in molten salt), and hot-rock geothermal power.  In fact, bio-electricity from residues already contributes to both baseload and peak-load power in parts of Europe and the USA, and is poised for rapid growth.  Concentrated solar thermal technology is advancing rapidly, and a 19.9-megawatt solar thermal plant opened in Spain in 2011 (Gemasolar), which stores energy in molten salt for up to 15 hours, and is thus able to provide energy 24 hours per day for a minimum of 270 days per year (74% of the year). 

Addressing Intermittency from Wind and Solar

Wind power is currently the cheapest source of renewable energy, but presents the challenge of dealing with the intermittency of windspeed.  Nevertheless, as of 2011, wind already supplies 24% of Denmark's electricity generation, and over 14% of Spain and Portugal's.

Although the output of a single wind farm will fluctuate greatly, the fluctuations in the total output from a number of wind farms geographically distributed in different wind regimes will be much smaller and partially predictable.  Modeling has also shown that it's relatively inexpensive to increase the reliability of the total wind output to a level equivalent to a coal-fired power station by adding a few low-cost peak-load gas turbines that are opearated infrequently, to fill in the gaps when the wind farm production is low (Diesendorf 2010).  Additionally, in many regions, peak wind (see Figure 4 below) and solar production match up well with peak electricity demand.

Current power grid systems are already built to handle fluctuations in supply and demand with peak-load plants such as hydroelectric and gas turbines which can be switched on and off quickly, and by reserve baseload plants that are kept hot.  Adding wind and solar photovoltaic capacity to the grid may require augmenting the amount of peak-load plants, which can be done relatively cheaply by adding gas turbines, which can be fueled by sustainably-produced biofuels or natural gas.  Recent studies by the US National Renewable Energy Laboratory found that wind could supply 20-30% of electricity, given improved transmission links and a little low-cost flexible back-up.

As mentioned above, there have been numerous regional and global case studies demonstrating that renewable sources can meet all energy needs within a few decades.  Some of these case studies are summarized below.

Global Case Studies

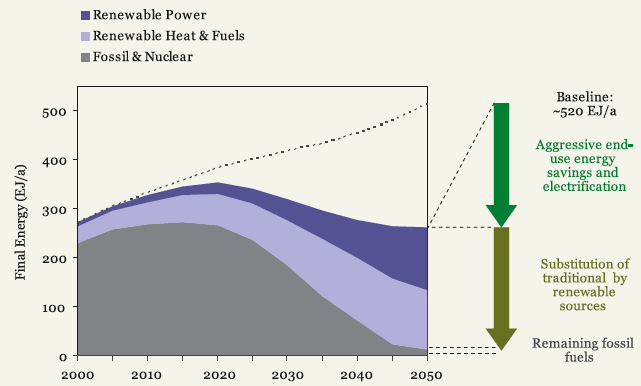
Energy consulting firm Ecofys produced a report detailing how we can meet nearly 100% of global energy needs with renewable sources by 2050.  Approximately half of the goal is met through increased energy efficiency to first reduce energy demands, and the other half is achieved by switching to renewable energy sources for electricity production (Figure 1).
ecofys fig 1

Figure 1: Ecofys projected global energy consumption between 2000 and 2050

Stanford's Mark Jacobson and UC Davis' Mark Delucchi (J&D) published a study in 2010 in the journal Energy Policy examining the possibility of meeting all global energy needs with wind, water, and solar (WWS) power.  They find that it would be plausible to produce all new energy from WWS in 2030, and replace all pre-existing energy with WWS by 2050

In Part I of their study, J&D examine the technologies, energy resources, infrastructure, and materials necessary to provide all energy from WWS sources.  In Part II of the study, J&D examine the variability of WWS energy, and the costs of their proposal.  J&D project that when accounting for the costs associated with air pollution and climate change, all the WWS technologies they consider will be cheaper than conventional energy sources (including coal) by 2020 or 2030, and in fact onshore wind is already cheaper. 

European Union Case Study

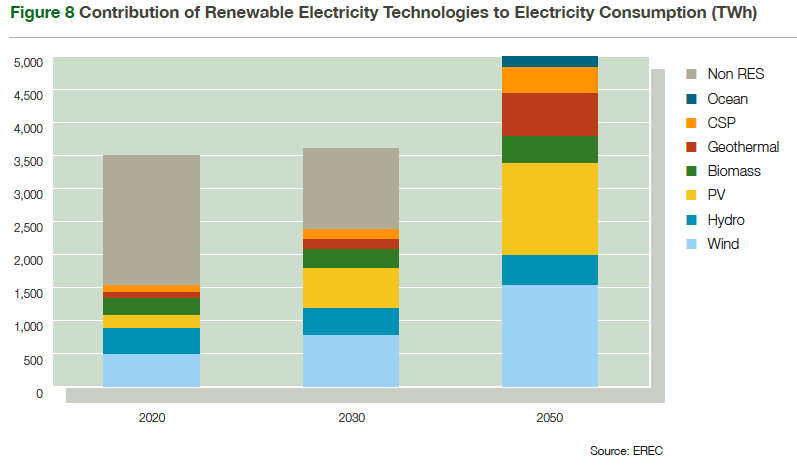
The European Renewable Energy Council (EREC) prepared a plan for the European Union (EU) to meet 100% of its energy needs with renewable sources by 2050, entitled Re-Thinking 2050.  The EREC plan begins with an average annual growth rate of renewable electricity capacity of 14% between 2007 and 2020.  Total EU renewable power production increases from 185 GW in 2007 to 521.5 GW in 2020, 965.2 GW in 2030, and finally 1,956 GW in 2050.  In 2050, the proposed EU energy production breakdown is:  31% from wind, 27% from solar PV, 12% from geothermal, 10% from biomass, 9% from hydroelectric,   8% from solar thermal, and 3% from the ocean (Figure 2).

EU Renewables

Figure 2: EREC report breakdown of EU energy production in 2020, 2030, and 2050

Northern Europe Case Study

Sørensen (2008) developed a plan through which a group of northern European countries (Denmark, Norway, Sweden, Finland, and Germany) could meet its energy needs using primarily wind, hydropower, and biofuels.  Due to the high latitudes of these countries, solar is only a significant contributor to electricity and heat production in Germany.  In order to address the intermittency of wind power, Sørensen proposes either utilizing hydro reservoir or hydrogen for energy storage, or importing and exporting energy between the northern European nations to meet the varying demand.  However, Sørensen finds:

"The intermittency of wind energy turns out not to be so large, that any substantial trade of electric power between the Nordic countries is called for.  The reasons are first the difference in wind regimes...and second the establishment of a level of wind exploitation considerably greater that that required by dedicated electricity demands.  The latter choice implies that a part of the wind power generated does not have time-urgent uses but may be converted (e.g. to hydrogen) at variable rates, leaving a base-production of wind power sufficient to cover the time-urgent demands."

Britain Case Study

The Centre for Alternative Technology prepared a plan entitled Zero Carbon Britain 2030.  The report details a comprehensive plan through which Britain  could reduce its CO2-equivalent emissions 90% by the year 2030 (in comparison to 2007 levels).  The report proposes to achieve the final 10% emissions reduction through carbon sequestration.

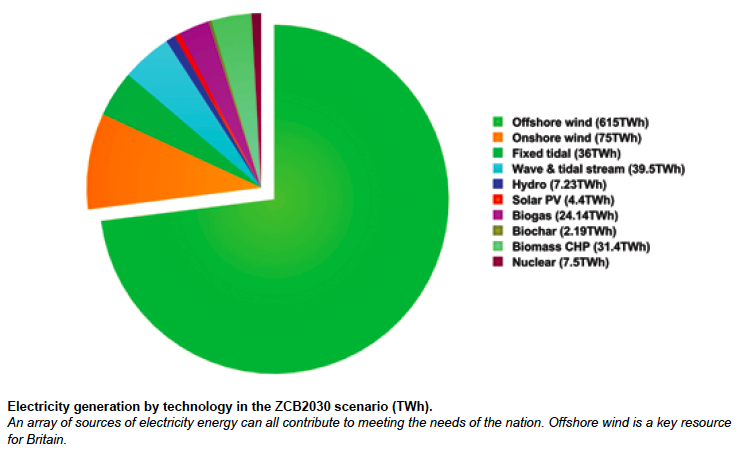
In terms of energy production, the report proposes to provide nearly 100% of UK energy demands by 2030 from renewable sources.  In their plan, 82% of the British electricity demand is supplied through wind (73% from offshore turbines, 9% from onshore), 5% from wave and tidal stream, 4.5% from fixed tidal, 4% from biomass, 3% from biogas, 0.9% each from nuclear and hydroelectric, and 0.5% from solar photovoltaic (PV) (Figure 3).  In this plan, the UK also generates enough electricity to become a significant energy exporter (174 GW and 150 terawatt-hours exported, for approximately £6.37 billion income per year).

UK Renewables

Figure 3: British electricity generation breakdown in 2030

In order to address the intermittency associated with the heavy proposed use of wind power, the report proposes to deploy offshore turbines dispersed in locations all around the country (when there is little windspeed in one location, there is likely to be high windspeed in other locations), and implement backup generation consisting of biogas, biomass, hydro, and imports to manage the remaining variability.  Management of electricity demand must also become more efficient, for example through the implementation of smart grids

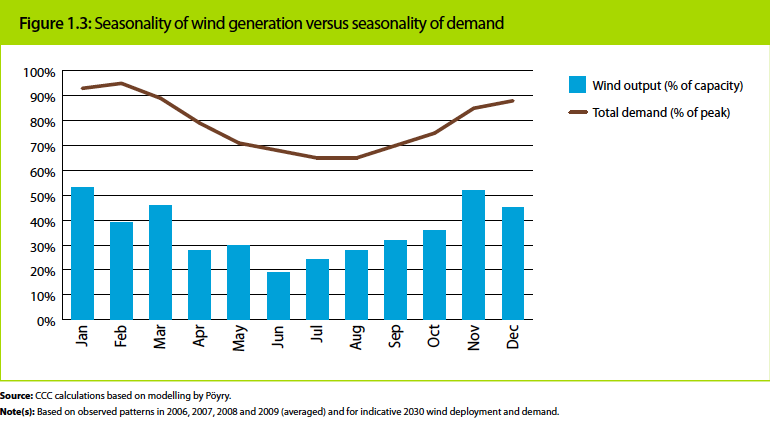
The heavy reliance on wind is also plausible because peak electricity demand matches up well with peak wind availability in the UK (Figure 4, UK Committee on Climate Change 2011).

UK wind seasonality

Figure 4: Monthly wind output vs. electricity demand in the UK

The plan was tested by the “Future Energy Scenario Assessment” (FESA) software. This combines weather and demand data, and tests whether there is enough dispatchable generation to manage the variable base supply of renewable electricity with the variable demand.  The Zero Carbon Britain proposal passed this test.

Other Individual Nation Case Studies

Plans to meet 100% of energy needs from renewable sources have also been proposed for various other individual countries such as Denmark (Lund and Mathiessen 2009), Germany (Klaus 2010), Portugal (Kraja?i? et al 2010), Ireland (Connolly et al 2010), Australia (Zero Carbon Australia 2020), and New Zealand (Mason et al. 2010).  In another study focusing on Denmark, Mathiesen et al 2010 found that not only could the country meet 85% of its electricity demands with renewable sources by 2030 and 100% by 2050 (63% from wind, 22% from biomass, 9% from solar PV), but the authors also concluded doing so may be economically beneficial:

"implementing energy savings, renewable energy and more efficient conversion technologies can have positive socio-economic effects, create employment and potentially lead to large earnings on exports. If externalities such as health effects are included, even more benefits can be expected. 100% Renewable energy systems will be technically possible in the future, and may even be economically beneficial compared to the business-as-usual energy system."

?

Summary

Arguments that renewable energy isn't up to the task because "the Sun doesn't shine at night and the wind doesn't blow all the time" are overly simplistic.

There are a number of renewable energy technologies which can supply baseload power.   The intermittency of other sources such as wind and solar photovoltaic can be addressed by interconnecting power plants which are widely geographically distributed, and by coupling them with peak-load plants such as gas turbines fueled by biofuels or natural gas which can quickly be switched on to fill in gaps of low wind or solar production.  Numerous regional and global case studies – some incorporating modeling to demonstrate their feasibility – have provided plausible plans to meet 100% of energy demand with renewable sources.

NOTE: This post is also the Advanced rebuttal to "Renewables can't provide baseload power".

0 0

Printable Version  |  Link to this page

Comments

Prev  1  2  3  4  5  6  Next

Comments 201 to 250 out of 257:

  1. Taking Griffiths' figures as supplied by BBD, it would take 310,000 square kilometers to completely power the world by solar thermal. That represent 0.06 of the surface of the Earth, 0.2% of the land area, or 62.4% "seriously amiss" tree hugger figures. Griffith estimates double that for solar voltaic, but photovolatic can be installed with dual use of land area so it is not clear that photvoltaic requires any additional area beyond that which is already committed to urban development. Using the expected efficiencies of the Andasol solar thermal power plant in Spain, the land required to generate 16 terrawatts of power is 400,000 square kilometers. The Andasol plant can generate power for 20 out of every 24 hours.
    0 0
  2. From David McKay as quoted by BBD:
    "The power of raw sunshine at midday on a cloudless day is 1000W per square metre. That’s 1000 W per m2 of area oriented towards the sun, not per m2 of land area. To get the power per m2 of land area in Britain, we must make several corrections. We need to compensate for the tilt between the sun and the land, which reduces the intensity of midday sun to about 60% of its value at the equator (figure 6.1)." (emphasis mine) I know this is a radical, and untried technology, so probably not suitable for serious analysis, but ... perhaps we could "compensate for the tilt between the sun and the land" by tilting the solar panels relative to the land. I know all the solar panels I've ever seen are laid flat to take advantage of the greater inefficiency that results, but do we really need to do so?
    0 0
  3. @ Tom #201 With due respect Tom your comments on Andasol amount to renewables boosterism. The Andasol plant can only achieve those sorts of figures for a around 2/3 to 3/4 of the year. That's not enough. When we share such data we really should point out the limitations too. Mind you - the developments in CST remain very promising as they continue to improve their ability to deliver reliable power. I'd like to see a plant implemented in Australia - of at least 50MW capacity - but don't know what the capital cost might be or if there are any plans. Perhpas the proposed investment fund associated with our proposed carbon tax might bring such an experiment closer to reality
    0 0
  4. Mark Harrigan @203, on the contrary, the figures I used for Andasol where based on the Forecast gross electricity volume. That represents just 40% of the plant's rated capacity, which in turn is just 40% of incident sunlight (annual direct standard radiation * solar field area). Why you should consider an expected efficiency of around 15%, and figures 30% more conservative than those quoted by BBD as "renewable boosterism" I do not know. It suggests that any figures quoted that do not prove that renewables cannot do the job will be rejected by you as "renewables boosterism".
    0 0
  5. Tom Curtis #201 You say:
    Using the expected efficiencies of the Andasol solar thermal power plant in Spain, the land required to generate 16 terrawatts of power is 400,000 square kilometers. The Andasol plant can generate power for 20 out of every 24 hours.
    Based on the standard estimate of 15W/m*2 for desert sited CSP: 10,000km*2 = 150GW 400,000km*2 = 6TW And that's assuming that there is absolutely nothing but CSP in every single one of those 400,000km*2. Less than half way there.
    0 0
  6. Hi Tom @ #204 (I think - numbers not showing on my browser alas) My point, which I don't think you've answered - is that what you quote cannot be achieved reliably throughout the year - but only for around 3/4 or thereabouts. If you can point to evidence that refutes this I will be very pleased to see it - really. Perhpas you can provide a link? The % you quote are irrelevant I think - what will make CST a success is when it can supply at a reasonable capacity factor 24/7/365. I have seen no evidence that it is close to that yet - although I do note that it continues to improve and shows great promise. So I do call it boosterism when we point out the positives of renewables without acknowledging the deficiencies. I think it hurts the case rather than supports it.
    0 0
  7. Tom Curtis #202 This is an attempt at humour, isn't it?
    0 0
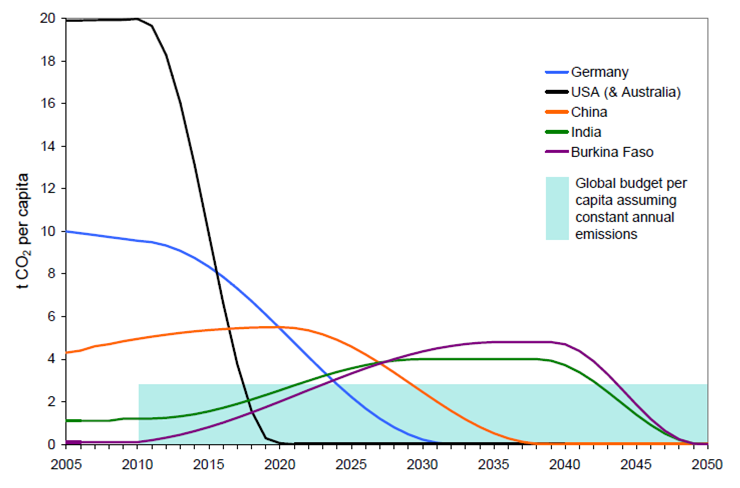
  8. There is one very simple, and very fundamental reason why nuclear power cannot by the mainstay of power generation in the near future. It is that if it is, we will have failed to meet the challenge of global warming. This can be seen very simply by looking at the carbon budget of permissible emissions on the assumption that we wish to keep the rise in temperatures below 2 degrees C. To have a reasonable prospect of doing so, we must keep total anthropogenic emissions between now and 2050 below 1,000 gigatonnes of Carbon. Given that, we can distribute emissions rights various ways, the most straightforward of which is equal per capita emissions rights between now and 2050. Allocated in this way, western nations face a sharp challenge in reducing carbon emissions: In fact, if the USA was to continue emitting at 2008 levels, in just 6 years they would consume their entire emissions budget. The problem is that nuclear power plants take approximately 6 years from inception to completion. In other words, for the US to remain inside its carbon budget using nuclear power, it must plan and construct nuclear power plants sufficient to replace all fossil fuel based power production in just simultaneously, with design and approval of all power plants to be completed by the end of this year to have any chance of meeting the 2016 completion date. I do not say this is impossible, but it is a challenge. The problem for renewables is almost as stark. Because completion times for many renewable power plants is a matter of months to a year (for smaller plants), renewables do not need to meet the target all at once. What is more, because early constructions reduce the total emissions in a given period, the deadline is extended, and with a sufficiently fast build rate, can be extended as far as 2020. In fact, a plan to for zero emissions for stationary energy by 2010 in Australia (a nation facing a similar challenge) exists. It has been widely and rightly criticized as impractical, as relying on untried technology, and as underestimating difficulties and costs. Even if they have not underestimated costs, the estimated cost of 3% of GDP per annum for ten years would push Australia into a decade of negative economic growth, enough to make the plan politically impossible. But whatever the flaws of the plan, it at least adresses the right problem:
    "The premise of a ten-year transition is based on ‘The Budget Approach’ from the German Advisory Council on Global Change. In order to have a 67% chance of keeping global warming below 2 C above pre-industrial temperatures, on a basis of equal allocation of emissions on a per-capita basis, it would be necessary for the USA to reduce emissions to zero in 10 years. Australia has about the same per-capita emissions as the USA, and would need to pursue the same goal."
    Now, whatever the flaws of "Zero Carbon Australia", and they are many, their plan is certainly more feasible than replacing the entire power generating capacity of the nation with nuclear power plants in just six years. In fact, purely in political terms it is dubious that any Western nation could be persuaded to take the required effort. Persuading them to not only to go emission free, but to go nuclear at the same time is to send your folorn hope forward with neither guns nor ammunition. Being practical, there is no way the US or Australia will sign up to an agreement requiring them to end all emissions in 10 years (nor any hope of negotiating any agreement in less than three). So, perhaps we should be looking at the emissions reductions required on the assumption of an international emissions trading scheme, or (sadly more likely), on the West insisting that the third world surrender its emission rights without compensation to place everybody on a "level footing": As you can see, the longer we wait for peak emissions, the faster emissions must be reduced thereafter. If emissions peak in the next year or so, we are committed to replacing around 4% of stationary power generation with emissions free equivalents per annum. If they peak in five years time, that rises to 5.3%; in ten years in rises to nearly 10% replacement per annum. Again, and obviously, the speed at which we can start reducing emissions then becomes the critical decider of the practicality of a plan. Reliance on nukes means reductions to do seriously begin for from six to 8 years. IN contrast, renewables can begin reductions now. Consequently the commitment to a primarily nuclear emissions reduction program is a commitment to (probably) unsustainably high economic costs. In contrast, a program based on an initial renewables based reduction to turn the curve down as soon as possible greatly reduces the overall economic impact of the plan. It is perfectly possible that the best plan will involve, in the end, the majority of the worlds power being provided by nuclear power plants. That is something which I think can be argued. It is also something I do not need an opinion on. What I do know is that any plan that does not have renewables taking over as much as 20% of total power generation capacity in the next five years makes mitigating climate change ruinously expensive. It is possible that a 100% renewable economy could be achieved in 40 years. But the only way a near 100% nuclear economy can be achieved in the same time scale is by committing ourselves to 3 or 4 degrees of warming.
    0 0
  9. Tom Curtis If I understand you correctly, your entire argument hinges on this:
    What I do know is that any plan that does not have renewables taking over as much as 20% of total power generation capacity in the next five years makes mitigating climate change ruinously expensive.
    If so, we are indeed in trouble. There is absolutely no possibility that renewables will account for 20% of total electrical generation in the next five years.
    0 0
  10. This is wildly to overstate the emissions reductions capabilities of renewables:
    The problem for renewables is almost as stark. Because completion times for many renewable power plants is a matter of months to a year (for smaller plants), renewables do not need to meet the target all at once. What is more, because early constructions reduce the total emissions in a given period, the deadline is extended, and with a sufficiently fast build rate, can be extended as far as 2020.
    0 0
  11. All I am concerned that no-one here seems to understand the difference between absolute and relative solar energy. It is being routinely misrepresented. The deeply misleading LAGI solar map reposted (and so broadcast far and wide) by Treehugger is a fine example of bad science. Yes, 1000W/m*2 is the absolute figure. No we may not assume that a 15% efficient solar technology yields 150W/m*2. Returning to a link posted above:
    The power of raw sunshine at midday on a cloudless day is 1000W per square metre. That’s 1000 W per m2 of area oriented towards the sun, not per m2 of land area. To get the power per m2 of land area in Britain, we must make several corrections. We need to compensate for the tilt between the sun and the land, which reduces the intensity of midday sun to about 60% of its value at the equator (figure 6.1). We also lose out because it is not midday all the time. On a cloud-free day in March or September, the ratio of the average intensity to the midday intensity is about 32%. Finally, we lose power because of cloud cover. In a typical UK location the sun shines during just 34% of daylight hours. The combined effect of these three factors and the additional compli- cation of the wobble of the seasons is that the average raw power of sunshine per square metre of south-facing roof in Britain is roughly 110 W/m2,and the average raw power of sunshine per square metre of flat ground is roughly 100 W/m2. I appreciate that we do not all have the dubious honour of living in the UK. You can see some global figures here. It is disturbing that no-one noticed this fundamental error in the LAGI artwork. There are many evidently knowledgable commenters here. So this is suggestive of a strong confirmation bias at work.
    0 0
  12. Predictably, I made a mistake with the HTML above. Apologies: Returning to a link posted above:
    The power of raw sunshine at midday on a cloudless day is 1000W per square metre. That’s 1000 W per m2 of area oriented towards the sun, not per m2 of land area. To get the power per m2 of land area in Britain, we must make several corrections. We need to compensate for the tilt between the sun and the land, which reduces the intensity of midday sun to about 60% of its value at the equator (figure 6.1). We also lose out because it is not midday all the time. On a cloud-free day in March or September, the ratio of the average intensity to the midday intensity is about 32%. Finally, we lose power because of cloud cover. In a typical UK location the sun shines during just 34% of daylight hours. The combined effect of these three factors and the additional complication of the wobble of the seasons is that the average raw power of sunshine per square metre of south-facing roof in Britain is roughly 110 W/m2, and the average raw power of sunshine per square metre of flat ground is roughly 100 W/m2.
    I appreciate that we do not all have the dubious honour of living in the UK. You can see some global figures here. It is disturbing that no-one noticed this fundamental error in the LAGI artwork. There are many evidently knowledgable commenters here. So this is suggestive of a strong confirmation bias at work.
    0 0
  13. Tom Curtis wrote: "What I do know is that any plan that does not have renewables taking over as much as 20% of total power generation capacity in the next five years makes mitigating climate change ruinously expensive." Does that factor in existing nuclear? Obviously that existing capacity doesn't have to wait 6 years to come online... and isn't causing GHG problems. If we add that existing nuclear to the renewables total, we were at 19% back in 2008 according to the 2010 IEA world energy outlook. Given the boom in renewable power generation since then we must be over 20% from non-fossil fuels already. Further, given that global renewable energy production is already more than double global nuclear energy production AND growing faster than nuclear it seems likely that any losses in nuclear generation over the next five years will be more than offset by growth in renewable generation. Indeed, the way renewables have been growing I suspect we'll see at least 25% non-fossil generation by 2015 even without any sort of significant effort by world governments.
    0 0
  14. CBDunkerson Are you confusing installed renewable capacity with actual output? Where are you getting the numbers from?
    0 0
  15. DBDunkerson @213, that would be approximately 20% of existing generation capacity as additional renewable generating capacity. Obviously existing capacity at 2008 will not reduce emissions from 2008 levels. Of course existing capacity will not need to be replaced either, but I neglected that, and emissions from transport so to not clutter up the exposition. In the ideal case, enough additional renewable generation would be installed in the next six years to substitute for all growth in demand and eliminate an additional 10% of existing emissions. This is the case even if we only install new nuclear facilities after that point. If we fail to do that initial work we are committing ourselves to doubling the rate at which we eliminate emissions in the following decades.
    0 0
  16. Tom and BBD above (sorry my browser is not showing the numbers) - I think your debate is throwing the spotlight on the essence of the problem. I think it's #208 above where Tom you set out a detailed expose of the issues - thanks for a very considered view - I enjoyed reading it and found it illuminating. I've not had time to pull apart all your numbers and possibly debate the details but even if I did I very much doubt it would defeat your core premise. Unfortunately I think you are right. I can foresee no realistic scenario where renewables can pick up the baton fast enough nor can I see nuclear being allowed to do so even if it could be done fast enough (that is a little debatable I think Tom but in any event moot as the politics of nuclear acceptance won't allow any conceivable fast track) Then there is also the problem of China Which Graph 5 from World Energy outlook shows only too well :( World Energy Outlook The only remaining uncertainty with AGW is how far/how fast it will happen (and therefore how long we have got). Maybe we have a little longer than we think but that is wishing for good luck. But on the counter side BBD I'm not sure why you are so vehement that there is no possibility of renewables meeting 20% in the next 5 years? In 2008 it was 18% (admittedly 15% is Hydro which won't grow so much) according to Renewable Energy Status Wikipedia quotes the 2008 figure as 3584 TWh out of 20261 TWh - close enough to 18% to make no difference I also note that year on year growth rates from Wikipedia are encouraging? 2004 2005 2006 2007 2008 2009 895 930 1020 1070 1140 1230 GWe That's a growth rate accelerating from 4% p.a. to almost 8% p.a. If we assumed that growth rate levelled out at 8% and applied from 2009 until 2016 (5 years from now) that would give a capacity of 2108GWe. The IPCC certainly seems to think it is achievable IPCC Press Release I gather forecast demand is to grow at less than 2% per year (see page 1 2nd para) World Energy Outlook That translates into roughly 24000TWh demand in 2016 and if Renewables can grow at 8% as per above that would be a little over 6,600TWh or a little over 28%. So perhaps there is room for a little more optimism? The challenge is can renewables maintain such a high growth rate year on year? And can we limit global demand to those levels given the expansion of China and India? I don't know but can only assume the IEA and IPCC aren't complete dolts and would have taken those considerations into account?
    0 0
  17. @ Dana #193. Yes, I am aware of the geothermal moves in Kenya - it's great - and I'm not saying there aren't things happening. It's good to see that they are. I do take your point about other "externalities" - I am well aware (at a personal level) of the real health costs of burning fossile fuels which we all pay. It's one of the main arguments I use when comparing the real safety impacts of nuclear to coal - most people are unaware of how many deaths there are globally from burning fossil fuels. Of course we also don't dictate the price of energy either. But if we insist poorer nations must go renewables isn't that what we are doing? The trouble is the economy doesn't work on pricing externalities - except artificially. I guess what I am arguing is that while the price of low CO2 emitting electricty generation remains so much higher than Coal (and they are and will be for some time in the future) and that we in the west built our wealth on low cost coal we have no right to deny that to the world's poor. Did you read my link about solving energy poverty? It says (in part) It is also clear that using less energy is not the answer for the world's poorest. "In Uganda, less than 5 percent of the population has energy, it doesn't make sense to talk about energy efficiency," says Juan Jose Daboub , former World Bank managing director and founding CEO of the Global Adaptation Institute, an organization devoted to adapting to the challenges of climate change. In the starkest terms, energy, largely from fossil fuels, has freed humans and animals from labor by powering machines—it would take 100 human slaves to do the work of one gallon of gasoline. It is also about health: burning smoky fuels indoors shortens lives, and a lack of modern energy means a lack of electricity to power refrigerators to store life-saving vaccines. Those applications of energy are definitely ones we want to extend to the developing world, certainly more so than sharing our love of gadgets and cars. The trick will be doing it in a way that preserves people and the planet. I don't see a ready answer to that moral challenge from anything you've posted? The way I see it we must strive to develop low CO2 emissions technologies in the west whilst we also try and use less - and help the global poor out of poverty the best way we can - and if that means they choose CO2 emitting technologies who are we to deny them unless WE are willing to pay the difference?
    0 0
  18. Mark Harrigan #216 My doubts about renewables hitting 20% of actual generation globally are based on the underwhelming performance of wind in the UK. It is supposed to be the 'jewel in our renewables crown'. It isn't exactly shining. Back to another link posted earlier:
    2010 Renewables Target Missed by Large Margin The Renewable Energy Foundation (REF) today published an Information Note on the performance of the UK renewables sector in 2010 based on analysis of new DECC and Ofgem data (see www.ref.org.uk). The work shows that the 2010 target for renewable electricity has been missed by a large margin, and confirms longstanding doubts as to the feasibility of this target, and the still more ambitious target for 2020. The key findings are: • The UK failed to reach its 10% renewable electricity target for 2010, producing only 6.5% of electricity from renewable sources, in spite of a subsidy to renewable generators amounting to approximately £5 billion in the period 2002 to 2010, and £1.1 billion in 2010. • Onshore wind Load Factor in 2010 fell to 21%, as opposed to 27% in 2009, while offshore fared better declining from 30% in 2009 to 29% in 2010. • Although low wind in 2010 accounts for some part of the target shortfall, it is clear that the target would have been missed by a large margin even if wind speeds had exceeded the highest annual average in the last 10 years. • The substantial variation in annual on-shore wind farm load factors is significant for project economics, particularly Internal Rate of Return (IRR), and future cost of capital. • Planning delays do not appear to have been responsible for the missed target, with large capacities of wind farms, both on and offshore, consented but unbuilt.* • The failure to meet the 2010 target confirms doubts as to the UK’s ability to reach the 2020 EU Renewable Energy Directive target for 15% of Final Energy Consumption, a level requiring at least 30% of UK electricity to be generated from renewable sources.
    It might surprise Tom but I agree with his argument about speed and the inertia of nuclear and its consequences in ppmv. But renewables cannot compete with nuclear over decades. This discussion has been had already. I am not revisiting it again. You could take the view - as I do - that TC is essentially anti-nuclear and pro-renewables. And that his argument above has a strong tactical purpose: to push nuclear off the table. However reasonable it may sound on a first reading.
    0 0
  19. No response to #211 (212). Tom Curtis #201:
    Using the expected efficiencies of the Andasol solar thermal power plant in Spain, the land required to generate 16 terrawatts of power is 400,000 square kilometers. The Andasol plant can generate power for 20 out of every 24 hours.
    Earlier I said: Based on the standard estimate of 15W/m*2 for desert sited CSP: 10,000km*2 = 150GW 400,000km*2 = 6TW And that's assuming that there is absolutely nothing but CSP in every single one of those 400,000km*2. I should have been far clearer on the last point. Real-world plant power density is lower than assumed above. Vaclav Smil writes:
    Europe’s first commercial solar tower, PS (Planta Solar) 10, completed by Abengoa Solar in Sanlúcar la Mayor in 2007, is rated at 11 MWp. With annual generation of 24.3 GWh (87.5 TJ, 2.77 MW), its capacity factor is 25%. Its heliostats occupy 74,880 m2 (624 x 120 m2), and the entire site claims about 65ha; the facility’s power density is thus about 37 W/m2 factoring in the area taken up by the heliostats alone, and a bit more than 4 W/m2 if the entire area is considered. PS20 (completed in 2009) is nearly twice the size (20 MWp; 48.6 GWh or 175 TJ/year at average power of 5.55 MW and capacity factor of nearly 28%). Its mirrors occupy 150,600 m2 and hence the project’s heliostat power density is, at 36.85 W/m2, identical to that of PS10 but, with its entire site covering about 90 ha, its overall power density is higher at about 6 W/m2. Bright Source Energy’s proposed Ivanpah CSP in San Bernardino, CA should have an eventual rating of 1.3 GWp and it is expected to generate 1.08 TWh (3.88 PJ) a year and deliver on the average 123.3 MW with a capacity factor of just 9.5%. Heliostat area should be 229.6 ha and the entire site claim is 1645 ha. This implies power densities of 53.75 W/m2 for the heliostats and 7.5 W/m2 for the entire site. Again, no stunning improvements of these rates are expected any time soon and hence it is safe to conclude that optimally located CSP plants will operate with power densities of 35-55 W/m2 of their large heliostat fields and with rates no higher than 10 W/m2 of their entire site area.
    So, again but with 10W/m*2: 10,000km*2 = 100GW 400,000km*2 = 4TW To achieve 16TW would require 1,600,000km*2.
    0 0
  20. "To achieve 16TW would require 1,600,000km*2" Which, incidentally, is quite a bit less than the current global sea ice area negative anomaly.
    0 0
  21. And this is relevant how?
    0 0
  22. BBD - You keep returning to the case of the UK. I suspect that this is where you live? I would agree with MacKay (and yes, I've read the book) that the UK, due to siting, weather, and overall population levels, is not suitable for internal generation of fully renewable power - nuclear is going to be a required part of the mix there. But please - keep in mind that the UK is not the world. That's a very small portion of it, in fact - only 0.16% of world land area. You've returned to UK only statements repeatedly, which quite frankly in discussing world CO2 production is either cherry picking or rather nearsighted. The Southwestern US, North Africa, and many other regions are excellent locations for solar power. And there are many locations (Northern Europe, much of the western US, western China, etc.) where wind power is a reasonable proposition. I do understand your security concerns about power transmission, which you mentioned earlier, although in the fossil fuel economy importation has many of the same concerns. Ireland has ~11 days of gasoline, numerous other countries are in a similar position. So that's not an issue unique to renewables located in reasonable generation locations. And it's not nuclear versus renewables - that's a false dichotomy. But I believe Tom Curtis is quite correct on ramp-up speeds - beginning right now on both renewable and nuclear power expansion would be an excellent idea, with the renewables (faster incremental construction) giving more time for both technologies to pick up pace and begin replacing coal power.
    0 0
  23. KR What we agree on: - I live in the UK, and have said so several times - The UK cannot significantly displace fossil fuels with renewables (but is supposed to have the largest wind potential in Europe - yes?). - The SW US has high insolation - It's not nuclear vs renewables; this is a false dichotomy - Nuclear inertia will be offset - slightly - by fast-build renewables Where we differ: - The disappointing performance of UK wind generation is evidence that the global potential of wind is comprehensively overstated. The UK is supposed to have the best wind potential in Europe. [If anyone dares crack a funny about this, I will invoke The Moderator ;-)] - Corrected estimates of CSP footprint (recently upthread) will be of concern in Texas - Your use of the incorrect Treehugger/LAGI solar footprint estimate - You acknowledge the security concern over interconnectors, but then reiterate that North Africa is an 'excellent location' for solar plant. Contradictory.
    0 0
  24. BBD Not in order, but: "You acknowledge the security concern over interconnectors, but then reiterate that North Africa is an 'excellent location' for solar plant. Contradictory." No, I acknowledged that you had raised a security concern, but pointed out that similar concerns apply to fossil fuels now. And that we seem to manage despite such concerns. I therefore consider this a bit overstated. I had thought my statements on that clear. "The disappointing performance of UK wind generation is evidence that the global potential of wind is comprehensively overstated. The UK is supposed to have the best wind potential in Europe." Generation possibility does have to be balanced against land available. That said, I would like to see your data on the wind capacities. The recent oft-quoted Muir report has issues, such as concentrating on a couple of Scottish sites, where high winds often shut down generation altogether by exceeding turbine capacities. Looking at the Digest of United Kingdom energy statistics (DUKES), covering all power supplies in the UK, in particular Chapter 7: Renewable sources of energy, shows a somewhat different picture, noting that wind input to the power grid grew 31% between 2008 and 2009, with a metered total of 9,300 GWh supplied by on and offshore wind in 2009. --- The LAGI solar footprint estimate does appear quite overstated - but this does not change the facts that (a) significant power is available, and (b) while taking up a lot of land, there is indeed sufficient land available. I will note that discussing LAGI estimates using UK weather and insolation is not an accurate comparison! I would consider sources like the European Joint Research Commission a better resource, although they prefer to present yearly totals rather than peak power. Land use is a political issue, not a technical one - and I dare say that both renewables and nuclear face assorted political issues that can only be addressed through the public and our (ahem) enlightened leaders.
    0 0
  25. KR Thanks for your response. Agree wrt 'enlightened' leaders. They have much to learn. Wind - Fully-referenced data on 2010 wind output here. The big picture is clear. Please do not cherry pick ;-) A word to the wise. DECC is politically (and ideologically) committed to an expansion of wind that was formulated by the previous New Labour government. It is the Big Project. You must treat its presentation of 'supporting' data with caution ;-) Also, I did not quote the Muir report as it is in contention. Why do you bring it up? Your attitude to LAGI is vexing. - It is not an 'estimate', it is a misrepresentation - The error involved is of an order of magnitude - It is so elementary I suspect intent to mislead - I do not discuss LAGI using UK weather and insolation - See #219 - The calculation error in LAGI is as follows: This is the relevant section of the original LAGI article, which Treehugger does not quote in full. The error and its propagation are highlighted:
    We can figure a capacity of .2KW per SM of land (an efficiency of 20% of the 1000 watts that strikes the surface in each SM of land). So now we know the capacity of each square meter and what our goal is. We have our capacity in KW so in order to figure out how much area we’ll need, we have to multiply it by the number of hours that we can expect each of those square meters of photovoltaic panel to be outputting the .2KW capacity (kilowatts x hours = kW•h). Using 70% as the average sunshine days per year (large parts of the world like upper Africa and the Arabian peninsula see 90-95% – so this number is more than fair), we can say that there will be 250 sun days per year at 8 hours of daylight on average. That’s 2,000 hours per year of direct sunlight. Therefore, we can multiply each square meter by 2,000 to arrive at a yearly kW•h capacity per square meter of 400 kW•h. Dividing the global yearly demand by 400 kW•h per square meter (198,721,800,000,000 / 400) and we arrive at 496,804,500,000 square meters or 496,805 square kilometers (191,817 square miles) as the area required to power the world with solar panels. This is roughly equal to the area of Spain.
    The assumption is that 200W/m2 insolation (correct for desert-sited solar plant) is converted with 100% efficiency by the panels 10% is a reasonable average. If we calculate correctly: 10,000km2 = 100GW 400,000km2 = 4TW To achieve 16TW would require 1,600,000km2. With a generous assumption of 15%: 10,000km2 = 150GW 400,000km2 = 6TW To achieve 16TW would require 1,066,666km2. The LAGI solar map should be withdrawn. Imagine if it was a climate graph, created by some outfit somewhere and then broadcast far and wide by WUWT. What would the reaction be on this site? In fact, what is this site supposed to be for? Frankly, I'm not impressed. Why wasn't the error spotted by the 'science editor' at Treehugger (it took me a couple of minutes)? And why does no-one here acknowledge the fault instead of defending this stuff? Which, I note, is in wide circulation now.
    0 0
  26. BBD seems intent on making a fool of himself over treehugger's figures. To be quite clear, LAGI as quoted by tree hugger uses a conservative calculation to determine that appropriately located, approximately 500,000 square kilometers could supply the worlds estimated total energy needs by 2030. They rely on a US Department of Energy estimate that 678 quadrillion BTU's, or approximately 23 terawatts, averaged over the whole year. To put that into perspective, BBD's much quoted Griffiths quotes 15,000 square miles or approx 40,000 square kilometers of CSP being able to produce 2 terawatts, or 460,000 square kilometers to produce 23 terawatts. In other words, his own source produces a figure 8% more optimistic than LAGI. Despite this, in BBD's opinion, Griffith's estimate is "far more realistic" while LAGI's is "seriously amiss" and "out by an order of magnitude". To compound the confusion, BBD himself calculates, by "generous[ly] assum[ing]" a 15% efficiency, efficiency rates already being exceeded, he calculates that 400,000 km^2 is required for 6 terawatts, or over 1.5 million square kilometers for 23 terawatts, more than three times LAGI's and the "far more realistic" Griffith's figures. I'm not sure how he turns three times greater into a order of magnitude, so I'll leave that for him to explain. I'll take a different approach. Consider the annual average surface insolation of Europe: This chart shows insolation after seasonal averaging, after adjustment for latitude, and after the effects of the diurnal cycle, and of local weather including clouds. So, let's consider the south of Spain, which receives 1800 plus kWh/annum, or 205 Watts averaged over the year. Therefore, if all our solar power plants were located in similar conditions, with 15% efficiency, we would require 750,000 square kilometers to provide 23 terawatts of electricity. Indeed, even at Berlin (or London) with 1000 plus kWh/annum, at 15% efficiency, it would only take 1.35 million square kilometers or 10% less than BBD's estimate for deserts. Of course, these figures as calculated are no more an endorsement of the LAGI figures than of BBD's. But nor would I expect them to be. The insolation figures used are for a flat plate laid horizontal to the ground. If we, for example, align our trough collectors on a north-south axis, and than rotate them to track the sun during the day, loss of insolation due to solar altitude is largely eliminated except near dawn and dusk. Alternatively, we can angle flat mirrors to be perpendicular to the suns rays eliminating the geometric effects of latitude and time of day during daylight, again greatly increasing efficiency. In other words, LAGI's figures are very reasonable, and in fact, conservatively calculated. BBD will no doubt now accuse me of renewables boosterism and of not know the difference between relative and absolute solar energy. After all, he made the same accusation against LAGI even though they explicitly accounted for all relevant factors. But that is not enough for BBD. You have to also assume that you cannot angle collectors for solar angle your else, in his opinion, your maths is just not up to scratch.
    0 0
  27. Tom The LAGI stuff is wrong. It assumes a 100% panel efficiency. This is absolutely clear from my post above. Nothing else is terribly relevant. Let's stick to the facts. LAGI is wrong, as described. Your response to that fact is all that is necessary here. Anything else might be seen as an attempt to obfuscate and distract.
    0 0
  28. In your haste, you have misread my post. I calculate only for a maximum of 16TW. That makes the scale of the error in LAGI significantly worse, of course.
    0 0
  29. Tom If I'm so wrong about LAGI, how do you explain this? The erratum is that the square should be half-filled, not one third filled with CSP.
    0 0
  30. From LAGI:
    "We can figure a capacity of .2KW per SM of land (an efficiency of 20% of the 1000 watts that strikes the surface in each SM of land).">
    (My emphasis) From BBD:
    "The LAGI stuff is wrong. It assumes a 100% panel efficiency."
    So we determine that in BBD world 3 = 10 (see above about order of magnitude) and 20% = 100%. Perhaps this will convince him:
    "The combined effect of these three factors and the additional complication of the wobble of the seasons is that the average raw power of sunshine per square metre of south-facing roof in Britain is roughly 110 W/m2, and the average raw power of sunshine per square metre of flat ground is roughly 100 W/m2."
    (quoted from BBD) Watts per meter squared of sunshine * efficienncy * 1 million = Watts accumulated per km squared = 100 *0.15 * 10^6 = 15 MW/km^2 23 terawatts/15 mw = approx 1.55 million square kilometers of 15% efficient solar panels laid flat, in England to produce 23 terawatts, ie, the equivalent amount as for BBD's supposedly accurate calculation for subtropical deserts. And from BBD again:
    "It is disturbing that no-one noticed this fundamental error in the LAGI artwork. There are many evidently knowledgable commenters here. So this is suggestive of a strong confirmation bias at work."
    Which is very interesting, except that the fundamental errors are his, with LAGI not differing greatly in their calculations from equivalent calculations by his preferred experts. This probably is suggestive of "a strong confirmation bias", but in looking for it, it is about time BBD looked in a mirror.
    0 0
  31. Tom The basic calculation of capacity needs: 1) Energy density of the renewable resource 2) Conversion efficiency of the generation technology LAGI gives (1) as .2kW/m2, correctly IMO. But for clarity, let's write it as 200W/m2. The missing step is that (2) conversion efficiency is not calculated. Instead LAGI uses the value of (1) 200W/m2:
    We have our capacity in KW so in order to figure out how much area we’ll need, we have to multiply it by the number of hours that we can expect each of those square meters of photovoltaic panel to be outputting the .2KW capacity (kilowatts x hours = kW•h).
    In the real world, large-scale SPV is doing well to achieve a 10% conversion efficiency. CSP is often claimed to do better, but may not because of packing density issues. These are most pronounced with solartropic arrays. And yes, these do become significant to footprint as you scale up (see #219).
    0 0
  32. BBD @229, doing the maths on David Mackay's formula, a 500,000 km^2 area (the area proposed by LAGI) would provide 25 terawatts of power on average over the year, 2 terawatts more than is calculated by LAGI. So, again, LAGI is more conservative than David Mackay (and don't site any of their generating capacity in England).
    0 0
  33. And Tom, let's keep it polite. One of us is mistaken. We can reason together and work out who it is without the personal stuff.
    0 0
  34. Tom #232 Please show your workings - thanks.
    0 0
  35. Also please respond to #231, which is the heart of it. If one of us is mistaken, it is presumably about this.
    0 0
  36. Tom
    23 terawatts/15 mw = approx 1.55 million square kilometers of 15% efficient solar panels laid flat, in England to produce 23 terawatts, ie, the equivalent amount as for BBD's supposedly accurate calculation for subtropical deserts.
    Agreed: - 23TW/15MW = 1,533,333 km2. But - MacKay uses a 15W/m2 energy density for desert sited CSP. Not UK sited. So, after MacKay: 1 km2 = 15MW 10,000 km2 = 150GW 100,000 km2 = 1500GW (1.5TW) 500,000 km2 = 7500GW (7.5TW) How does LAGI get 23TW from 500,000 km2? - By omitting the conversion efficiency and using 200W/m2. A realistic and fair efficiency estimate for SPV and CSP in large arrays is ca 10%. This works out as: 10,000km2 = 100GW 500,000km = 5GW The magnitude error I referred to is in the failure to convert the raw energy density of 200W/m2 down to 20W/m2. In practice, it would be lower still: ~10W/m2. 1) If there are errors here, please point to them 2) If they are mine, I will of course acknowledge them 3) If MacKay is in error, let's work together on a draft email to him pointing them out 4) If LAGI is in error, you need to admit it
    0 0
  37. Typo:
    A realistic and fair efficiency estimate for SPV and CSP in large arrays is ca 10%. This works out as: 10,000 km2 = 100GW 500,000 km2 = 5000GW (5TW)
    Apologies.
    0 0
  38. Who is trying to find 1,550,000 or even 500,000 km2 of land in England?
    0 0
  39. BBD @236 read 230 (and David Mackay) again. David Mackay quotes 100 Watt insolation per meter squared laid flat in England. 100*0.15 efficiency times 1 million meters squared per km squared = 15 million Watts collected (not incident, but collected) energy at 15% efficiency by a km squared of pv or csp laid flat in England. If you could (per impossible) find 1.5 million square km in England on which to collect solar power, that would collect the 23 terawatts averaged over a year. Alec Cowan @238, nobody is trying to find impossibly large amounts of land in England. I am making a rhetorical point that BBD is assuming the relative efficiency in solar power in England for his calculations of that efficiency in North Africa.
    0 0
  40. BBD @231: LAGI gives the conversion efficiency (2) as 0.2 and then determines the energy density (1) by factoring in only 2000 hours in the year (28%) as providing direct sunlight and assuming the collectors are angled to the sun to maintain maximum efficiency throughout the day. Both are very reasonable assumptions (indeed very conservative) for North African deserts and similar locations.
    0 0
  41. BBD - I have to agree with Tom Curtis. The LAGI assumptions of 20% efficiency, 2000 hours per year (just under 50% of sunlight hours, by my calculations) are quite reasonable for desert areas, and not out of line. Off-equator sites would have to be proportionally larger, which the LAGI images do not show, but with 20-30% or so by my calculations. You have repeatedly used UK power levels and cloudiness to argue against desert solar - which is wholly appropriate. The security issue you raised is one that we've dealt with for decades, with most countries having between 90 (France) and 10-11 (Ireland) days of gasoline on hand - I dare say that we can handle that with electricity too, especially if individual countries have some generation capacity on hand. You keep returning to UK, and UK only - that's less than 0.2% the land area of the Earth - you are focusing on local issues rather than global.
    0 0
  42. Tom Curtis KR Neither of you has understood the argument summarised at #236. In fact you do not even appear to have read it. Try again please.
    0 0
  43. Dump all preconceptions. Clear the mind and start afresh: #236
    0 0
  44. Tom You are making a hash of this. I think you should take deep breath and slow down a little.
    BBD @236 read 230 (and David Mackay) again. David Mackay quotes 100 Watt insolation per meter squared laid flat in England. 100*0.15 efficiency times 1 million meters squared per km squared = 15 million Watts collected [etc]
    No. See here. Please read and re-read this until you have absorbed its meaning completely.
    "All the world’s power could be provided by a square 100 km by 100 km in the Sahara.” Is this true? Concentrating solar power in deserts delivers an average power per unit land area of roughly 15 W/m2. So, allowing no space for anything else in such a square, the power delivered would be 150 GW. This is not the same as current world power consumption. It’s not even near current world electricity consumption, which is 2000 GW. World power consumption today is 15 000 GW. So the correct statement about power from the Sahara is that today’s consumption could be provided by a 1000 km by 1000 km square in the desert, completely filled with concentrating solar power. That’s four times the area of the UK. And if we are interested in living in an equitable world, we should presumably aim to supply more than today’s consumption. To supply every person in the world with an average European’s power consumption (125 kWh/d), the area required would be two 1000 km by 1000 km squares in the desert.
    Let's be absolutely clear: - MacKay uses 15W/m2 energy density for desert sited CSP - Based on this assumption, the area of desert sited CSP required to provide 23TW is 1,533,333 km2. Unless you can show that there is an error here, you must concede this point.
    LAGI gives the conversion efficiency (2) as 0.2
    [Please state units in further discussion.] No. LAGI does not use a conversion efficiency. It uses 0.2kW (insolation) and omits the panel conversion efficiency entirely. Once again, here is where they make the mistake:
    We have our capacity in KW so in order to figure out how much area we’ll need, we have to multiply it by the number of hours that we can expect each of those square meters of photovoltaic panel to be outputting the .2KW capacity (kilowatts x hours = kW•h).
    Look: "the .2kW capacity". See? That's 200W/m2. Based on real-world installations, you're doing well to get 15% and it doesn't matter if it's SPV or CSP (well, actually it does - CSP is the better choice. What matters is that the conversion efficiency has not been factored into the LAGI analysis. That's why they think you can get 23TW out of 500,000 km2 and MacKay knows it will take ca 1.5 million km2 of desert sited CSP I repeat: you are rushing and being careless. Read this again. Then go back and read #236.
    0 0
  45. KR
    You keep returning to UK, and UK only - that's less than 0.2% the land area of the Earth - you are focusing on local issues rather than global.
    I have always been clear to distinguish between UK and global issues (eg in discussion of wind power above). This is a misrepresentation. Your reading of the discussion above is similarly careless. Time to sharpen up.
    0 0
  46. @BBD #236 How do you get all your numbers so round, even in your errata? It sounds pretty much like 100 scientist found 1000 reasons for temperature not raising 1 degree (Celsius/Kelvin, Fahrenheit, Réaumur, who cares?) in the next 100 years. With such figures, does anyone need to point what is wrong? I think not. 30 Helens would agree.
    0 0
  47. BBD, KR and I have both read 236. What is more, I adressed your arguments in 236 directly and found them to be without foundation. Disagreeing with you is not the same thing as not having read your comments or understood them. If anything, it is rather the opposite, a sign of both having read and understood what you say. To review: 1) Mackay quotes an average annual insolation rate in England of 100 Watts/m^2 after allowing for the effects of latitude and weather. A 15% efficient collector in England will therefore collect 15 Watts/m^2 even if laid flat on the ground. 2) Mackay also quotes an average annual capacity of 15 Watts/m^2 for concentrated solar in North African deserts. You have provided no explanation for this discrepancy. 3) LAGI quotes a 20% efficiency of collection. For comparison , the Andasol 1, 2 and 3 plants have a 28% peak efficiency and an annual average of 15%, so 20% is reasonable. 4) LAGI quote a thousand Watts of direct sunlight for 2,000 hours (23%) of the year for a total of 2,000 kWh/m^2 of direct sunlight per annum. For comparison, the Andersol plants experience per annum from 2,136 kWh/m^2 per annum in the south of Spain, so again the LAGI figures are conservative with areas in North Africa likely to experience much more both because of higher solar intensity and fewer cloud days. 5) From this LAGI calculate an electricity production of 400 kWh/m^2 per annum. For comparison, the Andasol plants achieve 350 kWh/m^2 per annum, so again the LAGI calculated value is reasonable. Indeed, with much of North Africa experiencing 17% more annual insolation than the south of Spain, that alone would lift an Andasol style plant in North Africa to 400kWh/m^2. I have to admit to being perplexed by Mackay's insistence on using a power generation factor of 15 W/m^2 in desert, until I stumbled on his description of the efficiency of the Andasol plant, which he gives as 10 W/m^2. In fact the Andersol plants achieve 41 W/m^2 of solar field averaged over the year, four times the amount Mackay quotes. The reason is evident, the solar field of the Andersol plants occupy just one quarter the site area. Mackay is calculating the efficiency relative to the site area rather than to the solar field. It is a rather underhanded way to deflate the actual efficiencies of solar plants. It is underhanded because, unlike in the south of England, in the south of Spain, and certainly in North Africa, the cost of land is so little as to be an almost negligible component of the overall cost. If it were not, it would be trivially easy to inflate the efficiency of power production per unit site area at a cost to the efficiency of power production per unit of solar field area. One obvious mechanism is to have adjacent troughs, with every second trough going to a neutral, non-shadow generating position when the sun is low in the sky, thus making the solar field almost equal in area to the site area most of the day, while halving efficiency relative to solar field area for a few hours on either side of dawn and dusk. Another method would be to have a continuous field of fixed shallow parabolic troughs with the collector moved during the day to remain in the focal point. In fact, if land area (rather than solar field area) where a real concern, it would probably be better to space the troughs further apart to allow more sunlight to the ground. The area between and under the troughs could then be used to grow fast growing grasses either for pasture or biofuel, thus gaining dual use of the land. None of these measures is considered worthwhile for the simple reason that the land itself is too small a cost to make such measures worthwhile. Mackay, in other words, is inflating a trivial cost as an artificial impediment to solar power. So, I'm happy to dump all preconceptions and start with an open mind, but you will not take me in with a shell game.
    0 0
  48. BBD @244, quotes Mackay as saying:
    ""All the world’s power could be provided by a square 100 km by 100 km in the Sahara.” Is this true? Concentrating solar power in deserts delivers an average power per unit land area of roughly 15 W/m2. So, allowing no space for anything else in such a square, the power delivered would be 150 GW. This is not the same as current world power consumption. It’s not even near current world electricity consumption, which is 2000 GW. "
    (my emphasis) Ignoring the irrelevance given that LAGI calculate an area of approx 500,000 km^2, not 10,000 km^2 (100*100), we now know that when Mackay writes "allowing no space for anything else" he actually means "using just one quarter of that space for the solar field". We also know that he arbitrarily and with no justification given excludes any possibility of dual land use, at least in that calculation. (At another point in the book he points out that wind and solar power can occupy the same land footprint with very little loss of efficiency for either, then brushes it of. Clearly offshore wind and wave power can also take advantage of shared location with no efficiency loss in generation, and efficiency gains for transmission.) However, I do admit that my 232 was in error, partly because I did not note Mackay's mistaken figure of 1/3rd land used when he meant 1/2, but mostly because I made an error due to tiredness (at 3:41 am).
    0 0
  49. Tom I'm getting fed up with this:
    2) Mackay also quotes an average annual capacity of 15 Watts/m^2 for concentrated solar in North African deserts. You have provided no explanation for this discrepancy.
    See #244, third from last paragraph. Follow the link at "it doesn't matter if it's CSP or SVP". Read, and inwardly digest.
    3) LAGI quotes a 20% efficiency of collection. For comparison , the Andasol 1, 2 and 3 plants have a 28% peak efficiency and an annual average of 15%, so 20% is reasonable.
    How do you do it? How can you read a crystal-clear explanation of how LAGI gets it wrong and still come back with this? It is clear that you are not reading my comments. You have one of the most relentlessly closed minds I have encountered for a while. You need to open up a bit. you will not take me in with a shell game.. Good grief. The only person deceiving you is yourself. Stop muddling. Start thinking. Go back and read #236 and #244. It's all there.
    0 0
  50. Tom MacKay is Mr Renewables. He's a big fan. Why would he do this?
    It is a rather underhanded way to deflate the actual efficiencies of solar plants.
    Why? He's also a professor of physics at Cambridge. And the chief scientific advisor to the UK Department of Energy and Climate Change (DECC). But, yes, of course he's talking through his hat and you are entirely correct. Go back, and read #236 and #244 again. Carefully. And read Mackay's chapter 25 thoroughly including end notes. Your work here is sloppy.
    0 0

Prev  1  2  3  4  5  6  Next

You need to be logged in to post a comment. Login via the left margin or if you're new, register here.


The Consensus Project Website

THE ESCALATOR

(free to republish)


© Copyright 2024 John Cook
Home | Translations | About Us | Privacy | Contact Us