The last time carbon dioxide concentrations were around 400ppm: a snapshot from Arctic Siberia
Posted on 14 May 2013 by John Mason
Synopsis
During the late Pliocene and early Pleistocene Series of the Cenozoic Era, 3.6 to 2.2 Ma (million years ago), the Arctic was much warmer than it is at the present day (with summer temperatures from 3.6-3.4 Ma some 8oC warmer than today). That is a key finding of research into a lake-sediment core obtained in Eastern Siberia, which is of exceptional importance because it has provided the longest continuous late Cenozoic land-based sedimentary record thus far. The sedimentary sequence dates from recent times back to 3.6 Ma when the lake was formed by a large extraterrestrial impact. During the warm period, atmospheric carbon dioxide concentrations were close to those of today, at around 400 parts per million, indicative of a strong climate sensitivity signal in the Arctic, which has again warmed very rapidly in recent decades. The lake sediment record has thus provided us with a snapshot of how the Arctic may look in the near future.
Introduction
Geologists divide geological time into Eons (the longest divisions), Eras, Systems and Series. The Pliocene (5.333-2.588 Ma) is the final Series of the Neogene System and the Pleistocene (2.588 Ma-11,700 years ago) is the first Series of the Quaternary System, both being part of the Cenozoic Era, the latest Era of the Phanerozoic Eon.
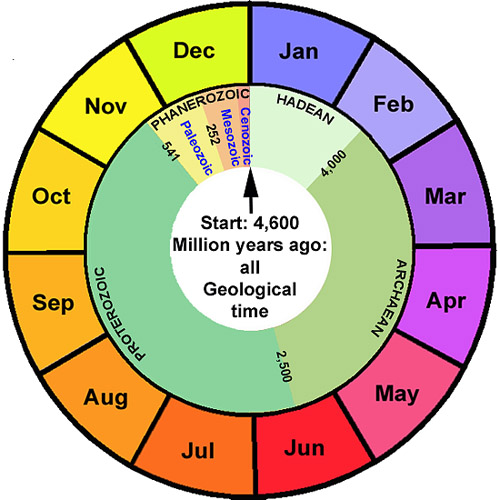
Just to get that into context, here is all of geological time plotted against the human 12-month calendar year, so that geological time starts on the first second of New Years' Day and the present is the last second of New Years' Eve. On such a scale, the whole Cenozoic Era equates to a tiny bit of late December!
So let's zoom in by doing the same exercise just with the Cenozoic Era. Now the Pliocene and Pleistocene Series occupy December, although the most recent Series, the Holocene - from 11,700 years ago to now - is such a short timeframe that it remains invisible in among the last seconds of New Years' Eve!
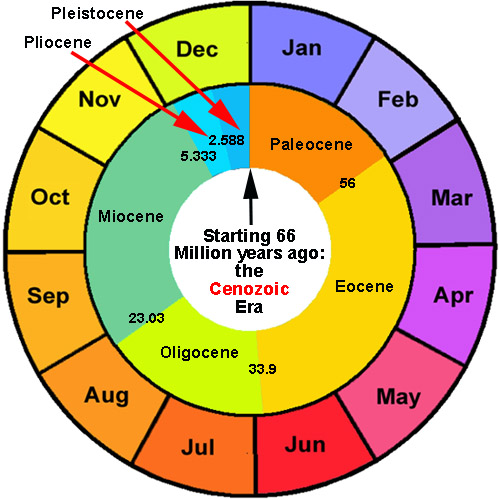
Numbers: millions of years ago. Data: International Commission on Stratigraphy. Graphics: author.
To set the scene, the Pliocene and Pleistocene Earth had a very similar geography to that of the present day in terms of the distribution of continents, with the closure of the Panama Isthmus, forming a land-bridge between North and South America, being a significant development around 3 Ma. The cooling climatic trend that had been underway since the early Oligocene (33 Ma) continued down into the alternating series of glacials and interglacials later in the Pleistocene. Pliocene and early Pleistocene sea levels were significantly higher than those of the present day, with marine sedimentary rocks belonging to this time occurring on land in various parts of the world. Here in the UK, the lower Pleistocene Red Crag Formation, with a well-preserved fossil fauna of bivalves and other shells, many of familiar types, forms extensive cliffs along parts of the East Anglia coast, bearing testament to those higher sea-levels.
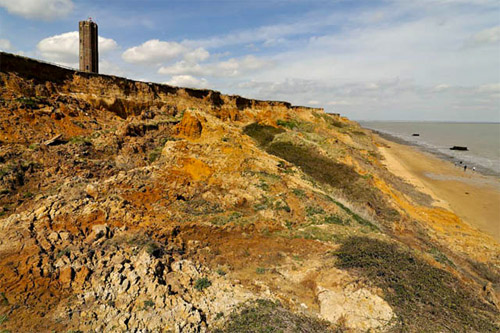
above: landslip-prone cliffs of lower Pleistocene Red Crag Formation, Walton-on-the-Naze, Suffolk, UK. Photo: author.
The cooling occurred gradually and in a stepped fashion. Warmer and cooler periods, but with an overall cooling trend, occurred throughout the Pliocene and up until the so-called Mid-Pleistocene Transition on cycles of ~41,000 years: the cyclic pattern being due to orbital or Milankovitch Cycles. Following the Mid-Pleistocene Transition, a 100,000 year glacial-interglacial cycle predominated.
The cyclic, alternating warm and cool periods each left their mark on the marine oxygen isotope record, something that was first predicted in a 1947 paper by chemist and paleoclimatology pioneer Harold Urey. Oceanic sediment cores show that the ratios of the isotopes oxygen 16 and 18, as measured in the calcite shells of fossil foraminifera, vary through geological time with temperature. This is because oxygen 16 (in water vapour) is more easily lost to the atmosphere during ocean evaporation: in turn, during cold cycles, much more of it gets trapped in snow and ice. Hence, the O16/18 ratio varies at any given time depending on the volume of ice present on the planet.
Via the detailed record of warm and cool climatic stages that has been reconstructed using oxygen isotope data going back through time, each warm or cool period has been given a Marine Isotope Stage number, starting with the present Interglacial, which is Marine Isotope Stage 1. Because the sequence begins with a warm stage, other warm stages have odd numbers and cool stages have even numbers. It's worth mentioning what these Stages are because they are referenced so frequently in the research itself.
The research: Pliocene Warmth, Polar Amplification and Stepped Pleistocene Cooling Recorded in NE Arctic Russia
Lake El'gygytgyn, pronounced El-Guh-Git-Kin (but commonly called 'Lake E'!) is located in the northeast Russian Arctic, 100 kilometres north of the Arctic Circle. It was formed at 3.6 Ma when an extraterrestrial object estimated to be about 1km in diameter impacted, blasting out a crater some 18 kilometres in width. After the impact, the crater filled with water and sedimentation commenced. The lake is up to 170m deep and beneath its floor there occur bedded lake sediments some 300m in thickness that cover the impact-shattered volcanic rocks (termed impact-breccia), of Cretaceous age. For a detailed geological description of the crater, the following reference gives an interesting read:
http://www.geo.umass.edu/lake_e/publications/Gutrov2007.pdf
Skeptical Science has covered research at this lake before here, but on May 9th 2013 a new paper was published in the journal Science that gives more details of the core and the paleoclimatic evidence it is yielding up. Written by an international team (lead writer: Julie Brigham-Grette of the University of Massachusetts Amherst), the paper describes how drilling was done from an artificially-thickened ice-platform on the lake early in 2009, with resultant cores covering a complete 3.6 million year record spanning 318m of sediments. That is an impressive accomplishment: the record preserved by the Greenland ice, as sampled by ice-coring, stretches back no more than ca. 140,000 years.
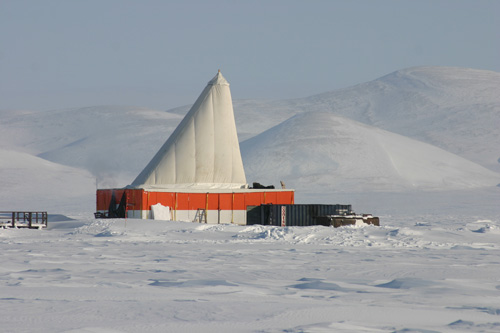
above: the 100-ton drilling-rig on the lake. The ice had to be artificially thickened to over 2m in order to safely take the weight. Photo: Jens Karls.
The part of Siberian Russia in which the lake is situated is one of the few areas of the Arctic that were not glaciated (and thereby glacially eroded) during the later Pleistocene glaciations. This is why the sedimentary record is so well-preserved at 'Lake E': glaciers are thuggish things that move lots of boulders and other heavy debris around, so only non-glaciated environments have much chance of staying undisturbed for such a long time.
The drillcore revealed that the lake sediments are pelagic in nature, i.e. they were deposited very slowly as fine, clay-sized sediment particles settled out of suspension. Think of how a muddly puddle slowly clears up if left undisturbed and you have the picture. Sediment would have been supplied via the streams that flow into the lake and by windblown dust.
For the first ca. 20,000 years following the impact, the sediments reveal few signs of life, but after that there exists a rich assemblage of fossil pollen. The pollen allowed the team to reconstruct the types of vegetation living around the lake, and how it changed through time in response to changes in temperatures and precipitation. Many plants that thrived there in the past, such as the Douglas Fir and Hemlock that are typical of Boreal forests, do not do so today: the area is currently tundra dominated by mosses with stunted trees such as prostrate willow and dwarf birch and is underlain by permafrost.
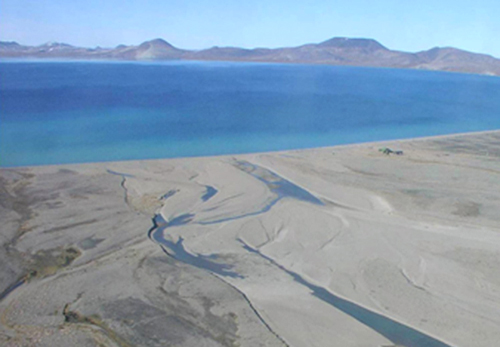
above: Lake El'gygytgyn in the summer. Photo: Julie Brigham-Grette
The paper reports that the pollen reconstructions show that the climate of the area in the middle Pliocene, between 3.6 to 3.4 Ma, was much warmer than that of today. The mean temperature of the warmest month of the year was +15-16oC compared to +8oC today. Rainfall, indicated by the influx rates of sediment, was also substantially greater in the past at 600mm/year compared to the 200m/yr average of today.
Cooling events did occur during the late Pliocene: the largest occurred between 3.31 and 3.28 Ma, when steppe-like habitats developed around the lake. This event, a punctuation mark in the overall warm theme, is thought to have been related to a period in which the influence of the North Atlantic Current declined significantly. However, from 3.26 to 2.6 Ma, warm and moist conditions prevailed, with warmest month temperatures 3-6oC greater than those of today.
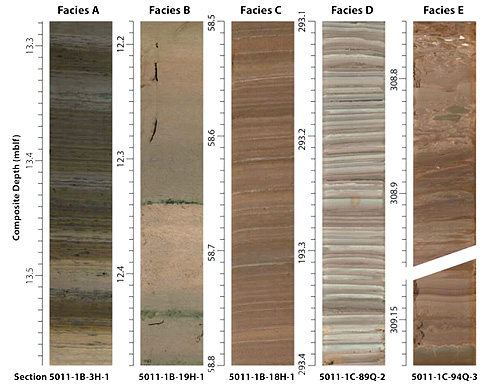
above: sections of drillcore from Lake El’gygytgyn. Five distinct facies (sediments with specific sets of characteristics) are present. Facies A, only noted at intervals during the Pleistocene, was deposited in the presence of perennial lake-ice cover. Facies D and E are restricted to the Pliocene. Image from the supplementary material for Brigham-Grette et al, 2013.
The first sign in the lake sediments of cyclic cold spells (glacials), driven by changes in insolation via the orbital Milankovitch Cycles, appears at 2.6 Ma, with such conditions becoming relatively common from 2.3 Ma onwards. The indicator is a change in sediment characteristics (termed 'facies') indicative of the periodic development of year-round lake ice-cover. However, only from 1.8 Ma onwards do all cold cycles produce sediments indicative of perennial ice cover. Thus, the transition from the warmth of the Pliocene down into the cold of the later Pleistocene occurred in a stepwise fashion. The stepwise pattern was also reflected by the vegetation: conifers disappear from the record at 2.71-2.69 Ma and the period 2.6 through to 2.53 Ma saw the transition from forest to a treeless, shrubby environment as the protracted warmth came to an end. By 2.2 Ma, Arctic summers during the warm cycles were - predominantly - no warmer than at present.
That these initial cold cycles were not as drastic as those later in the Pleistocene is also evidenced by sea level variability across individual cycles of only ~70m, compared with ~125m for Marine Isotope Stage 2 - the last glacial maximum.
Another interesting discovery that warrants inclusion in this piece, although it features in an older (2012) paper by the same team, is that 'Lake E' also records the fact that during the Pleistocene there occurred a number of 'super-interglacials'. An example is Marine Isotope Stage 31 which occurred at about 1.07 Ma and in which temperatures in the area were some 4-5oC warmer than present. Climate simulations have difficulty in producing such a degree of warmth with the then greenhouse gas and orbital (Milankovitch) forcings alone, suggesting there must be some other factor at work, such as amplifying feedbacks.
The fact that the sheer amount of Arctic warming that occurred exceeds that simulated by climate models is both interesting and somewhat worrying: Arctic Amplification has only emerged as a realtime signal in recent years and, as the graph below indicates, modelling has not handled its effects particularly well with Arctic sea-ice degradation being a classic example.
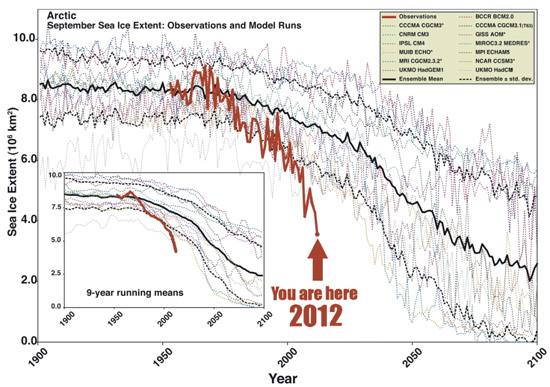
above: observed Arctic sea-ice extent (thick maroon line), with the other lines being modelled forecasts and the thicker black line being their mean. When someone tells you that the models don't get it right, it's worth pointing out that this works both ways!
At the other end of the world, investigations into this 400ppm carbon dioxide world of the past have yielded other indications of the type of world we are heading into. Sediment cores obtained during the ANDRILL drilling programme yielded results with which the 'Lake E' data are in good agreement. Writing in Nature in 2009, concerning an early (5-3 Ma) Pliocene Antarctic sediment core section, Naish et al note:
Our data provide direct evidence for orbitally induced oscillations in the WAIS [West Antarctic Ice-Sheet], which periodically collapsed, resulting in a switch from grounded ice, or ice shelves, to open waters in the Ross embayment when planetary temperatures were up to approx 3 °C warmer than today and atmospheric CO2 concentration was as high as approx 400 p.p.m.v.
A second 2009 paper in Nature compared simulations of past Antarctic ice-cap behavour with the sedimentary history obtained from drillcore and determined that the West Antarctic Ice-Sheet had undergone major and perhaps total retreat during Marine Isotope Stage 31 and in other super-interglacials. The fact that there exists strong evidence for past major warming and its consequences in both polar regions suggests an interconnectivity between the poles, with the implication that these are effects occurring on a global scale.
2013 almost certainly marks the first year, since the Pliocene, in which rising carbon dioxide concentrations have breached the 400ppm milestone. What next? As Julie Brigham-Grette notes:
"This could tell us where we are going in the near future. In other words, the Earth system response to small changes in carbon dioxide is bigger than suggested by earlier climate models."
To conclude, the Arctic climate response to warm forcing agents is to warm more than models would predict, with other poorly-constrained amplifying feedbacks the likely culprits, and what goes on in the Arctic tends to be reflected in due course by what goes on in the Antarctic. Past warming events during the Pleistocene and Pliocene have seen ice-cap collapse in both areas. Readers will be familiar with the figures: it is estimated that the collapse of the West Antarctica and Greenland ice-sheets would lead to getting on for fourteen metres of sea-level rise over a number of centuries. The results of the studies discussed above show that such events are compatible with a world in which the atmosphere contains ~400ppm of carbon dioxide. How, then, will Marine Isotope Stage 1 (the current interglacial) pan out? It's up to us to decide that one.


 Arguments


John Mason:
Kudos on an excellent article combining a very well written text with outstanding graphics.
LINK
The above link shows other values for CO2 concentrations beside Mona Lau. When did the measurements in Hawaii become the standard? Are these others even valid?
[RH] Fixed link that was breaking page format.
Hi, Why CO2 is a greenhouse gas while CO and N2 are not?
HJones - See the replies to Becks paper by Keeling and Meijer. Short answer: Beck made measurements at ground level, seriously contaminated by local effects, whereas the Mauna Loa (proper spelling!), Antarctic, mid-ocean, and other measures are a far more accurate background measure with care taken to avoid industrial influences. Becks methods were inappropriate, and his measurements are accordingly of little worth WRT global CO2 levels.
I suggest looking at the more accurate and widespread CO2 measures than Beck's work - it's a brief video, well worth watching.
HJones @2, the following are CO2 concentrations as measured by an aircraft in Colorado in 2004:
You will notice that while the measurements above 500 meters consistently record CO2 concentrations around 375 ppmv, those below that altitude are very variable, and much larger. That is because the CO2 concentrations below 500 meters are contaminated by local sources of CO2 (mostly forests), whereas above 500 meters the CO2 from local sources has become diluted, leaving the local concentration at the background level.
This is the problem with Beck's measurements. While accurate, they are also contaminated by local sources of emissions. Beck lumps all the measurements together without regard to whether they were taken in enclosed rooms (which can have CO2 concentrations up to 1000 ppmv with poor ventilation), in industrial cities, or in forests (which absorb CO2 in the day time, but emit it at night). He also does not distinguish between CO2 measurements in autumn (when decaying vegetation elevates local CO2 concentrations) or spring (when new growth depresses it). Because he simply ignores these relevant and well known facts, Beck's paper is propoganda, not science.
In contrast, the Mauna Loa measurements are taken at altitude away from industrial sites and forests, and only when the prevailing winds prevent contamination from the local volcano. They agree with measurements taken from many other remote sites including the South Pole.
Saadi Aubydi @3, of topic, but the short answer is that N2 and O2 are not greenhouse gases because there is no charge imbalance between the two components of the molecule. That renders the gases transparent to IR radiation. Carbon Monoxide (CO) is a weak greenhouse gas because, although it does have a charge imbalance, because it only has two molecules it is limited in the sort of vibrations it can perform, meaning it does not absorb IR radiation at the main frequencies of emission within the Earth's atmosphere. This is explained in more detail here.
HJones, this horse has been beaten to death. Beck is not, and never was, a reliable source of information. The pdf you linked is not a peer-reviewed science article (it appeared in E&E but that does not qualify, sorry).
Beck's "reconstruction" is based on inaccurate methods. Furthermore, it states that there were swings in CO2 atmospheric concentration as large as 290ppm to 470ppm in 15 years. That by itself is beyond ludicrous. There is no industrial process and no known biological process that could lead to such a change in that short a time. And it's not like Beck placed this in a past devoid of humans observing the planet, it's supposed to have happened mid-20th century.
Nonetheless, let's imagine that some immense biological process took place in a totally silent way except for the CO2 fluxes. If such evens had really happened, it would have to leave an enormous C13 signature, but that is nowhere to be found. The whole thing is a pile of nonsense, it's not worth any time or attention.
Saadi, one good explanation is at Science of Doom.
All,
Thanks. I thought his paper was "submitted", and I assumed to be published soon. I was wrong. I thought it had a lot to do with altitude and am happy to see I was correct in that at least.
HJones - Not a problem; there's an amazing amount of junk including bad papers published in borderline journals floating around (such as Beck and E&E), and it's sometimes difficult to pick those out on first glance. They frequently get waved about to support bad arguments.
The appropriate and truly skeptical response to extraordinary data or conclusions is to check them out, which you did - my compliments.
Great information, though very bad news. Does this paleo evidence imply that we are effectively locked in to 3-4 C degrees warming globally? If so, what's the logical course of action? Seemingly, even the most aggressive emission control initiatives, instantaneously put in place, would not stop the demise of civilization.
yphilj @11, if we were miraculously to cease all CO2 emissions today, then the natural uptake of CO2 by the ocean and biosphere would reduce the atmospheric CO2 concentration to about 310 ppmv over the next few centuries. That uptake reduction would exhaust all natural forms of CO2 uptake, so the CO2 concentration would then remain at that level for thousands of years thereafter. As it would take thousands of years to melt all the ice necessary for a 40 meter sea level rise, we would in fact expect an overall increase in temperature relative to the pre-industrial similar to that which we are currently experiencing, and a sea level rise over many centuries of several meters.
Such a miraculously rapid stop in emissions is, of course, impossible. Plausibly, with rapid action now we could stop net emissions by 2050, with a total atmospheric increase to 450 ppmv, reducing to around 325 ppmv over a few centuries. In that event, we would expect a temperature rise around 1 C over the pre-industrial with short term peaks potentially up to a degree above that. That is certainly a survivable and achievable outcome.
The risk is that we will do little or nothing, or merely stablize atmospheric CO2 levels by allowing residual emissions at a low level. In that case, we are indeed looking at 40 meter sea level rises over a millenium or so, and temperature rises that will threaten to destroy our industrial civilization, with out which the human population will crash to a billion or less.
Thanks Tom! Well explained.
- Phil in Colorado.
@Atomant, it was a reasonable question; there is nothing to be gained by being rude and dismissive to those seeking knowledge, it does not create a good impression. See Tom's answer @ 6 for a much better approach. Skeptical science is a forum for discussing the science, which is why we generally try to adopt a calm rational tone, unlike the hyperbole and rhetoric that you tend to see in climate blogs that want to avoid discussing the science.
Atomant @13, H2O is a greenhouse gas because the molecule has electrical poles. Specifically, the Oxygen atom atracts electrons more strongly than does the Hydrogen atom, resulting in the hydrogen atoms being positively charged when in a water molecule, with the Oxygen atom being slightly negatively charged. Further, because of the molecular configuration the water molecule has a number of vibrational modes, which makes it a strong absorber.
Of course, Hydrogen and Oxygen atoms which are neither ionized nor part of a chemical compound have no net electrical charge and cannot have no vibrational modes within the molecular bonds (which they do not have) and so do not absorbe IR light. They will absorbe light of higher frequency based on the energy levels of their electron shells.
I am glad you are so willing to go back to class on this.
Thanks guys - people do come on here to learn and some of them may be genuinely inexperienced in this field of science - but we should support anybody who wants to learn - in fact I would be delighted to see more people not afraid to ask even the most basic questions.
One thing to consider is perhaps an open Q&A thread for such a purpose.....
Re the Saadi Aubydi and Atomant discussion.
I actually find the concepts of distinguishing between greenhouse gases and non-greenhouse gases fascinating and I learnt a lot discovering the difference. Not just about the greenhouse effect either.
Once you get your head around the basics, you can see why molecules that are more complex than CO2 can be potent GHGs. I'm probably better at visualising what is happening than I am at understanding the maths.
I've always found it interesting too. I liken it to harmonics. If you open up a piano and can sing loud enough, if you sing a D note each of the D strings in the piano will begin to vibrate symathetically. Sing a G and the G strings will vibrate.
Same thing is working, on a much smaller scale, with IR radiation. Since a CO2 molecule is configured in a way as to allow it to vibrate, it has a frequency where it will vibrate.
Sing that G note again in front of the piano. What happens when you stop? You can hear the G strings continuing to vibrate. They are "re-emitting" the note you sang.
Same thing with CO2. When it begins to vibrate in the presence of the right IR frequencies, it is "re-emitting" that same energy it absorbed.
I'm sure there's a point where the analogy breaks down but this is how I get my head around the concept.
Rob,
That's the best explanation I have heard so far!
John, Thank you for an excellent and in-depth explanation of the Lake 'E' results so far. As you point out, this is on-going research and a great deal of data remain to be published. I, for one, look forward to additional information from this site as it appears to be a unique terrestrial record for the past 3.6 Ma.
David Archer has a good explanation of how greenhouse gases work in chapter 4 in his textbook Global warming - understanding the forecast.
You can also try out the Modtran model of infrared light in the atmosphere on his website here.
This model doesn’t calculate climate change directly, only the changes in IR flux for a given surface temperature with changing concentrations of CO2, methane and ozone.
So according to this article there is more evidence of huge changes in climate that could not possible be caused by man. It talks about CO2 levels about what they are today but with temperatures as much as 8C higher. (-snip-). This paper is consistent with the idea that some of the past interglacial periods were much warmer than the current one.
[DB] Sloganeering snipped.
William @ 23... The fact that atmospheric CO2 has radiative properties that cause the planet to warm does not have to be re-examined in each and every paper that discusses it. This is a fact that has been well established for over 100 years.
William, in that past period there has been time for full equilibrium to be established. 8C warmer is consistant with estimates of ECS. It takes 1000s of years for ice sheet to melt but when gone, your albedo is reduced. Ditto for ocean equilibrium. Noone disputes that climate has changed in the past without human influence. That statement is just rhetoric and verging on sloganeering. The important point is that climate has changed in the past for well understood reasons and those causes dont apply now. With different milankovich forcings, interglacials were at different temperatures. However, consider that in pliocene, milankovich cycles were still happening but glacial werent. Why? CO2 too high.
Because fires can start naturally, does that mean you cant charge someone for arson?
John Mason – What an excellent article. Just how high was Pliocene and early Pleistocene average sea level compared the present?
Tom Curtis @13 expresses an optimistic view that by curbing CO2 emissions to 450 ppm (can we?) average global surface temperature will not exceed 2ºC above the pre-industrial by 2100.
I wish!
It might be, if we ignore the effects of slow feedbacks such as accelerating loss of albedo and permafrost, carbon emissions in the Arctic and increasing ocean heat content. Unfortunately we can not. Nor can we assume that CO2 concentration will not exceed 450 ppm by 2050, let alone 2100.
In the absence of enforceable national emissions targets it seems unlikely, unless there are remarkable technological developments enabling affordable carbon capture and sequestration or cheaper electricity generation from renewable sources.
Present rates of anthropogenic CO2 emissions are over 2 ppm/annum and accelerating making it very likely that concentration of 450 ppm will be reached by 2040. Emissions will continue thereafter reaching 560 ppm by 2100, resulting in average global surface temperature of around 3ºC.
It seems likely that anthropogenic emissions and those caused by slow feedbacks will result in considerably more than 560 ppm CO2 equivelant by 2100 with average global surface temperature of around 4ºC above the pre-industrial.
We should all hope that science and technology will reduce this possibility over the next 50 years. I believe they will. However there is shrinkingly little possibility that average global surface temperature of over 3ºC above the pre-industrial can be avoided this century.
Excellent summary of the work by Brigham-Grette et al - and encouraging to see some learning happening in the comments section. Thanks, John
Agnostic @26:
1) Keeping CO2 to 450 ppmv peak concentration requires reducing CO2 emissions linearly to zero emissions in 2050. It is technically and economically feasible to do. There is, however, substantial doubt as to whether it is politically feasible, ie, whether the nations of the world can be persuaded to agree to and then impliment such a program.
2) With a 450 ppmv peak concentration the natural draw down of CO2 will reduce the CO2 concentration to about 365 ppmv over 200 to 400 years. (My earlier lower estimate was in error, for which I apologize.) With an Earth System Climate Sensitivity of 4 C per doubling of CO2, that works out to a long term temperature increase of 1.5 C above the preindustrial average. That is comparable to the 1.4 C transient climate response to 450 ppmv. The net effect is that tempeartures will stay approximately constant with zero net emissions because the slow feedbacks will be countered by the gradual decline in CO2 levels from natural uptake.
3) This optimistic scenario depends essentially on our in fact reducing net anthropogenic emissions to zero in the short term, and maintaining them at zero of slightly negative values in the long term. It is optimistic only in the sense that if we make a concerted effort to tackle climate change, we can limit the disaster to levels comparable to previous experience (ie, somewhere between the economic impact of the 1970s oil shock and a permanent great depression). Absent that effort the impact will be equivalent to a permanent great depression or worse.
Agnostic #26 -
The variability of sea levels back then (and for much of the time leading up to the Pleistocene Transition) was no more than +/- 70 metres. That means that in cold cycles it only got cold enough, in the worst cases, for enough land ice to form to drop sea levels some 70m and rise them back up by the same amount during the warm cycles when it melted. Quite a difference from the 125m associated with the Last Glacial Maximum!
"The fact that there exists strong evidence for past major warming and its consequences in both polar regions suggests an interconnectivity between the poles, with the implication that these are effects occurring on a global scale."
Consider that right now the planet increases heat retention daily, radiative forcing, and that the flucuations in CO2 are not affecting this much at all due to it still being a rising value. Because of this the atmosphere is now moving heat north and cold south, and the reverse in the southern hemisphere faster and more directly due-north, due-south over both poles as a result.
Both poles are doing this and indications of this are the late season snow in both Europe and the Midwest at this time. These are not mysterious but a by-product of the atmosphere being a heat-transfer system vainly trying to maintain thermal balance until we remove the cause.
This process is to me what keeps global temperatures from rising at this time, it's like we're using an old-style ice-box to cool the house and once the ice is gone nothing is left to cool the planet, ice melted and permafrost thawed.
Therefore global temperature is not a good short-term indicator, it's not predicitive of what's going on, an example, 30-years ago near Disco Island only dogsleds could be used for 6-months of the year, today hunters use their fishing boats to hunt seal, very few use their sleds anymore. What model predicted this?
Further, observing jetstream paths for many years I noticed that many times the air arriving in the Disco Bay area came from the Tropic of Cancer latitudes in the Pacific, gained latitude as moved east and continued NNE to pass over Disco Bay. This versus the cold-period regime that brought very cold air from the north for especially the three coldest months Jan-Mar. From locals they have observed this from being on average -30C historically to today where it's rare to have below -10C, a +68F/20C rise in average temperature.
This easily explains the loss of sea-ice in this area and it's from new jetstream paths being taken quite often in winter which was not predicted by models, thus my reason for bringing it up. That is to recognize that the atmosphere is doing many north-south pieces of jetstream moving the cold to the equator and heat to the poles, this needs to be included in models, we have a new circulation pattern now, the atmosphere is being driven by the radiative forcing regardless of what global temperature registers as it's being held back until the cold storage from the previous ice-age is gone.
So, I'd suggest to modelers & others, that heat-transfer is the main driver now and without assessing the volume heat transfer by analyzing air masses, their volume, temperature, humidity and direction there's no way to be predictive of these on-the-ground radical changes such as at Disco Bay.
Tom Curtis, AWESOME explanation on CO2 curtailment/cessation...let's hope we make these changes ASAP before the worst of the worst...