


 Arguments


Ignoring long-term trends due to distracting long-term trends
What the science says...
Soares looks at short-term trends which are swamped by natural variations. Increasing CO2 causes a gradual long-term warming trend which is smaller than the short-term variations. The long-term correlation between CO2 and temperature is well established.
Climate Myth...
Soares finds lack of correlation between CO2 and temperature
"The comparison of temperature changes and CO2 changes in the atmosphere is made for a large diversity of conditions, with the same data used to model climate changes. Correlation of historical series of data is the main approach. CO2 changes are closely related to temperature. Warmer seasons or triennial phases are followed by an atmosphere that is rich in CO2, reflecting the gas solving or exsolving from water, and not photosynthesis activity. Interannual correlations between the variables are good. A weak dominance of temperature changes precedence, relative to CO2 changes, indicate that the main effect is the CO2 increase in the atmosphere due to temperature rising. Decreasing temperature is not followed by CO2 decrease, which indicates a different route for the CO2 capture by the oceans, not by gas re-absorption. Monthly changes have no correspondence as would be expected if the warming was an important absorption-radiation effect of the CO2 increase. The anthropogenic wasting of fossil fuel CO2 to the atmosphere shows no relation with the temperature changes even in an annual basis. The absence of immediate relation between CO2 and temperature is evidence that rising its mix ratio in the atmosphere will not imply more absorption and time residence of energy over the Earth surface." (Paulo Soares)
A recent paper in an obscure journal (Soares, 2010) used correlations between temperatures and CO2 concentrations to conclude that;
"The absence of immediate relation between CO2 and temperature is evidence that rising its mix ratio in the atmosphere will not imply more absorption and time residence of energy over the Earth surface. This is explained because band absorption is nearly all done with historic CO2 values."
Soares looks at correlations between change in CO2 and change in temperature for a month to a few years. He doesn't find a correlation between short term CO2 changes and temperature changes in the following months. His Figure 8 shows the change in temperature or CO2 from one year to the next.

Do we live in Soares’ world where CO2 isn’t causing warming, or in the world of mainstream physics where theory and measurements show increased CO2 heating? What does mainstream physics expect to see in the above graph?
Firstly it expects atmospheric temperatures to change regularly: natural cycles like El Nino transfer heat from the oceans and can change atmospheric temperature by up to 0.4 °C in a year causing the big vertical spread.
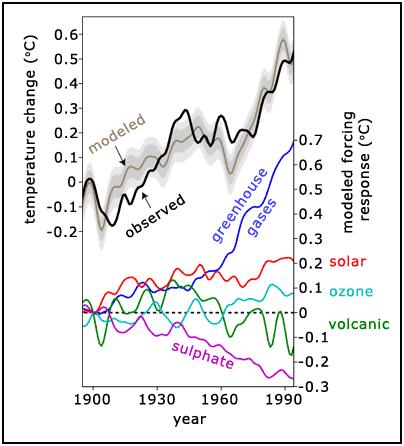
The graph below is based on Meehl et al, 2004 and shows a climate model estimate of how much global warming was expected from greenhouse gases for the past century: always less than 0.02 °C/year - so small that the noise effectively hides the incline if you only look at year to year changes. Fortunately, very simple statistical techniques work around this.
Some rough calculations using the NASA global data shows that to detect the expected CO2 global warming for the past 40 years at 95% confidence would require about 160 years of measurements - and hundreds more measurements to detect the CO2 signal when it is smaller.
We have some more expectations for the graph: low CO2 emissions should mean slow warming and vice versa. On the left of the graph we expect average warming of under 0.01 °C/yr and on the right hand side we expect just under 0.02 °C/yr. So if you plot a slope you expect it to be positive – going from 0.01 on the left up to 0.02 on the right but practically impossible to find amongst so much noise (although Soares does plot it).
The next trick is to implicitly assume that nothing else shows a warming or cooling pattern: but we know that there is. From the 1940s to the 1970s we pumped enough reflective aerosols into the atmosphere to temporarily halt global warming by 'global dimming' (Ramanathan et al, 2001).
This is like putting a pan of water over a lit gas stove and then dropping in an icepack big enough to cool the water. Soares would say the cooling shows that burning gas can’t heat water, but mainstream science says that a big pack of ice temporarily masks the heating and that burning gas does, in fact, make water warmer than it would otherwise be. Importantly, you can account for the ice and determine whether the heat is on and other scientists would do this.
Soares’ method is like searching for a needle in a huge haystack by picking a handful of hay rather than using a magnet. You almost certainly wouldn’t find the needle even if it was there, so to claim you’ve disproved its existence when other scientists have found it with their magnets is simply stunning.
Last updated on 17 January 2011 by MarkR. View Archives


If CO2 was a primary factor in global heat forcing, then we'd expect to see easy-to-find correlations between CO2 levels and global temperatures.
For example, we know that from the laws of heat transfer that the thermal output from a blow torch has an impact on the temperature of the object at which the blow torch is heating. The greater the temperature of the flame relative to the temperature of the object, the faster that the temperature of the object increases.
We also know that correlations can be found in unlikely pairs. For example, World-Wide Noncommercial Space Launches is highly correlated with the number of US Sociology Doctorates awarded in the US. If statistics are done well, conclusions like that can be avoided.
So let's assume that greenhouse gases are real (they are) and that they have a direct impact on global earth temperatures (clearly yes, but is the relationship strong or the strongest as in the case of the blow torch?). Read "As I turn up the blow torch output in heat, the temperature of the object will rise. If I correlate the temperature delta between the torch flame and object to the temperature change of the object, I'll find a 99%+ correlation."
Clearly we don't expect to find that size of correlation when considering a system as complex as global earth temperatures.
But be honest. Before you read farther, what would you expect the correlation to be? 10%, 30%, 50%, 70%?
My question is this. When I correlated 400K years of Vostok CO2 and temperature changes sliced into 100 year blocks, the correlation was only 7%. And when trying to predict the next 100 years of temperature change from change in CO2, the correlation dropped in half. Yet when doing the same to the Milankovich data, the predictive correlation was higher than the time-aligned correlation. If CO2 is a primary factor, then
1) Why is the correlation so low?
2) With CO2 levels at record highs (thermal forcing should be at its max), why was 2018 cooler than the prior four years?
As a statitician, I've learned that it is:
- easy to model the past (e.g., the stock market).
- one cannot use a modeling fit of the past to make assumptions about model accuracy in the future. That is a dangerous assumption.
- the only way to do the later is to:
... evaluate the model in the future using a Kalman filter that has an overall control loop to dampen the prediction if predictions are not accurate.
... changes to a model in time starts from scratch when trying to predict the future (a model must earn its accuracy in real time).
... evaluate delta changes, not absolute values (screens out false positives). We are talking physics. If their is a predictive correlation in absolute value then there will be the same correlation in deltas.
Wiffrantz, it appears you did not read this post that you commented on. Please do.
If you really were a statistician, you would be acutely aware that finding a correlation between just one of several causes of an effect requires isolating that one cause, for example by multiple correlation analysis. See the post "CO2 is main driver of climate," and note that it is not the only driver.
If you really were a statistician, you would be aware of the time dependence of bidirectional causality. Over very long periods, warming oceans have released CO2 and so increased atmospheric levels after the warming. In other cases, CO2 has been released by other sources, thereby causing warming after the CO2 releases. In the past 150 years, humans have caused increased atmospheric CO2 levels, which has then caused warming.
Frantz & Dayton - Clearly Frantz is a statistician. And knowledgable. He realizes that precedence (cause-effect) analysis (and the correlations used in that) picks up all types of cause-effects. Irrespective of T causing CO2 and CO2 then causing T. Frantz recognizes that even those types of cause-effects are captured.
Frantz was clearly trying to get Dayton to think. To challenge his belief. To test his belief with actual climate records. So let me try.
To repeat Frantz, knowing that spiral relationships are still found in precedence analysis, shouldn't there be evience of CO2 causing warming in actual real-time records?
Dayton - Explain why ...
Actual climate records for the past 62+ years show that large changes in CO2 are followed by cooling. And that weak changes in CO2 are followed by strong warming. To repeat, our actual climate records show that the full effect of CO2 is to anti-force climate! This is true for all long-term cause effects over three months--the time it takes for CO2 to cause flora that cools to grow enough to counter and then overpower the Greenhouse effect.
The above facts are from the highest authorities in climate science—actual climate records. And those highest authorities all validate each other: NOAA, Mauna Loa Observatory, NASA, UK Met Center, Cowtan-Way, Japan Meteorological Organization, Berkeley Earth, RSS, and UAH. Download the records. Do the math yourself.
And don't try the trend trick. You know that is invalid. Greenhouse gas theory clearly states that a Doubling in CO2 will cause a Change in global temperature. That is CHANGE causes CHANGE! So your evidence needs to be in the form of changes.
And that brings us back to Soares. You will find that not only was Soares correct, but that what he concluded was truly validated by all nine highest authorities in Climate Science.
[DB] In the same fashion that asserting a dog's tail is a 5th leg does not make it so, asserting that increases in atmospheric concentration in CO2 cause cooling also does not make your assertion valid.
This venue is based on an understanding of science and entails the usage of credible sources to support claims. The more egregious the claims, the even more substantial must your sources be to support them. Simply saying "nuh-uh" doesn't cut it here.
Please read this site's Comments Policy and comport future comments to be in compliance with them (and this includes citing credible sources to support your claims).