Solar Hockey Stick
Posted on 13 April 2011 by dana1981
Vieira et al. recently posted a paper on arXiv preprint service which will later be published in the journal Astronomy & Astrophysics on a reconstruction of total solar irradiance (TSI) over the Holocene (the past 11,500 years). The scientists reconstruct TSI using a reconstruction of the solar magnetic flux.
"The evolution of the decadally averaged magnetic flux is computed from decadal values of cosmogenic isotope concentrations recorded in natural archives employing a series of physics-based models connecting the processes from the modulation of the cosmic ray flux in the heliosphere to their record in natural archives...We present the first physics-based reconstruction of the total solar irradiance over the Holocene, which will be of interest for studies of climate change over the last 11500 years. The reconstruction indicates that the decadally averaged total solar irradiance ranges over approximately 1.5 W/m2 from grand maxima to grand minima."
Vieira et al. provide figures depicting their TSI reconstruction over various periods, including the entire Holocene (Figure 1) and the past 3,000 years (Figure 2).

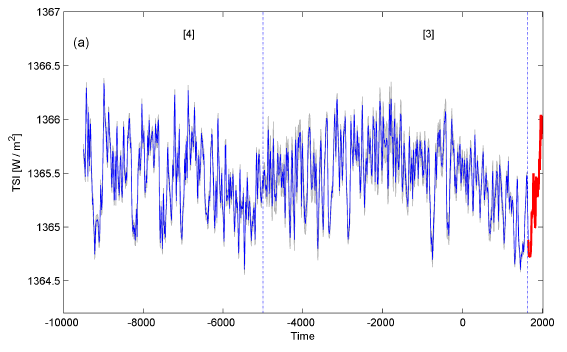
Figure 1: Vieira TSI reconstruction over the past 11,500 years

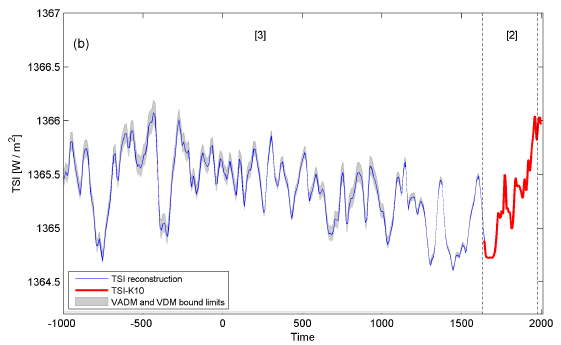
Figure 2: Vieira TSI reconstruction over the past 3,000 years
Interestingly, Figure 2 looks rather hockey stick-like. But before we declare this as proof that the Sun is causing global warming, let's quantify this solar contribution to the global surface temperature change.
Quantifying Solar Warming
The solar radiative forcing is the change in total solar irradiance (TSI) in Watts per square meter (W/m2) divided by 4 to account for spherical geometry, and multiplied by 0.7 to account for planetary albedo (Meehl 2002). The albedo factor is due to the fact that the planet reflects approximately 30% of the incoming solar radiation. As with CO2, we calculate the equilibrium temperature change by multiplying the radiative forcing by the climate sensitivity parameter (λ).
The climate response to different radiative forcings is similar, but not identical. This is known as the "efficacy" of a radiative forcing. According to various studies of the direct solar forcing efficacy (from TSI alone), as summarized by the IPCC, it is likely smaller than the CO2 efficacy. However, since there may be indirect solar effects not accounted for in the direct solar radiative forcing calculation, we'll conservatively estimate the solar climate sensitivity parameter as equal to the CO2 climate sensitivity of 0.8 (W/m2-K).
As shown in Figure 2, TSI has increased approximately 1 W/m2 over the past 200 years, from approximately 1365 to 1366 W/m2. Plugging this change in TSI and the climate sensitivity parameter into the formula above, we find that it should have caused approximately 0.14°C warming of global surface temperatures over the past 200 years, and even less over the past 100 years (closer to 0.1°C).
It's Still Not the Sun
Considering that the average surface temperature has risen 0.8°C over the past century, this is a relatively small solar contribution. Moreover, as Vieira et al. also discuss, TSI has not increased over the past 50+ years. During this time the surface temperature has increased approximately 0.6°C. So despite this solar hockey stick, there is still no basis to the myth "it's the sun".
Solar Contribution to Previous Climate Changes
We can also make use of the reconstructions in Vieira (2011) to evaluate the solar contribution to previous climate changes, such as the Little Ice Age (LIA; roughly 1550 to 1850 AD), the Medieval Warm Period (MWP; roughly 800 to 1200 AD) and the Roman Warm Period (RWP; roughly 200 BC to 400 AD).

Figure 3: Northern Hemisphere land temperature reconstruction from Ljungqvist (2010)
Overall during the MWP, there was little change in TSI. However, it did increase approximately 0.2 W/m2 from in the years leading up to 1000 AD. This would correspond to a 0.04°C increase in global surface temperature, or perhaps as much as 0.05°C in land surface temperature, as reconstructed through proxy measurements like Figure 3. Thus TSI appears not to have played a particularly large role in the MWP, accounting for perhaps 10-20% of its peak warming.
There was similarly little change in TSI over the entire RWP. But similarly, in the years leading up to 0 AD, there was perhaps a 0.2 W/m2 increase in average TSI. Thus solar irradiance played a role in the modest Roman warming as well.
There was a fairly steady decline in temperature between the peaks of the MWP and LIA. During that time, TSI decreased approximately 0.5 W/m2. This corresponds to a decrease of approximately 0.07°C in average global surface temperature, or close to 0.1°C in land surface temperature. This is a significant contribution to the LIA cooling, but still only about 10-20% of the overall temperature decrease.
Conclusion
Overall, TSI has remained relatively steady over the past 3,000 years, and indeed, over the entire Holocene. Therefore, directly at least, the sun appears not to be responsible for significant global temperature changes over the past 11,500 years, and certainly not over the past half century.

Arguments


And surely you ALSO know that this consequently SKEWS any claims after 500 B.C. toward higher current levels, right?
Good article, but, of course, the issue is whether the sun can only heat the Earth directly. IMO, there are way too many correlations btw solar proxies and climate for that to make sense. see here, for instance.
http://aps.arxiv.org/PS_cache/arxiv/pdf/0804/0804.1938v1.pdf
Cheers, :)
Cheers, :)
Now, you can say that I'm not inflating the sensitivity enough to account for the full effects of these indirect factors (which I would disagree with - again, see the cosmic ray link above), but mathematically, there's really no difference. To account for the indirect effects, either you inflate the senstivity or you inflate the forcing. The mathematical result is the same either way. My calculation is really no different than assuming there's an indirect solar forcing ~20% as large as the TSI forcing.
Cheers, :)
It would cover some "skeptic" arguments like Ernst Beck's... wouldn't it be worth a post?
Alexandre - we do have "How reliable are CO2 measurements?". Sam's comments are of course irrelevant here, since there was no reference to ice core measurements.
BTW, since you bring it up, you can find plenty of evidence that all forcings are not equal at all times if you want(compare the bottom curve with the temperature ones).
http://en.wikipedia.org/wiki/File:Vostok_420ky_4curves_insolation.jpg
Cheers, :)
Cheers, :)
And it's not sufficient to claim that some solar effect varies by 10% over some timeframe. You have to have a mechanism whereby this solar effect is impacting the global climate. You know, that damn causation thing again.
I meant that alledged unreliability of the ice cores due to supposed contamination before proper compression. I think that's what Sam's claim is about, and also the excuse Ernst Beck used for relying on chemical measurements on his below-standard E&E paper, with this CO2 time series:
Richard Alley metions the ice core reliability on his Biggest Control Knob lecture, and I'm sure there are some early papers to back this up. I thought it could be a good subject.
Well, I'm going way off topic here. Just didn't know where else to suggest it. Feel free to delete this after considering the suggestion.
Dana is right-- if certain predictor variables (e.g., solar parameters) are highly correlated with each other, and one is applying a multiple linear regression to explain the variance in a dependent variable (e.g., such as global surface air temperature), then one has to choose one of the correlated group of predictor variables. Interesting (problematic) thing about multiple regression is that as soon as one adds more variables the R^2 (variance explained) goes up, when in reality might not be explaining more of the variance in the dependent variable--that is why statisticians use the adjusted R^2 when using multiple parameters.
And again, some caution, without a physical mechanism to explain a relationship, correlation does not imply causality.
At the end of the day, solar can not explain a significant portion observed warming since circa 1880, and this is especially true for the recent warming. Pretty sad that so many people continue to believe that solar is the primary cause.
Something I didn't mention in the article - recently "skeptics" have claimed to be worried that a new Maunder Minimum (late 17th century) event would trigger another Little Ice Age type event. As shown in the article, this would cause on the order of 0.2°C cooling. Not quite enough for another LIA!
Cheers, :)
"Not quite enough for another LIA!"
Not even close. And you are in good company. The next ice age has been delayed indefinitely, also see Feulner and Rahmstorf (2010).
possibly i have not understood any of this post but, does this mean the other 80 - 90% of historical warming/cooling was down to climate feedbacks in response to the small changes in solar irradiance? we really are stuffed if that's the case.
but what about early anthropocene influence? lots of forest cleared, increases in population and domestic animals, in roman times, and especially in medieval period before the plagues (and a lot less after). but that's not too hopeful either, considering our current population and behavior.
and how do we tease those two terrestrial factors apart?
This happen in a lot of publications and unfortunately also here.
This is a problem because one has to try different combinations of the names of the authors plus the name of the journal plus the date(that often is only the year, without indicating the month and the day), and as a consecuence sometimes one finds not one, but a series of articles by the same authors.
To help the readers of skepticalscience, here is the link:
Evolution of the solar irradiance during the Holocene
Gerda - no, the other 80-90% were due to other factors, like natural variability and such. The solar feedbacks are included in the 10-20%.
From Peru - we don't just provide author plus date, we also provide links to the papers themselves. Unfortunately, I forgot to do that in this case! I'll edit the article to include the link. Thanks for noticing that.
In concrete numbers, say in one warming the direct TSI accounts for 12% of the warming, and we're estimating indirect TSI = 0.25 direct TSI, so full TSI accounts for 15% of the warming. Sure, that 0.25 might actually vary a bit as a function of TSI rather than being constant, but unless it varies up to 10 times larger, it doesn't affect the conclusion that overall TSI is not the most important factor in the warming.
Cheers, :)
Yes, I wrote the advanced "it's cosmic rays" rebuttal that I linked to in comment #3. And as I already noted in comment #10, TSI and solar magnetic field (which impacts galactic cosmic ray flux on Earth) are strongly correlated.
It's unclear whether you're talking about the variation or the trend. But it's the trend that matters, and there is no long-term trend in cosmic ray flux on Earth over the past 60 years, just like there's no trend in TSI. So my point stands.
Cheers, :)
It could not have been ocean cycles: both ENSO and PDO were in a permanent cool phase (La Niña + negative PDO) during the Medieval Warm Period.
Maybe is solar effect after all, via cosmic rays.
But if is not TSI nor cosmic rays (weak effect) and not ocean cycles (that were in a persistent cool phase), what else could have caused the Medieval and Roman Warming Periods?
I'm talking about whether or not you can get a reasonable estimate of indirect forcing by multiplying the direct TSI forcing by some factor. Clearly, in that context, the variation is the important information.
Anyways, you'd earlier asked me to substantiate the following claim:""Since we can be pretty sure that most of the leading candidates for indirect effects do not vary linearly with TSI..." and I thought I'd answer that question(luckily I was able to find a relevant graph).
ftp://ftp.pmodwrc.ch/pub/Claus/AGU-Fall2005/AGU_poster_Fall2005.pdf
Please see the top panel of figure 5 - for much of the graph TSI and GCR lie pretty much on top of each other(which would be consistent with your approach), however, note the size of the blue and red spikes in the middle. GCR spikes much higher than TSI in relative terms.
the Holocene, Geophys. Res. Lett., 36, L19704, doi:10.1029/2009GL040142.
SBF 2009 did a similar reconstruction. You can even access and have a play with the data (data file and readme file)
They show a similar general result, i.e. millenial/centennial scale variation in TSI of approximately 1W/M2. Although the MWP is a period of relatively high TSI.
Dana I'm curious about this statement of yours
"Thus TSI appears not to have played a particularly large role in the MWP, accounting for perhaps 10-20% of its peak warming."
What accounts for the remaining 80-90%? I'm guessing not external forcing. Internal variation?
I'm not sure what you think this means. The phi parameter shown in figure 5 inverts the GCR flux, so that phi highs and TSI highs are GCR lows. Better graphs of GCR flux are available on the cosmic ray thread. Another version is Figure 1 in Stozhkov et al 2000, showing GCR peaks in 1965, '76, '87 and '97, which are all sunspot lows.
Stozhkov also found a small negative trend in the solar cylce peaks of GCR flux over the 45 year period analyzed.
Follow-up GCR-specific comments should go to the thread linked above.
If I understand Dana1981's article and comments, he's claiming that the small changes in TSI means that the large observed changes in average temperature in the last 2000 years (exluding the last century or so) are mostly due to "natural variability".
I'm surprised at size of the "natural variability" induced Northern Hemisphere land temperature changes. What are some of the "other factors" that are hypothesized for the NH land temperature variations of Figure 3 (prior to 1800 or 1900, of course)?
HR and Charlie - there's natural variability, volcanic forcing, anthropogenic land use changes, etc.
Does your answer here not raise alarm bells for you? All those same processes are going on now. For example we are presently in an extended period of low volcanism, land use changes have likely accelerated in the past 100 years, natural variability is, I assume, still going on. Why are these processes not accounting for 0.4oC of warming in the present day as in the MWP? This seems exactly where the disagreement between a large chunk of the skeptics (lukewarmers) and the concensus lies. Any chance that you might think the IPCC has failed to fully account for these processes for modern warming? Certainly Pielke Snr doesn't stop banging on about how land use change has been neglected.
It means that sometimes the relationship btw GCR and TSI is can be represented as TSI times a constant value and sometimes it can't.
dana:"when you're talking about long-term temperature trends, which is what we're doing here, then it's the long-term trends in the forcings that matter. Short-term variations don't cause long-term trends."
Well, I suppose that if you reduce all the data in a set to two linear trends then you can clearly represent value 1 as value 2 times a given factor. However, this value doesn't have a physical meaning. Further, there is nothing you can do with this. OTOH, by comparing the specifics of how these two values vary with respect to one another you might be able to tease their relative forcing values.
Cheers, :)
There is nothing in that link about land use change or natural variation. There is nothing in the IPCC figure used in that post about these as well.
Disputes about TSI or cosmic rays aren't going to change the radiative properties of CO2. My understanding is that we know the climate forcing from CO2 to an accuracy of less than 1%, and nothing we discover about other natural factors is going to change that. The expected warming resulting from that forcing is less certain, because it is a function of climate sensitivity, but that applies equally to other forcings such as TSI. It's not possible to argue that the sun is causing the current warming without also denying the radiative properties of CO2, which would be absurd.
How do you square that opinion with the dis-correlation cited in the article? That is, "...TSI has not increased over the past 50+ years. During this time the surface temperature has increased approximately 0.6°C."
IF solar effects and global climate were as tightly bound as you claim this discrepancy should be impossible.
Further, if the Sun were responsible for recent warming there would be different 'fingerprints'. Neither a direct increase in TSI nor any of the 'cosmic ray' theories would cause more pronounced warming at night or stratospheric cooling. Yet those effects have been observed. Indeed, I've never seen a single skeptic even try to challenge (or address) those observations. How do you explain the fact that the pattern of the observed warming directly contradicts what you claim to be its cause?
Likewise this paper: http://www.agci.org/dB/PDFs/10S1_LGray_SolarInfluencesCLimate.pdf which concludes that GHG forcing is primarily responsible for late 20th century warming. The paper is interesting though in that it explains (and then ignores) many effects of solar activity on weather (the weather that causes part of the increase in nighttime warming, affects stratospheric temperatures, etc).
No. They are inverted, which is not 'times a constant value.' As far as 'sometimes it can and sometimes it can't,' what good is that?
Volcanic effects are demonstrably short term... the signal can be easily seen to appear and then fade completely within a year or so. Thus, stratospheric cooling over the course of decades is certainly not caused by lack of volcanic activity... that would only cause a brief warming and then return to baseline.
The lower UV = less ozone = stratospheric cooling claim is a new one to me, but everything I've seen shows that ozone levels have been increasing since CFCs were banned. Ergo, doesn't seem to hold up.
Also: "Warming at night is partly from UHIE contamination"
So why does it show up in the satellite records? Urban heat islands in space?
You've thrown out some excuses... they just don't seem to make any sense. Let alone have actual scientific analysis backing them up.
The biggest thing the "skeptics" are missing here is that as Icarus noted in #41, we know the CO2 forcing to a high degree of accuracy, and it's very large (nearly 1.8 W/m2). If you want to argue that this forcing isn't driving global warming, you need both a low climate sensitivity and a larger "natural" forcing. The TSI forcing alone is an order of magnitude smaller than the CO2 forcing alone. I'm sorry, but indirect solar effects like GCRs aren't going to make up that extra 1.6+ W/m2.
I agree that recent history has been predominantly driven by anthro forcings. This does not rule out a substantially larger potential influence for solar and solar related phenomena IMO.
Cheers, :)
And, as I'm sure you know a constant can also be a negative number.
Cheers, :)
"I agree that recent history has been predominantly driven by anthro forcings. This does not rule out a substantially larger potential influence for solar and solar related phenomena IMO."
Onr the first point we can all agree. So can you please stop entertaining hypotheticals and what ifs, and making unsubstantiated assertions? Occam's razor applies here-- as Dana patiently explains again @46, the science shows that one quite simply does not need to invoke GCRs, or some hitherto unknown and mythical solar-related forcing to explain the observed warming in the SAT record. Period. That is the point of the thread. But you seem to be trying to inflate uncertainty and fabricate doubt. Now where have I seen that trick before ;)
I think a key result here is that the blade of the solar hockey stick corresponds to a TSI radiative forcing 10 times smaller than the blade of the CO2 hockey stick. Invoke all the indirect effects you want, you're pretty darn unlikely to overcome that factor of 10.