


 Arguments


Tropical Thermostats and Global Warming
Posted on 16 February 2012 by Chris Colose
A recent post at Watts Up With That by Willis Eschenbach, and then embraced by Roger Pielke Sr., goes into detail concerning a purported "tropical thermostat" that sets an upper limit on the ocean temperature. This thermostat could presumably help regulate the response to radiative forcing in a higher CO2 world, constraining ocean temperatures to be no greater than the threshold value.
The underlying hypothesis is actually not of WUWT-origin and has some roots that were discussed in the literature dating back a couple decades. WUWT presents a histogram of observed ocean temperatures, which shows a sharp cut off at ~31 °C (diagram reproduced below). The figure indicates that no measurements in the worlds oceans show temperatures much higher than that value. Based on this data, WUWT (as well as several older scientific papers based on similar data) suggested this is a theoretical 'maximum ocean temperature' and is independent of solar or greenhouse forcing. Kleypas et al 2008, for example, based a study on corals on the premise that such data support a maximum ocean temperature.

Figure 1. A “histogram” shows how many data points fall in each of the 1°C intervals shown along the bottom axis. The maximum is in the interval 28°-29°C. Figure and Caption reproduced from WUWT article.
In another example, in a paper on mass extinctions, Veron, 2008 mentioned that:
"...the surface temperature of the largest oceans would have been limited by the Thermal Cap of ~31C, widely believed to be the highest temperature large oceans can reach.’"
Based on the premise of a maximum ocean temperature, there have been several proposed 'thermostat' mechanisms to explain why tropical sea surface temperatures (SSTs) don't get much greater than ~31°C. Proposals involve negative feedback cloud responses (ex. Ramanathan and Collins 1991) or enhanced evaporation that keeps the SSTs down (ex. Newell, 1979 or Hartmann and Michelsen, 1993).
But is this actually "widely believed" as Veron, 2008 state? It turns out the answer is no.
Several older papers rebutted the cloud thermostat hypothesis of Ramanathan and Collins (ex. Fu et al., 1992 and later observational papers) and related thermostat arguments have also been refuted a number of times (Wallace, 1992). Pierrehumbert, 1995 discussed the regulation of tropical SSTs and showed that there is no physical basis for an upper temperature bound. More recent papers (Sud et al., 2008; Williams et al., 2009) came to similar conclusions.
Before I explain the discrepancies, it is worth reviewing some basic tropical meteorology:
-
The Tropics, loosely ~30 N-30 S latitude (though a number of definitions exist) receive the substantial bulk of Earth's incoming solar radiation, and in fact receive more incoming energy than outgoing infrared radiation to space. This implies that there is a substantial loss of energy by the tropics toward the poles by non-radiative means (atmospheric and ocean transport).
-
The tropics are dynamically distinct than the mid-latitude regions that (I assume) many of us are more familiar with. Instead of heat transport being manifest in 'eddies' (cyclones and anticyclones, and associated warm/cold fronts), the tropics instead fall under a giant overturning circulation called the Hadley cell.
-
Due to the weak Coriolis effect, the tropics have very weak horizontal temperature gradients in the atmosphere. Thus, SSTs vary more than atmospheric temperatures in the horizontal. Furthermore, in the tropics the air very close to the surface always has a similar temperature to the SST. In the vertical (from the surface upward) we typically think of the temperature structure in the tropics as being very close to moist adiabatic, especially over the ocean.
As mentioned before, several papers find no evidence of a 'maximum SST', so how do we reconcile that with the observed data?
What about the observed Histogram of SSTs?
Answering this question essentially boils down to the question of what SST is required for the onset of deep convection (and thus deep cloud formation). In the modern climate, this value occurs around 28 °C. In general, it depends on when air near the surface can become buoyant relative to air in the upper atmosphere and thus have enough energy to rise freely. Because atmospheric temperature gradients in the tropics are small, the threshold temperature for convection depends primarily on the local SST. There is a consequence to this: If the troposphere warms, then the SST threshold to kick in convection (and related cloud feedbacks) must also increase. In other words, it is the threshold for deep convection that promotes the skewed plot seen in the first figure, not any universal demand for a maximum ocean temperature.
This concept is shown below. The figure shows a model result for the longwave and shortwave fluxes as clouds form. The threshold for deep convection is readily seen in figure 2a (the longwave flux) and occurs when SST's exceed 25°C or so. When convection starts, lots of clouds form and the absorbed longwave radiation spikes upwards due to the cloud greenhouse effect. As the climate warms (going from the blue to red line), the SST temperature threshold also rises (i.e., moves to the right).
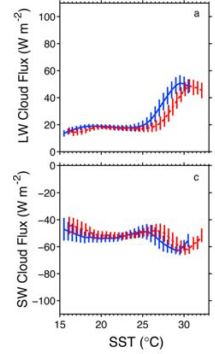
Figure 2. a) TOA cloud LW flux as a function of SST, b) TOA cloud SW flux as a function of SST; Solid blue and dashed red lines correspond to the ensemble median over years 0–20 and 60–80, respectively, from 15 IPCC AR4 coupled ocean-atmosphere models for the 1% per year scenario. Vertical lines indicate the interquartile range. From Willaims et al (2009)
Faulty Mechanisms
In order to understand why neither clouds nor evaporation act as an inherent buffer in the modern tropical climate, it's worth considering a few more bits of physics:
-
It must be kept in mind that in the modern tropical climate, the cloud shortwave (albedo) and cloud longwave (greenhouse) effects nearly cancel each other at the top of the atmosphere- the net effect is close to zero. That doesn't mean clouds are unimportant. If you could remove clouds altogether from the tropics, you could introduce many subtle impacts on the atmospheric heating distribution, circulation, and differences in SST across the tropics. However, the threshold temperature for deep cloud formation increases in a new climate. And because of the cancellation between the albedo/greenhouse effects of clouds, it is not compelling they have some special place is controlling the absolute tropical SST.
-
In a new climate it is possible that the albedo effect of clouds could win out over the greenhouse effect. This is a seperate argument that cuts into the heart of the climate sensitivity issue. Most studies to date show that the longwave feedback effect is likely to be positive (see ex. Zelinka and Hartmann, 2010; this will also be highly discussed in the IPCC Fifth assessment report, which reserves a whole chapter for cloud and aerosol issues of this sort). Most of the uncertainly in cloud feedback enters into the albedo side of the equation; how the cancellation between the albedo and greenhouse effects of clouds may change in a new climate is a challenging one, but there is no convincing argument as to why this should serve as a strong negative feedback, let alone provide a "thermal cap" on the oceans independent of any large forcing.
-
The tropics are partly stabilized by heat transport towards the poles and also by dry regions where infrared radiation more easily escapes to space. Near the equator the large moisture content acts as an infrared 'insulator', but dry regions have a weaker greenhouse effect. Transport of heat into these dry regions lets them act like "radiator fins" (Pierrehumbert, 1995) where energy can more readily leak out into space. If it weren't for this heat escape poleward and out of the dry regions then the bulk of the tropics would, in isolation, collapse into a runaway greenhouse state. This, however, doesn't mean that tropical SSTs cannot increase at all beyond ~31 °C.
-
Evaporation does not regulate the absolute value of SST, an argument taken up by Pierrehumbert (1995, cited previously) and shown by a number of papers, one recent being Miller, 2011. Instead, evaporation is such a large factor in the tropics that it wipes out the differences between the SST and the overlying air temperature. However, changes in top-of-atmosphere forcing actually impact SST more than changes in the surface forcing, since the whole atmospheric column will regulate its outgoing longwave radiation in response to perturbations. Most longwave radiation escapes in the high atmosphere, and the troposphere is well-mixed by convection such that it warms and cools as unit in order to balance ingoing and outgoing energy. Evaporation, however, is a buffer that takes up the slack between radiation absorbed at the surface and the flux of energy required to keep the SST close to air temperature.
The Observed and Past Climate Record
In order to cross-validate whether these results are correct, it would be useful to consult the paleoclimate record, in order to establish whether tropical SSTs were warmer than the modern alleged 'threshold' value. There is abundant palaeoclimate evidence that tropical sea temperatures can rise well above present values. Improved understanding of oxygen proxies and the development of new proxies ('thermometers of the past') such as TEX86 and Mg/Ca have shown that Eocene SST's in the tropics could have been even hotter than 35 °C (see ex, Huber, 2008).
For modern observations, Johnson and Xie, 2010 find an upward trend in the threshold of deep convection associatd with rising temperatures. This also means that the threshold SST for when hurricanes form will change in a new climate.
Conclusion
There have been a number of "false thermostats" and incorrect assumptions about a universal and unchanging "convective threshold" that kicks in heavy cloud formation. There's been a long history of refuting thermostats of this sort, but apparently this isn't universally appreciated. Note I have said little of the cloud feedback issue relevant for climate sensitivity; rather, there is no compelling physical jusitification to suggest that the tropical sea surface temperatures must be pegged at some maximum value independent of the forcing, or that clouds/evaporation must act as some sort of tropical regulation mechanism. As a further example, the figure below shows a simulation by Sud et al (2008) showing 10N-10S latitude tropical SSTs for present day heating versus the extra heating that would happen if CO2 were doubled:
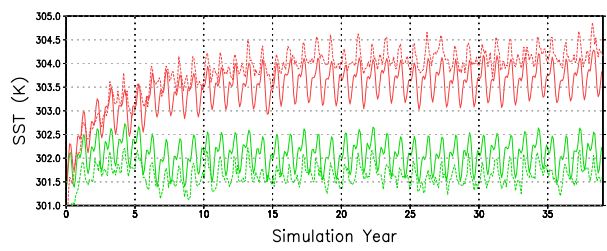
Figure 3. Solid lines show the 10 N- 10 S SST for a present-day (green) and 2xCO2.


Following on from a discussion elsewhere, I would like to discuss Willis Eschenbach's hypothesis, in that he at least presents what at first glance looks like evidence for his hypothesis. The evidence is scattered through three posts at WUWT, and shows that SST above 30 C are uncommon. Eschenbach argues that because those temperatures are uncommon, there is a "hard limit" on ocean temperatures, slightly above 30 C.
Eschenbach's hypothesis faces an immediate hurdle in that his own data refutes it. Here is his plot of "all" NH Argo surface temperatures (Fig 2, AOTM):
The "all" is dubious in that there are far to few data points for "all" ARGO NH surface temperature records, and it is likely that Eschenbach has used a random sample of the data to make distributions clearer. Regardless of that point, however, it is very clear from the graph that there is not a hard limit at 30-32 C. Several temperatures are recorded above those values, and some very far above those values. This is most clear in 2012 which shows a cluster of data points above 35 C. Further, the period of peak temperature does not show a well defined limit. Indeed, the upper limit on temperatures is less well defined in the warm months than in the cool months, the opposite of what we would expect if there were indeed a "hard limit".
What we would expect with a genuine "hard limit" can be seen by comparing the NH warm temperatures with the lower range of the SH cool temperatures (Fig 2, Notes 2):
You can clearly see a hard limit in low temperatures slightly below 0 C, representing the freezing point of sea water. The key feature is that the lower limit of temperatures is far more sharp ly defined in the cool months than in the warm months. That is in strong contrast to the upper temperature limit, which is more sharply defined in cool months than in warm months, a feature which by itself refutes Eschenbach's hypothesis.
At this point I will make a short logical excursion. As everyone knows, there is a "hard limit" on liquid water temperatures at 0 C, ie, the freezing point. Despite that, the hard limit in sea water is obviously less than 0 C. The reason is that increased salinity reduces the freezing point. Therefore, the "hard limit" is only a hard limit under a certain set of condition. If you change those conditions, you also change the "hard limit". It follows that even had Eschenbach been able to demonstrate a hard limit, he would not have demonstrated that Sea Surface Temperatures would not rise above that limit in the future, under different conditions. Of course, that is a point purely of logical interest in that Eschenbach has not demonstrated a "hard limit" to begin with.
Returning to Eschenbach's evidence, he presents more evidence that he supposes supports a hard limit. Specifically, he shows that the closer to the equator, the smaller the annual variation in temperatures (Fig 3, AOTM):
He says of this graph,
That, however, is not what you see at all. Rather, at the warmest times of the year, the upper limit of temperatures are least well defined. If anything, at that time you have a spike in temperatures.
I suspect the misdescription is because Eschenbach reffers to the guassians rather than the data. He expects the Gaussians to show a series of sine waves, with those closer to the equator being warmer than those further away. He thus interprets the actual series of successively smaller amplitude sine waves with the upper cycle nearly coinciding in values as the top of the cycles having been truncated.
Unfortunately for his hypothesis, there is a well known phenomenon in nature that shows a similar pattern to his Gausians, ie, the daily TOA insolation relative to latitude:
(Source)
You will notice the near constancy of insolation at the equator, and also that insolation at 20 degrees North is higher in the summer than it is at any time on the equator. The reason for that is that, at 20 degrees North, when the sun is directly overhead, the days are longer than they are when the sun is directly overhead on the equator. And with a longer day, and the same peak forcing we expect higher SST, which is what we see. Curiously Eschenbach draws attention to the fact that the peak temperatures are found not at the equator, but between 15 and 30 degrees North, in the Summer. But given the insolation data, that is just what we would predict. So also, given the insolation data, would we predict that peak summer temperatures through out the tropics and near tropics would match or exceed peak equatorial temperatures, and that the closer the equator, the less variation in SST.
Eschenbach also draws attention to the shape of the Gaussians (shown in Fig 6), noting in particular that "...summer high temperature comes to a point, while the winter low is rounded". But again, however, he needs search no further for an explanation than the insolation pattern:
(Wikipedia)
I mentioned in my introduction that Eschenback presents data that "...at first glance looks like evidence for his hypothesis". It should not be plain, however, that it is onlyh at a first, and superficial glance that that is true. His most convincing evidence turns out to be a direct consequene of the patterns of insolation at, or near the equator. The more direct evidence is seen to contradict his claim of a hard limit, showing as it does a less defined limit to temperatures in the warmest months - the exact opposite of what is required by his hypothesis. It is only by maintaining a superficial glance, and by not paying attention to actual forcings that his hypothesis appears to have any support at all.
Russ,
There are now approximately 13 posts relating to the land temperatures at Kritimati island. You brought up this subject as your primary argument to support your wild claim that there is a "wall" to surface sea temperatures. You have provided no reason why the land temperature at Kritimati Island would relate to the sea temperature in the Pacific Warm Pool 3,000 miles away, or even why any current land temperature would relate to a future maximum sea temperature even if it was nearby. The thermal mass of the ocean controls the land temperatures of very small, low islands like Kritimati and Tarawa except for rare occasions like the calms Tom described. You have provided no additional data or citations to support your wild claim. The moderator has to ask what your point is. Tom has provided copious data showing current sea temperatures are frequently over 31C and as high as 35C. What is the point of your argument about Kritimati Island land temperatures? How does it relate to your wild claim of a "wall" in sea temperatures?
Perhaps I should have said that you were in violation of the policy against excessive repetition instead of sloganeering, I see the moderator has warned you again. Please address the points of fact that you have previously ignored instead of making useless rhetorical points.
Why do you bother posting here when you apparently have no interest in the data or peer reviewed reports?
When does the magical cooling mechanism kick in? Does it automatically occur regardless of what Hadley and Walker circulation are doing to cloudiness? I note that in, for example, Palau, rainfall shows a pretty flat trend despite temp rising (Figs. 10.3 & 10.4).
I would note that tropical sea surface temperatures are considered to have been rather higher during the Eemian, which is in and of itself sufficient data to disprove a 'thermostat' hypothesis.
KR, the ridiculousness of the "hard limit" theory as an argument against climate change is multiple. It is not supported by the basic data. It has no physical basis. It contradicts the fact that higher SST determined in the past by proxies as you note, including some as high as 40 C. It is accepted, therefore, not on any scientific basis, but out of desperation to believe that global warming cannot be harmfull. The problem is, it fails even that purpose.
Taking Palau as an example, the average SST in the warmest month in Palau is 29.2 C. The rise in SST expected at Palau in the warm scenario is 2.5 C. Consequently, with current predictions of global warming, in a BAU scenario we expect ocean temperatures in the Pacific Warm Pool to rise to 31.7 C, ie, below the "wall". That is, still below any reasonable estimate of the "wall". So even if this absurd hypothesis were true, it might possibly limit warming a little next century, but this century it is irrelevant anyway.
Tom Curtis - The 'thermostat' hypothesis has been seriously proposed in the literature, as per Lindzen's Iris papers; and as noted in this discussion it has been shown to be false. It just doesn't hold up under examination, under the data.
But as with the ongoing Lindzen papers (repeating the same claims while ignoring published rebuttals) and with hobbyists like Eschenbach at WUWT, it appears to be (IMO) attractive as some kind of magical counteraction to AGW, something that absolves us of any responsibility to change. And as such I expect that this mythical thermostat will continue to be invoked by those in denial, or who are relatively uninformed about the science.
Tom,
I was amazed to see your data on sea temperatures showing the hottest temperatures outside the equatorial region. Your chart of solar insolation was a remarkable explaination of the data. I will have to look at the ocean temperature charts a lot more carefully to find the hot spots away from the equator.
Michael Sweet @21, Eschenbach also showed a map of the locations in which SST excedes 30 C (Fig 5, AOTM):
The contrast between the West and East Pacific makes it very clear that ocean currents and prevailing winds are a major factor in determining the upper reach of SST. The mixing of cold waters with surface waters of Peru makes temperatures greater than 30 C effectively impossible under current conditions, for example.
Further, and as you can see, in general 30 C SST occurs at higher latitudes in the NH than in the SH, and is more likely to occur in enclosed waters (Sea of Japan, Mozambique Channel) than in open waters. The two phenomena are related, of course. There are more enclosed waters in the NH than in the SH.
The importance of enclosed waters is not that they are shallow. (The Persian Gulf is shallow, but the other enclosed waters with high SST are not.) Rather, it is that they limit mixing with nearby cold water. That is made particularly clear in the Arabian Sea and the Bay of Bengal, which are both wide enough to present no significant restriction on mixing. Despite that they also experience very warm temperatures because the only significant body of water they can mix with are equatorial waters to the south, which are warm year round rather than just seasonally.
As noted, the impact of limited mixing explains why there are higher SST in the NH than occur in the SH, despite the fact that the SH recieves more insolation. So, as you would expect, insolation does not explain everything.
Finally, the peak daily TOA insolation is found outside the tropics, as can be seen from the wikipedia chart above. That does not result in peak SST outside the tropics (ignoring the Persian Gulf). That may be in part because outside the sub-tropics, the surface has a net energy deficit:
As a result, prolonged sunlight may not lift temperatures above levels in which they are close to energy balance. Further, at higher latitude, the rate of warming will be slower, so that temperatures will not rise to very high levels until many hours after noon, by which time insolation is falling again. These two factors complicate the issue, so that I would not like to predict the latitude of maximum SST even in a pure waterworld with no lateral mixing. It will not be confined to the equator, however, and probably shifts seasonally across the equator.
So, the situation is not a simple as my exposition above may suggest. Never-the-less, it is ironic that Eschenbach picked as his two primary pieces of evidence facts that are explicable in terms of insolation alone (ie, the shapes and relative positioning of the gaussians and the relative peakiness of summer vs winter periods.