Climate Science Glossary

Term Lookup

Enter a term in the search box to find its definition.

Settings

Use the controls in the far right panel to increase or decrease the number of terms automatically displayed (or to completely turn that feature off).

Term Lookup

Settings


All IPCC definitions taken from Climate Change 2007: The Physical Science Basis. Working Group I Contribution to the Fourth Assessment Report of the Intergovernmental Panel on Climate Change, Annex I, Glossary, pp. 941-954. Cambridge University Press.

Home Arguments Software Resources Comments The Consensus Project Translations About Support

Bluesky Facebook LinkedIn Mastodon MeWe

Twitter YouTube RSS Posts RSS Comments Email Subscribe


Climate's changed before
It's the sun
It's not bad
There is no consensus
It's cooling
Models are unreliable
Temp record is unreliable
Animals and plants can adapt
It hasn't warmed since 1998
Antarctica is gaining ice
View All Arguments...


Username
Password
New? Register here
Forgot your password?

Latest Posts

Archives

The upcoming ice age has been postponed indefinitely

Posted on 27 January 2010 by John Cook

The 9th most popular skeptic argument is that we're heading into an ice age. The whole premise of the website Ice Age Now is that a new ice age could begin any day. Considering the skeptic aversion towards alarmism, it's surprising that this idea has gained so much traction. In the interest of lowering skeptics' stress levels, its time to put all those ice age fears to rest once and for all.

Just a few centuries ago, the planet experienced a mild ice age, quaintly dubbed the Little Ice Age. Part of the Little Ice Age coincided with a period of low solar activity termed the Maunder Minimum (named after astronomer Edward Maunder). It's believed that a combination of lower solar output and high volcanic activity were a major contributor (Free 1999, Crowley 2001), with changes in ocean circulation also having an effect on European temperatures (Mann 2002). 
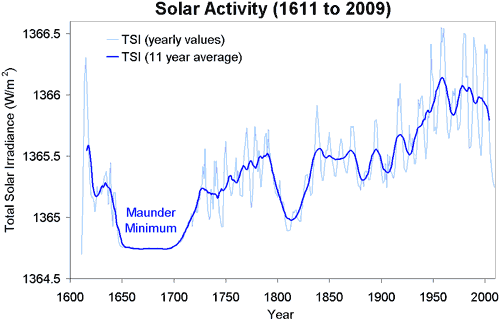
Solar Activity - Total Solar Irradiance (TSI) including Maunder Minimum
Figure 1: Total Solar Irradiance (TSI). TSI from 1880 to 1978 from
Solanki. TSI from 1979 to 2009 from PMOD. 

Could we be heading into another Maunder Minimum? Solar activity is currently showing a long term cooling trend. 2009 saw solar output at its lowest level in over a century. However, predicting future solar activity is problematic. The transition from a period of 'grand maxima' (the situation in the latter 20th century) to a 'grand minima' (eg - Maunder Minimum conditions) is a chaotic process and difficult to predict (Usoskin 2007).

Let's say for the sake of argument that the sun does enter another Maunder Minimum over the next century. What effect would this have on Earth's climate? The difference in solar radiative forcing between Maunder Minimum levels and current solar activity is estimated between 0.17 W/m2 (Wang 2005) to 0.23 W/m2 (Krivova 2007). In contrast, the radiative forcing of CO2 since pre-industrial times is 1.66 W/m2 (IPCC AR4), far outstripping solar influence. Add to this the extra CO2 emitted in upcoming decades and other greenhouse gases such as methane. The warming from man-made greenhouse gases far outstrips any potential cooling even if the sun was to return to Maunder Minimum levels. 

However, our climate has experienced much more dramatic change than the Little Ice Age. Over the past 400,000 years, the planet has experienced ice age conditions, punctuated every 100,000 years or so by brief warm intervals. These warm periods, called interglacials, typically last around 10,000 years. Our current interglacial began around 11,000 years ago. Could we be on the brink of the end of our interglacial?
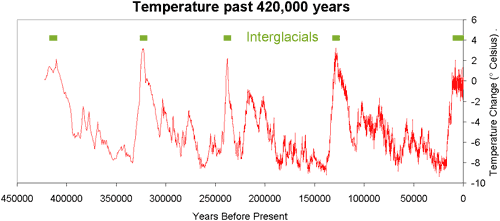
Temperature of Vostok, Antarctica including interglacials and Milankovitch cycles
Figure 2: Temperature change at Vostok, Antarctica (Barnola 2003). Interglacial periods are marked in green.

How do ice ages begin? Changes in the earth's orbit cause less sunlight (insolation) to fall on the northern hemisphere during summer. Northern ice sheets melt less during summer and gradually grow over thousands of years. This increases the Earth's albedo which amplifies the cooling, spreading the ice sheets further. This process lasts around 10,000 to 20,000 years, bringing the planet into an ice age.

Not all interglacials last the same amount of time. An ice core from Dome C, Antarctica offered a glimpse of temperatures going back 720,000 years. Climatic conditions 420,000 years ago were similar to current conditions. At that time, the interglacial lasted 28,000 years, suggesting our current interglacial may have lasted a similar period without human intervention (Augustin 2004).

The similar conditions between now and 400,000 years ago are due to similar configurations in the Earth's orbit. At both times, the forcing from orbital variations showed much less change then in other interglacials. Simulations with the current orbit find that even without CO2 emissions, the current interglacial is expected to last at least 15,000 years (Berger 2002).

Of course, the question of how long our interglacial lasts without human intervention is moot. We are intervening. So what effect do our CO2 emissions have on any future ice ages? This question is examined in one study that examines the glaciation "trigger" - the required drop in summer northern insolation to begin the process of growing ice sheets (Archer 2005). The more CO2 there is in the atmosphere, the lower insolation needs to drop to trigger glaciation.

Figure 3 examines the climate response to various CO2 emission scenarios. The green line is the natural response without CO2 emissions. Blue represents an anthropogenic release of 300 gigatonnes of carbon - we have already passed this mark. Release of 1000 gigatonnes of carbon (orange line) would prevent an ice age for 130,000 years. If anthropogenic carbon release were 5000 gigatonnes or more, glaciation will be avoided for at least half a million years. As things stand now, the combination of relatively weak orbital forcing and the long atmospheric lifetime of carbon dioxide is likely to generate a longer interglacial period than has been seen in the last 2.6 million years.
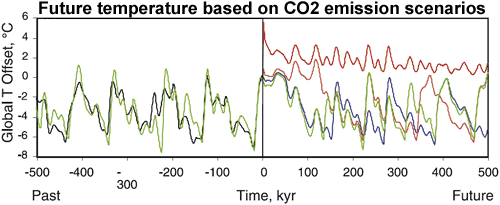
Future temperature rise based on various CO2 emission scenarios
Figure 3. Effect of fossil fuel CO2 on the future evolution of global mean temperature. Green represents natural evolution, blue represents the results of anthropogenic release of 300 Gton C, orange is 1000 Gton C, and red is 5000 Gton C (Archer 2005).

So we can rest assured, there is no ice age around the corner. To those with lingering doubts that an ice age might be imminent, turn your eyes towards the northern ice sheets. If they're growing, then yes, the 10,000 year process of glaciation may have begun. However, currently the Arctic permafrost is degrading, Arctic sea ice is melting and the Greenland ice sheet is losing mass at an accelerating rate. These are hardly good conditions for an imminent ice age.

Thanks to John Cross for putting me onto a few very relevant papers while preparing this post. 

0 0

Printable Version  |  Link to this page

Comments

Comments 1 to 44:

  1. Brilliant work as always, John!
    0 0
  2. Excellent piece. Many people find the Interglacials graph especially persuasive; which is why it pops up on skeptic blogs again and again.
    0 0
  3. Excelent work. One minor flaw that needs to be fixed - reference for the first part of figure 1.
    0 0
    Response: Not sure what you mean - what is the flaw?
  4. "solar activity is estimated between 0.17 W/m2 (Wang 2005) to 0.23 W/m2 (Krivova 2007)." The sun - the climate - is not only a change in TSI. I recommend my comment here: http://www.skepticalscience.com/1500-year-natural-cycle.htm "In contrast, the radiative forcing of CO2 since pre-industrial times is 1.66 W/m2 (IPCC AR4)" But for example, Lindzen has "a different view" about total RF of CO2; see: http://www.americanthinker.com/Attachment%202.PNG; and http://lh4.ggpht.com/.../lindzen-choi-model-vs-reality.JPG
    0 0
    Response: Lindzen is not talking about the radiative forcing of CO2. He's talking about the climate response to radiative forcing. Eg - climate sensitivity. Lindzen believes climate is less sensitive to radiative forcing than is commonly thought. As far as the current topic of ice ages go, the climate response to a cooling sun would be even less according to Lindzen than is conventionally thought.

    Coincidentally, the topic of climate sensitivity and the work of Lindzen will be addressed in the next post within a day or two.
  5. I remember being told that the Gulf Stream that brings warm waters from the equator to the North eastern Atlantic could effectively be shut off if global warming continues. I can’t remember the exact argument as it was some years ago in a Geochemistry lecture, but I believe that it was something to do with the warm water being too buoyant (due to salinity) to sink at the poles as they cool and drive the ocean circulation current. If this was to happen, would that not cause a drop in temperature across Europe, increasing the Earth's albedo and cause the start of another ice age? I know that this screams of that awful film “The Day After Tomorrow”, but is there any credibility in this happening over a more realistic timescale?
    0 0
  6. Arkadiusz Semczyszak-Lindzen can be readily dismissed IMHO. His study into the impacts of the Iris Effect have been found to be largely incorrect, because the Iris Effect lets in more energy than it lets out-as shown by the CERES satellite data. I've little doubt that Lindzen is incorrect on most other factors related to global warming too, as his vision is a little distorted by the views of his....benefactors. Also, American Thinker is hardly a quality source of unbiased reporting. It is Far Right in *all* its viewpoints.
    0 0
  7. Arkadiusz Semczyszak writes: But for example, Lindzen has "a different view" about total RF of CO2; see [...] lindzen-choi-model-vs-reality.JPG I wouldn't put much weight on Lindzen & Choi 2009; it has a multitude of serious flaws that have been well documented elsewhere. See here, here, here, and here. Lindzen is one of the very, very few actual climate scientists who doesn't accept the consensus understanding of climate change. The exceptionally poor quality of L&C 2009 ought to tell us something about how weak that contrarian position is. Likewise, the fact that so many self-described "skeptics" were willing to uncritically accept the L&C 2009 paper without a second look is a nice demonstration of how credulous rather than skeptical most of these so-called skeptics are. A genuine skeptic would subject claims on all sides of a question to close examination. In the case of "climate skeptics" however, there's a fascinating combination of extreme, exaggerated skepticism towards mainstream climate science coupled with an utter lack of skepticism towards any paper, no matter how weak, that appears to contradict mainstream climate science. More examples of this phenomenon can be seen in the non-skeptical "skeptic" response to Chylek and to Khilyuk and Chilingar.
    0 0
  8. Fitz, Apparently the likelihood of the Gulf Stream switching off is not high: W.S. Broecker (1999) What If the Conveyor Were to Shut Down? GSA Today 9, 1-7 http://faculty.washington.edu/wcalvin/teaching/Broecker99.html see also discussion here: http://www.realclimate.org/index.php/archives/2005/05/gulf-stream-slowdown/ ...and if it did shut down, apparently this wouldn't be able to trigger an ice age: T. Kuhlbrodt et al. (2009) An Integrated Assessment of changes in the thermohaline circulation Climatic Change 96, 489-537 http://www.springerlink.com/content/75233057q541716x/?p=a742b208fb45474cb847ee5ac0b1aa37&pi=3
    0 0
  9. Hi John Nice. WRT comment 3, the columns are not labeled in the referenced table but they are further up the link. The data goes from 1611 to 2004 both in the figure and at Solanke's web site. I wouldn't call this a big flaw but the figure legend says 1880 to 1978. :) Does the data during the overlap align? Thank you Tony
    0 0
    Response: The Solanki TSI reconstruction and the PMOD satellite data do overlap after 1978. They show good correlation but I go with the PMOD satellite data as it's always better to use directly measured data over proxy reconstructions if you've got the option. I go into the construction of this graph some more here...
  10. Don't neglect the fact that some ice age enthusiast like to assert that back in the 1970's the whole climate science community was all behind the belief that we were headed for an ice age. (Cue for them to pull out a dusty copy of Newsweek.) That assertion was debunked by Peterson, et. al. in Sept. 2008 BAMS "The Myth of the 1970s Global Cooling Consensus."
    0 0
    Response: Been there, debunked that. Interestingly, an ice age was predicted in the 1970s is the 8th most popular skeptic argument, narrowly pipping we're heading into an ice age.
  11. -Response: -Not sure what you mean - what is the flaw? Maybe a misunderstanding of my behalf - figure 1 shows solar activity from 1611, but Solankis data dates only back to 1880. Never mind, good post.
    0 0
  12. @11 If you click on the link for Solanki's data in the reference the set it self starts in 1611. Yeh im not sure where the 1880 figure comes from either.
    0 0
  13. I get it now - cheers, should have checked the link. I thought the part from 1611-1880 was from another source.
    0 0
  14. Fascinating stuff thank you - but still only one variable in the the overall equation I would suggest.
    0 0
  15. American Thinker also regularly proves that their climate/science writers are dumb as stumps when it comes to actual science. I've lost count of the number of times that they talk about Mars' climate as if it has some bearing on the Earth's climate, especially when they say "Mars is warming, so that explains global warming here on Earth" in the same post as they say "the Earth's cooling trend is driven by the sun." Both statements cannot be true.
    0 0
  16. ^Don't you understand? The sun is causing Global Warming by cooling and driving us into an Ice Age. Makes perfect sense.
    0 0
  17. Let's make it straight. We are not heading into an ice age, we are in one from several million years ago until right now. As long as we have huge permanent ice sheets in the vicinities of both poles, it is an ice age. The extent of ice sheets, mainly around the arctic may vary. There are transient warming episodes called interglacials when the northern ice sheet contracts to Greenland. We are just in such a phase. You may also notice in figure 2 that during the brief interglacials climate is more stable than otherwise. Even with that in mind the stability of the last 8000 years is absolutely exceptional.
    0 0
  18. Berényi Péter said:
    Even with that in mind the stability of the last 8000 years is absolutely exceptional.
    That is why it is critical that we stop/slowdown the rapid changes we have introduced into the climate by release of greenhouse gases. Mankind is dependent on a stable climate.
    0 0
  19. Re causes of the LIA, Ruddiman (2003, 2007, 2008) suggests that a draw down of atmospheric CO2 caused by reforestation in Europe and the Americas in the wake of human population decreases due to pandemics also contributed to lower Northern Hemisphere temps.
    0 0
  20. One of the criteria needed for an ice age to occur (beyond lower temperatures) is precipitation. As long as the arctic ocean remained frozen year round, the arctic climate was arid with very little annual precipitation. Now with the arctic ice disappearing, we will likely see greater precipitation happening in the northern hemisphere. During the last ice age, a part of the arctic waters remained open, thereby fueling the snow which accumulated as ice. Another point - the cold air patterns that engulfed North America this past winter - dipping as far south as Houston Texas which got snow, followed a similar pattern to the continental glaciers that covered a part of North America some 12,000 years ago. Finally, assuming that the patterns depicted in the temp graph illustrating temps for the past 420,000 years, it would appear that we (the earth) are due a relapse of falling temperatures which could be the initial stages of an ice age.
    0 0
    Response: "assuming that the patterns depicted in the temp graph illustrating temps for the past 420,000 years, it would appear that we (the earth) are due a relapse of falling temperatures which could be the initial stages of an ice age"

    Can I recommend that you find the place in the above article where it says "Our current interglacial began around 11,000 years ago. Could we be on the brink of the end of our interglacial?" then continue reading...
  21. "Considering the skeptic aversion towards alarmism," I find so-called "skeptics" to be highly alarmist. Most of them claim that moving away from fossil fuels will result in economic catastrophe - a conclusion not supported by any objective economic studies. As to the topic of this post, possibly avoiding an ice age 50,000 years from now might be a benefit of global warming, assuming human civilization survives that long (but what of the next 100 to 1000 years). I occasionally see skeptics argue this point, in between claiming global warming isn't an immediate problem so there's no need to worry.
    0 0
  22. One final comment - the Greenland ice sheet is melting at its periphery. In a warming climate, both melting around the margins and precipitation in the interior increase, causing the ice sheet to grow in the middle and shrink at the edges. The added weight of snow accumulation in the center creates pressure forcing the ice to flow out towards the edges. http://svs.gsfc.nasa.gov/vis/a010000/a010100/a010152/ http://www.co2science.org/articles/V8/N44/C1.php
    0 0
    Response: A common way that skeptics mislead is by focusing on one narrow piece of data while neglecting the broader picture. Greenland is a classic example of this form of misdirection. The CO2 Science page you link to talks about Greenland gaining ice in the interior - hence they conclude "the Greenland Ice Sheet continues to accumulate mass" and "This finding does not bode well for those who have cried "the ice sheet is shrinking" so vociferously and for so long a time".

    However, satellite gravity measurements of the entire Greenland ice sheet find that it's losing ice mass at an accelerating rate - in fact, even faster than the much larger Antarctica.

  23. Geo Guy needs to talk to some Astronomy Chick, who would make clear that we know where we are in the current milankovich cycle ...
    0 0
  24. Although a little out of date perhaps, this page gives this issue a much wider perspective than a mere 450000 years: http://www.geocraft.com/WVFossils/ice_ages.html It is interesting to note that a number of eminent Geologists are sceptics - perhaps because they look at this issue from a wider perspective - tens of millions of years, not just a few thousand. There is also information on the Geocraft site that would seem to suggest that in the past there has been no demonstrable relationship between atmospheric levels of CO2 and the onset of an Ice Age.
    0 0
    Response: We touch on the past relationship between CO2 and temperature in CO2 was higher in the past. If you really want to broaden your mind on the CO2 relationship with climate, I strongly recommend viewing the excellent lecture by Richard Alley, The biggest Control Knob: Carbon Dioxide in Earth’s Climate History.
  25. I've got a paper at home about a field study that didn't find evidence of the LIA in a fjord off the Antarctic Peninsula. Good stuff, and in my "blog queue." I'll see if I can dig it up and post the link here tonight.
    0 0
  26. Great post. A minor flaw I think is to plot the solar TSI curve and then discuss forcing. In the case of solar forcing, one divides the TSI values by four, right? From your first plot, one would infer that the difference between the Maunder Minimum levels and current solar activity is of order 1W/m2, which, if divided by four, would be quite close to the values of solar forcing that you quote, that is: ...between 0.17 W/m2 (Wang 2005) to 0.23 W/m2 (Krivova 2007).
    0 0
    Response: "In the case of solar forcing, one divides the TSI values by four, right?"

    Close. Firstly, yes, to convert the change in Total Solar Irradiance to radiative forcing, you need to divide by four (the difference between the surface area of a disc which is how Earth absorbs sunlight and the surface area of a sphere). But you also need to remove another 30% of this value to take into account the albedo of the Earth.

    So Solar Forcing = ΔTSI * 0.7 * 0.25 = ΔTSI * 0.175

    Wang 2005 found the change in TSI since the Maunder Minimum was ~ 1 Wm-2. This translates to a radiative forcing of 0.175 Wm-2. Similarly, Krivova 2007 finds the increase in the solar total irradiance since the Maunder minimum is 1.3 Wm-2 which translates to a radiative forcing of 0.2275 Wm-2.
  27. Thanks John, A really interesting topic. Very much related is the question of short term climate sensitivity to long term climate sensitivity. Once the slow feed backs are added it would appear the climate can be extremely sensitive to tiny changes in forcing. But it does not follow that it will continue to be as extremely sensitive once the slow feed-backs have run their course. Or have I misread Ruddiman? (always possible)
    0 0
  28. Ubique (#24), I'm not sure Monte Heib (author of geocraft.com) is an "eminent" geologist. From what I gather, he's intimately tied to the WV coal mining industry. No surprise he wants to push the idea that burning coal is harmless. Scanning his site, I find his writing style to be a bit weird: "Human's did not cause the greenhouse effect, but critics maintain human additions to atmospheric greenhouse gases may cause global temperatures to rise too much." Who are these "critics"? Why not just say "scientists"? Perhaps he sees them more as "critics", since their research has implications for his industry. "Generally understood, but rarely publicized is the fact that 95% of the greenhouse effect is due solely to natural water vapor." Common skeptic fallacy: http://www.skepticalscience.com/water-vapor-greenhouse-gas.htm "Overall, U.S. temperatures show no significant warming trend over the last 100 years (1). This has been well - established but not well - publicized." Interestingly, he then follows with a chart of U.S. mean temperature that shows a strong linear trend through the period of record.
    0 0
  29. @17. The only reason temperatures were so much warmer several million years ago is because CO2 concentrations in the atmosphere were several times higher than they are today. The entire Quaternary period has been dominated by an average global temperature of 15 degrees C, which seems to be the ideal conditions for human agriculture & civilization. The only way in which we'll see a return of "hot-house Earth" is if (a) solar irradiance increases substantially or (b) we return CO2 concentrations in the atmosphere to levels unseen since the Cretaceous Era. Such a scenario would undoubtedly bring an end to human civilization.
    0 0
  30. NewYorkJ(#28 Thank you for that. I am neither a convinced sceptic nor alarmist - just an average guy trying to make sense of all this stuff as I have a professional interest in the application of this science. But it seems that one cannot be neutral in this debate - so at the moment I must err on the sceptic side as I am still asking questions and trying to keep an OPEN mind rather than trying to BROADEN it as John suggested rather tartly in his response to my post. I was thinking of Professor Ian Plimmer when I said eminent geologists, not the author of Geocraft who I would not know from Adam - apologies if I implied the latter. As a result of "Climategate" I am not sure whose information to trust - along with a great many other people on the edge of this issue I would imagine!
    0 0
  31. Ubique, Ian Plimer is a poor choice to hold up as an "eminent geologist." His opinions on climate are complete nonsense--not just wrong, but really far, far off. Just one of many places you can find detailed rebuttals to his claims is Deltoid.
    0 0
  32. Hi Tom. (#31) You may or may not be right. What Professor Plimmer says about climate does not stop him being an eminent geologist though! His academic qualifications and awards look pretty impressive.
    0 0
    Response: Ian Plimer is a qualified scientist, which makes the statements he makes all the more baffling. Having read his book and listened to his interviews, I've heard him make the following statements: Most perplexing for me is that he continues to repeat these falsehoods after his errors have been pointed out to him, with utmost confidence and contempt for, well, nearly every climate scientist in the world. I see him debate Barry Brook live this afternoon in Brisbane so maybe I'll gain more an insight then.
  33. I did read it and here is my response: - to attribute glacial periods to simply variations in the earth's orbit is somewhat simplistic given hat there are a lot of other parameters that affect whether glaciation occurs or not. Just having cooler temperatures is not enough - you also need precipitation in the form of snow such that accumulation exceeds melting. In addition to orbital variation, ocean currents and solar & cosmic radiation all factor into the equation.
    0 0
  34. Finally found the paper I referenced above (#25) "High-resolution Holocene climate record from Maxwell Bay, South Shetland Islands, Antarctica", K.T. Milliken, J.B. Anderson, J.S. Wellner, S.M. Bohaty, and P.L. Manley, GSA Bulletin, November/December 2009; V 121; no. 11/12; p 1711-1725; doi: 10.1130/B26478.1 From the abstract (as I have yet to read through the whole thing for a blog post): "After 2.6 ka, the climate varied slightly, causing only subtle variation in glacier grounding lines. There is no compelling evidence for a Little Ice Age readvance in Maxwell Bay. The current warming and associated glacial response in the northern Antarctic Peninsula appears to be unprecedented in its synchronicity and widespread impact." Not being a glacier expert, it'll take me some time to make heads or tails of this particular paper, but it looks like the authors are trying to determine if the current meltback on the Antarctic Peninsula has antecedents or not. Cool stuff.
    0 0
  35. What is the expected surface temperature change caused by the change of radiative forcing due to the maunder minimium? If you are saying that the change in radiative forcing is about 0.2 and given a change of 1 leads to a surface temperature change of ~0.6oC then are we looking at an estimated drop in temperature of 0.12oC. How did this ever manifest itself in any noticable change in the climate? It's the difference between 2005s climate and 2010s climate.
    0 0
  36. re #35 The temperature minimum at the Maunder minimum has been examined in some detail. The solar irradiance contribution from suppressed solar activity is considered to have been as much as 0.2 oC globally averaged compared to the mid-20th century level (top article and your own analysis). The Maunder Minimum (MM) and the Little Ice Age (LIA)was also a period of considerable volcanic activity, and this is expected to suppress the temperature (globally-averaged) by around another 0.1 oC. This can pretty much cover the full extent of the MM/LIA cooling when considering a global (or even N. hemisphere average). For example, the most variable paleoreconstruction covering the last ~ 2000 years [*] indicates that the "baseline" (N hemisphere-averaged) temperature was around -0.4 oC (compared to mid-20th century) for several hundred years before the Medieval warm Period (MWP). NH temp rose to ~ 0 oC (relative to mid-20th century) at the height of the MWP around 1000 AD, and dropped to around -0.7 oC at the depths of the MM/LIA (see Figure 2 of Moberg et al [*]): [****] A. Moberg et al. (2005) Highly variable Northern Hemisphere temperatures reconstructed from low- and high-resolution proxy data Nature 433, 613-617 coast.gkss.de/staff/storch/pdf/moberg.nature.0502.pdf Since global (hemispherically-averaged temperature changes are concentrated over land and often "focussed" in the high N. latitudes, a temperature drop of -0.3oC, can equate to a much larger temperature drop (-1 oC or more) in Western Europe where the LIA is documented. Likewise there is evidence that the Gulf Stream intensity was reduced during the period of the LIA (perhaps in response to reduced solar forcing) [**], and this is likely to have reinforced a gradient of cooling in the N. hemisphere with the Western Europe fringes getting the largest cooling whack...thus those pretty pictures of revellers on the frozen Thames, and hunters in the snow in Holland by Breugel... [**] Lund DC (2006) Gulf Stream density structure and transport during the past millennium Nature 444, 601-604 http://www.nature.com/nature/journal/v444/n7119/abs/nature05277.html
    0 0
  37. John, 'The burp from one volcanic eruption would overpower all the CO2 humans have ever emitted'. The numbers say otherwise as does the CO2 record which shows not a blip during the 20th Century's largest volcanic eruptions. Do you think he might be referring to the eruption of a super volcano – such as the one under Yellowstone National Park – rather than one like Mt St Helens in British Columbia in Canada? I lived in Canada down wind of that one when it blew and it certainly had an effect upon the climate locally. When Yellowstone blows (overdue they tell us) the impact will be global.
    0 0
  38. Ubique. From everything I've read on Yellowstone, if it erupts it won't cause warming-it will cause extreme, localized cooling (not unlike a nuclear winter). If it blows, you can pretty much say goodbye to the bulk of the human & animal population of North America for the next few centuries at least. However, just like the possibility of rogue asteroids, it would be extremely foolish to do nothing to prevent man-made global warming just because of the 1:1,000,000 chance of a super-volcano explosion.
    0 0
  39. Actually, Chris, they reckon something similar happened around 4,000 years ago-a slowing of the Gulf Stream caused an extreme cool period in Europe whilst causing a major drought to Egypt & the Middle East-the drought which brought down the Egyptian Old Kingdom.
    0 0
  40. I think there's some confusion there between (a) a huge explosive event at, say, Yellowstone, which could potentially inject a lot of aerosols into the stratosphere, and (b) a broad-scale, multi-century flood basalt event like the Siberian traps or Deccan traps, which would outgas a lot of CO2. Yes they're both catastrophic volcanism but the climate impacts are quite different.
    0 0
  41. But neither a Toba/Yellowstone nor a Siberian/Deccan traps event are happening right now, so Plimer's point is just another distraction.
    0 0
  42. Dead right Jim. More to the point, if rising CO2 levels were the result of a multi-century flood basalt event, then we should be able to tell its origin from the levels of C-13, C-12 & C-14 in the background CO2. The fact remains that the CO2 being analyzed is increasingly showing the same ratios of Carbon Isotopes as you'd find when you burn coal & oil-which kind of points the finger right at fossil fuels, if you ask me!
    0 0
  43. How much CO2 will we have to keep emitting to keep glaciation at bay for the next 10k years?

    0 0
  44. In response to your question about the timing of the next potential glacial phase inception, here's what the AR5, WG1, Chapter 5 has to say about that:

    "It is virtually certain that orbital forcing will be unable to trigger widespread glaciation during the next 1000 years. Paleoclimate records indicate that, for orbital configurations close to the present one, glacial inceptions only occurred for atmospheric CO2 concentrations significantly lower than pre-industrial levels. Climate models simulate no glacial inception during the next 50,000 years if CO2 concentrations remain above 300 ppm. {5.8.3, Box 6.2}"

    LINK

    Further:

    "Even in the absence of human perturbations no substantial build-up of ice sheets would occur within the next several thousand years and that the current interglacial would probably last for another 50,000 years. However, moderate anthropogenic cumulative CO2 emissions of 1,000 to 1,500 gigatonnes of carbon will postpone the next glacial inception by at least 100,000 years....under natural conditions alone the Earth system would be expected to remain in the present delicately balanced interglacial climate state, steering clear of both large-scale glaciation of the Northern Hemisphere and its complete deglaciation, for an unusually long time"

    SOURCE

    Looking beyond that, research has found that the ability to offset the next 5 glacial phase inceptions lies within the purview of humans:

    "Our research shows why atmospheric CO2 will not return to pre-industrial levels after we stop burning fossil fuels. It shows that it if we use up all known fossil fuels it doesn't matter at what rate we burn them.

    The result would be the same if we burned them at present rates or at more moderate rates; we would still get the same eventual ice-age-prevention result."

    And

    "Burning all recoverable fossil fuels could lead to avoidance of the next five ice ages."

    SOURCE

    0 0

You need to be logged in to post a comment. Login via the left margin or if you're new, register here.


The Consensus Project Website

THE ESCALATOR

(free to republish)


© Copyright 2024 John Cook
Home | Translations | About Us | Privacy | Contact Us