


 Arguments


So what's really happening in Antarctica?
Posted on 20 November 2015 by Guest Author
This is a re-post from RealClimate by Jonathan Bamber at U of Bristol
The recent paper by Zwally et al. in the Journal of Glaciology has been widely reported as evidence that Antarctic is gaining mass, and hence lowering sea level. Is it? Expert Jonathan Bamber weighs in.
There have been quite few big media stories related to Antarctica recently, including a paper on the irreversible collapse of the marine portion of the West Antarctic Ice Sheet and a NASA-funded study that finds, contrary to numerous previous results, that the Antarctic ice sheet as a whole has been gaining mass between 1992 and 2008. This most recent study received a lot of media attention because it runs counter to what was said in the last IPCC Report. Certain parts of the media hailed this as another sign that the impacts of climate change had somehow been exaggerated a risk that the lead author Jay Zwally was concerned about before the research was published.
So what did Zwally and his colleagues do, what did they find, and why does it contradict a plethora of previous studies that suggest Antarctica has been losing mass over the same time period?
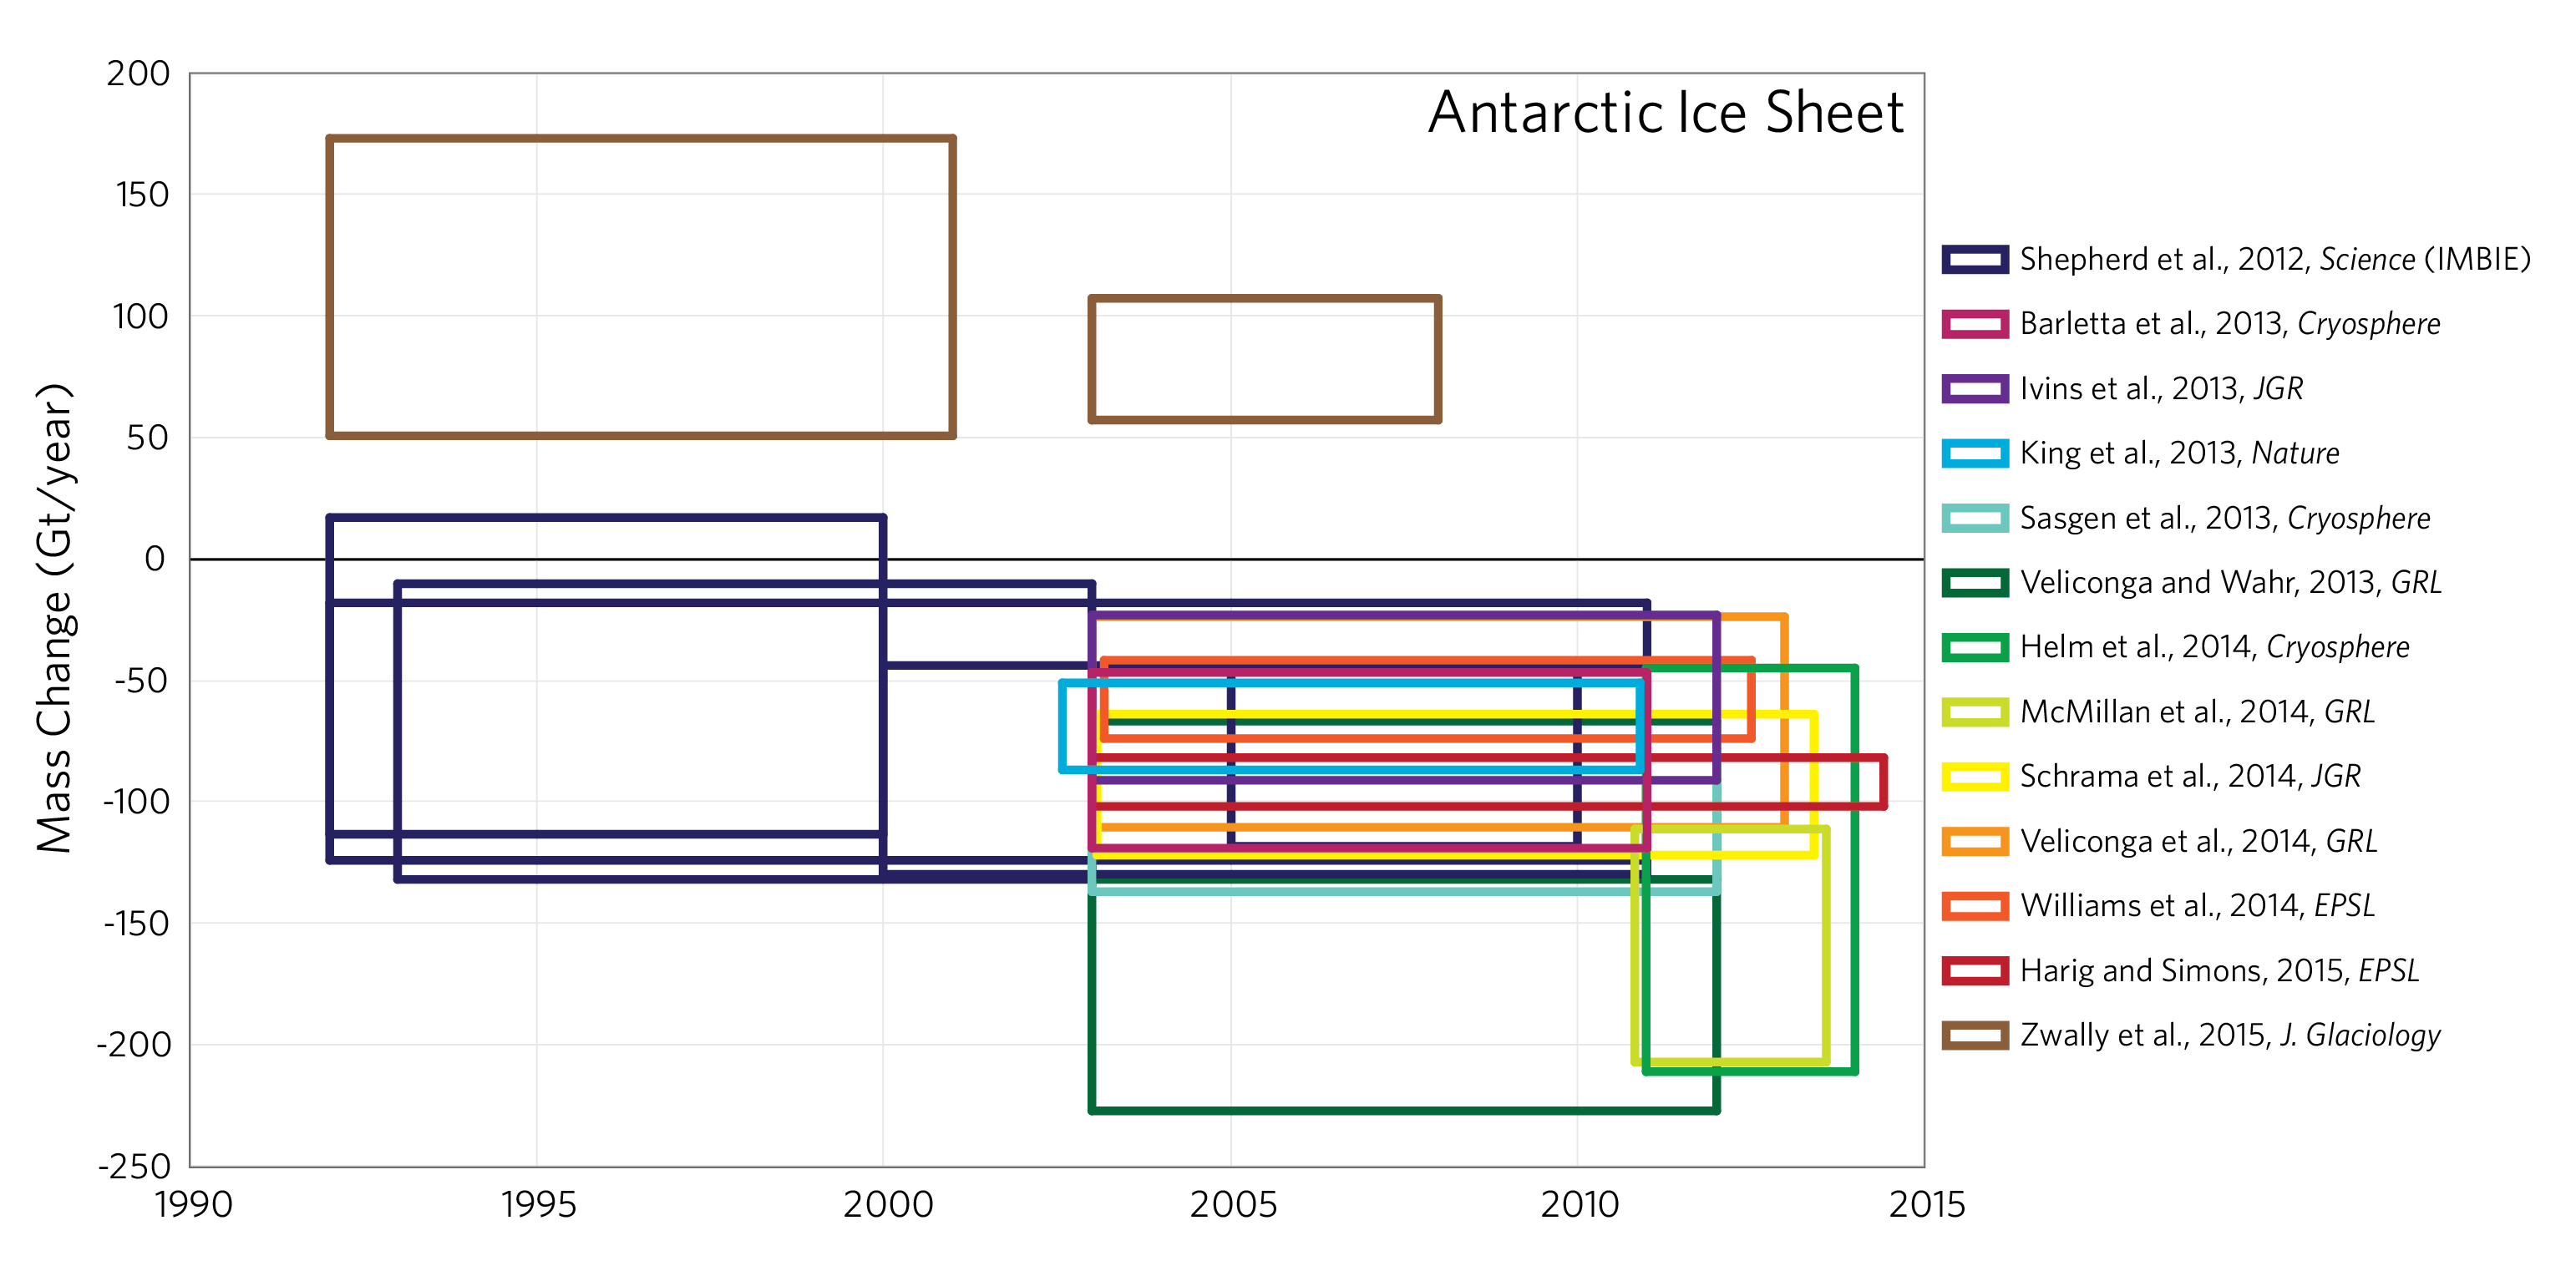
Figure 1. Comparison of various estimates of Antarctic mass balance trends. Vertical dimension of boxes gives the published uncertainty; horizontal gives the time period covered. Figure courtesy of Luke Trusel, Woods Hole Oceanographic Institution.
Zwally and his team measured the changing height of the ice covering Antarctica using two types of instruments — a radar altimeter and a laser altimeter — on two different satellites. The radar provided elevation changes for 1992-2003 and the laser from 2003-2008. They compared the trends in height from the two instruments over a flat part of East Antarctica that covers subglacial Lake Vostok, finding a very good match between the trend for ‘92-’03 and the one for ’03-‘08. So far, so good (though note that they couldn’t compare the two instruments directly because they do not overlap in time.)
Using measurements of elevation change to estimate changes in mass requires knowing the density of the snow. This is the difficult part and one of the key reasons that Zwally’s numbers are so different from previous estimates. The density of snow at the surface of Antarctica is about 1/3 than that of solid ice. Most scientists working with similar data sets agree that over the last ~25 years the surface of the East Antarctic Ice Sheet (EAIS) has been going up very slightly (at about 1-3 cm a year). Previous studies employing altimetry over the EAIS have assumed that the change in elevation is due to a recent increase in snowfall and used a density of snow. They have done this primarily because the interior of the EAIS is moving very slowly and will react very slowly to changes in climate. But there is no evidence for an increase in snowfall from ice cores in East Antarctica and if anything, regional climate models suggest the opposite has been happening over at least the last decade. Zwally and his team argue that instead, mass is actually accumulating in spite of no increase in snowfall. How can this be? The answer is that the ice sheet is still adjusting to the ~doubling snowfall that took place at the end of the last glacial period, between about 18,000 and 12,000 years ago. Because the accumulation rates and temperature in East Antarctica are so low, the ice sheet has a response time to changes in climate of many millennia. So the ice sheet may still be growing even though there has been no increase in accumulation for more than 10 millennia. The difference here is crucial: if the increasing height of 1-3 cm a year is owing to recent increases in snowfall, then we should use the density of snow in the calculation. One cm of snow over the entire East Antarctic Ice Sheet (EAIS) would increase its mass by around 35 Gt (35 billion metric tons). But if the increase in height simply reflects continuing adjustment since the last glacial period, then — Zwally et al. argue — we should be using the density of ice. That would mean an 1 cm increase in height would reflect an increase in mass of ~92 Gt.
But is the density of ice the right one to use? In East Antarctica it takes thousands of years for the snow to form ice. This process is called firn densification (firn is compressed snow) and how fast it occurs depends on snowfall rates and temperature: i.e. climate. If the climate changes, then so does firn densification and the surface of the ice sheet can go up or down with no change in mass but just a change in density of the surface layers. Variations in firn densification rate can be larger than the measured elevation change, so it is essential to correct for this effect and that is usually done with a model. The model requires snowfall and temperature histories to drive it and these aren’t that well known for the EAIS. If we knew the snowfall history perfectly then there wouldn’t be any controversy!
Another problem with this type of measurement is that small biases in the laser and radar data can have a big effect when the signal is only on the order of 1 cm/year. Both instruments suffer from biases and researchers attempt to correct for these in various different ways. Each group has their preferred bias correction approach. In a previous study, published just three years earlier, Zwally and co-workers obtain a volume change from laser altimetry that is only about half the value they get in their latest study. They argue that various improvements to their bias-correction approach and some other subtle differences in processing are responsible for the difference. They also argue that their approach is superior to other studies using altimetry. But it is probably more accurate to say that it is just different, rather than better. Results from the newest satellite that can make this type of elevation measurements, CryoSat 2, which aren’t included in the Zwally et al. study, may yield a different picture yet again (Fig 2). Indeed, comparing results from CryoSat-2 height change for 2011-2014 (Fig 1) with those for 2003-2008 from Zwally and others is not very encouraging. Although inter-annual variability in snowfall is important, the estimate from CryoSat-2 is less than half that from the Zwally laser altimetry result. Such a large difference (about 110%) is more than would be expected from snowfall variations alone. This doesnt show that Zwally et al. results are necessarily wrong, clearly, this is challenging measurement to make, and translating these measurements into mass change adds yet more uncertainty.
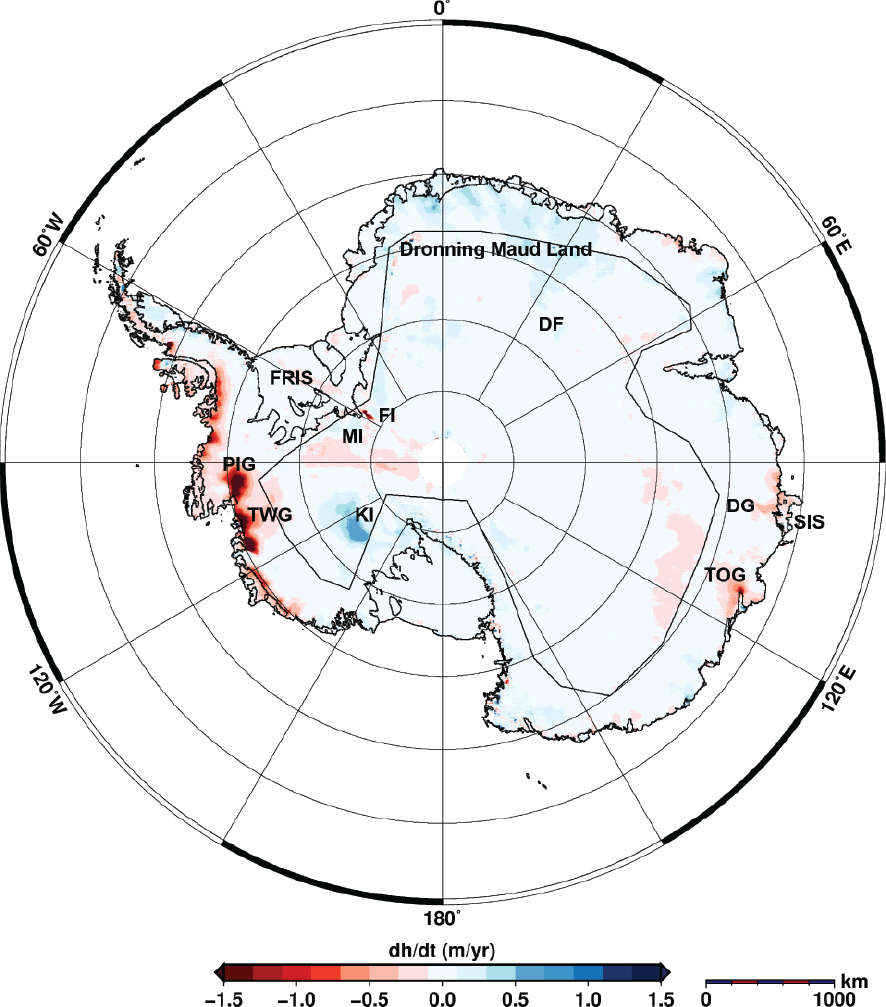
Figure 2. Elevation changes from 2011-2014 from Helm et al., 2014.
Let’s go back to the laser/radar comparison over Lake Vostok. At face value, this looks reassuring. But if you compare the trends between laser and radar data for other parts of the EAIS, the agreement is poor and, depending on the time period you chose for Vostok it can be more or less good there too. Thus, the agreement over Vostok appears to be fortuitous rather than evidence that the two instruments are measuring the same thing in the same way. And this leads on to another issue with the new study: if the thickening over the EAIS is due to a long term trend going back more than 10000 years, it should be indistinguishable from constant over the two time periods discussed. For the whole of the EAIS, the trend for 1992-2003 and 2003-2008 are the same, but at a regional scale (and by regional I mean areas that are still pretty big: the same size as a US state) things become less clear. For some regions the trend more than doubles, for others it goes from negative to positive or vice versa. Some of these differences are small and within the uncertainties. but some are not. The signal simply should not change much at all at this scale if it were due simply to long-term ice sheet adjustment.
Comparing results from CryoSat-2 volume change (not mass) for 2011-2014 (Fig 1) with those for 2003-2008 from Zwally and others is also not very encouraging. Although inter-annual variability in snowfall is important, the estimate from CryoSat-2 is less than half that from the Zwally laser altimetry result. Such a large difference (about 110%) is more than would be expected from snowfall variations.
There is another way to measure the changing mass of the ice sheet and that is to weigh it using the Gravity Recovery and Climate Experiment (GRACE) twin satellites. This mission measures gravity anomalies around the Earth every 10 days and has, for example, been able to detect the groundwater depletion in California in recent years. It can also measure the growth of mass-loss of an ice sheet, but the signal from the ice is confounded by another signal from the bedrock beneath, which is responding to changes in ice loading over thousands of years. This response is known as glacio-isostatic adjustment (GIA), and in the interior of East Antarctica we have very limited information on how big the bedrock signal is. Geophysicists have attempted to model how the solid Earth responds to changes in ice loading and, although the physics is fairly well known, some critical variables such as the viscosity of the lower mantle and the history of ice load changes are not. Zwally argues that the GIA estimates that have been used for correcting GRACE data are wrong in East Antarctica because they do not know the full ice loading history over the last ~22,000 years. Maybe. But GIA in the EAIS is poorly constrained and there is, in general, poor agreement among different estimates of GIA over the EAIS.
So what is really happening? One thing that Zwally’s study does highlight is how difficult it is to nail what is happening in East Antarctica because the signal is small and contaminated by unwanted effects that are as large or even larger. Zwally et al get a different result from previous studies because they make a different set of assumptions. Those assumptions are, by their nature, subjective and difficult, without additional evidence, to corroborate. There are, however, other lines of evidence that suggest that Antarctica is unlikely to have been gaining mass in the last few decades. That would, for example, make closing the sea level budget a whole lot harder (that is, making the sum of the sinks and sources match the observed rate of sea level rise). One other thing is certain: West Antarctica has been losing mass at an increasing rate since the 1990s and, irrespective of what is happening further East, that trend looks set to continue. Going to the other end of the Earth, the Greenland ice sheet has also been losing mass at an accelerating rate since around 1995. Greenland is now the single biggest source of mass to the oceans. These trends at both poles are huge signals that are unequivocal and uncontested.
Help us do science! we’ve teamed up with researcher Paige Brown Jarreau to create a survey of Skeptical Science readers. By participating, you’ll be helping me improve SkS and contributing to SCIENCE on blog readership. You will also get FREE science art from Paige's Photography for participating, as well as a chance to win a t-shirt and other perks! It should only take 10-15 minutes to complete. You can find the survey here: http://bit.ly/mysciblogreaders. For completing the survey, readers will be entered into a drawing for a $50.00 Amazon gift card, as well as for other prizes (i.e. t-shirts).


Hi,
I'm having difficulty reaching the "RealClimate" web site with symptoms suggesting the domain name may have been redirected to someplace else. Is there another source and/or an IP address of the server?
Thanks, Bob Wilson, Huntsville AL
bwilson4web - I've noticed RealClimate has hosting issues from time to time for several years. I suspect this is just another hosting farble, and will be resolved in due course.
The "issue" with RC manifests itself primarily on weekends, as also appears to be the case here.
So it's simply a regular server mainteance or they don't run a server on weekends. No surprise, climate scientists usually don't have too much volunteer money to spare to maintain their ageing server. RC has been running for over 10y with the same graphical appearance which is quite impressive in those days of constant (and not necessarily useful) technology changes.
Not one of your more convincing posts:
"If we knew the snowfall history perfectly then there wouldn’t be any controversy!"
"So what is really happening? One thing that Zwally’s study does highlight is how difficult it is to nail what is happening in East Antarctica because the signal is small and contaminated by unwanted effects that are as large or even large"
" trends at both poles are huge signals that are unequivocal and uncontested."
[DB] Note that this article is a repost. Please refrain from arguments from your personal incredulity, like you have done here.
If you have substantive issues with the content of the article, please cite those specific issues along with a link to a published analysis or examples from the primary literature that support your contentions.
Morgan01944 @5, the full context of your final quote reads:
West Antarctica is indeed at one pole, as Greenland is at another. Further, their trends in ice loss are indeed both huge and uncontested (including by Zwally et al). That it is not clear as to the trend in the East Antarctic Ice Sheet has no bearing on that claim. Ergo, your juxtaposing this quote with the two others, which discuss the reasons for lack of clarity in Eat Antarctica, shows at best careless reading - not a problem with the OP.
@ 5, where did you get this quote from: "If we knew the snowfall history perfectly then there wouldn’t be any controversy!" ?
Tried realclimate and got an immediate redirect to a screen saying
"Offer rdsa____.com" (I'm not posting the full URL, which is spoofed anyhow, nor the actual link that was hidden behind that text, which was long, complicated and suspicious
which changed immediately to
"Win NHL Jersey ____" (also not posting that URL which was also fake covering another long suspicious string of code)
Beware -— looks like it's hidden layers of something rather nasty, hidden under what appears to be mere adware, I think.
Just a note about the Zwally paper. Whilst it has been recently published, the research is much older and I first saw it as a conference paper listed on a NASA page, in 2012. It was also referenced in a Nature article that year. The conference paper had the same title and the same authors (apart from one).
I'm having a hard time comprehending the argument that an increase in precipitation 18,000 to 12,000 years ago could be seen as an increase in mass in recent years. Once a net gain has occurred then we're only talking about redistribution of the mass by ice movement.
Don Burrows @10.
It is not a "redistribution" Zwally is arguing for. Rather it is a millennia-long accumulation he is proposing. The argument is that the snowfall today is not much changed from the snowfall over recent millennia. Prior to this, in the distant past, there was both less snow and less ice. The snow compacts to ice that then, with time, flows off the summits of Antarctica towards the oceans. But the arriving snowfall, while constant over the millennia, is greater than the ice flow. So ice continues to build up as it has over all those millennia.
According to Zwally's paper, not only is Antarctica gaining ice now, but as I understand it, has been for the last 10 millenia. If everything else were equal, that would have meant at least a couple of meters of sea level drop. But we haven't seen that, so what is the source of the water that has kept sea level relatively constant?
If I've misunderstood something, or gotten some facts wrong, I'd appreciate learning where I went wrong.
jimlj @ 12
My background is not in Paleo (although the wife keeps calling me an old git), but the long drawn out retreat of both the Laurentide and Fennoscandian ice sheets would certainly have emptied more than a few gallons into the oceans.
One would also have to factor in the delayed effects of thermal expansion. Even the surface layers of the oceans clearly show this, with oceanic temps reaching their annual maximum several months after the relevant hemispheric summer sostice. Think how long it is going to take for the deep ocean to equilibrate following the Last Glacial Maximum of about 20 - 21 kya.
My limited understanding is that thermosteric effects (i.e. thermal expansion) and eustatic effects (i.e. caused by the addition of extra waters) are currently of comparable magnitude. Taken together, these would account for the sea level rise of around 120+ metres since the LGM. The limked NASA article discusses this effect.
billthefrog @13, as you can see in the video below, the melt of the Laurentide Ice Sheet was essentially over 8 thousand years ago
It appears the fennoscandian ice sheet also essentially disappeared by 5000 kya. Further, since about 8 kya, global temperatures have been slightly falling, or constant so that there is no additional sea level rise due to thermal expansion, and possibly some slight fall. It is not obvious, therefore, that there is a basis to assume compensation for an increase in Antartic ice mass over that period.
As noted at HotWhopper and now DeltoidThe RealClimate difficulty has a, I hope, temporary solution as RC has resorted to a backup server. It may be usefull to update the link in the heading to point to:
http://www.realclimate-backup.org/
Jimlj - that's a very good point. Ocean volume has been static for the last 4-5000 years - with relative sea level fall occurring in the farfield due to the effect of ocean siphoning. Zwally et al not only contradict the bulk of other Antarctic research, but Holocene sea level research too.
I thought to consider whether the Zwally contention could require snowfall to be maintained over a shorter period than the whole Holocene. Could it be a more recent increase and thus reduce the impact on sea level? The Vostok ice core gives ice depth and age from 5,679yBP suggesting that it takes half of the length of the Holocene for high Antarctic snow to compact completely into ice. And much of the compaction would occur in a far shorter time.
But I came away from the Vostok data with more of an appreciation of Zwally's contention. Note in the Vostok data that the annual ice thickness (which Zwally contends is the full cause of surface elevation rise) is 21mm/year thick through the early Holocene but 12mm/year through much of the last ice age (over a 60ky period, 13mm/y over 100ky period so presumably achieving a steady-state condition) providing the sort of additional ice (1cm/year) Zwally is arguing for. So does it not come down to the question of how the multi-kilometre thick ice sheet will react to a multi-millennial increased rate of snowfall. Would the extra snowfall (which the Vostok data suggests has resulted in an extra 120m of ice-equivalent added to the top of the sheet since the LGM) significantly increase the rate of ice flow? Are there other effects at play? Or does Zwally's contention need addressing? Okay it comes with problems for the Holocene SLR record, and the measured elevation change may not be all ice, but with an extra 120m of ice-equivalent on the ice sheet over 18,000y can it be argued that there should be a significant ice component within the measured surface elevation rise?
@Hank + @Sid
Realclimate is available at this back-up site http://realclimate-backup.org/
Apparently, 10 years ago, somebody registered the domain for them. The registration has now expired and they don't know how exactly to get it renewed.
Cheers
Martin
bozzza @7:
"If we knew the snowfall history perfectly then there wouldn’t be any controversy!" is the final sentence of the article's fifth paragraph.
Glaciologist Jan Wuite also put up an explainer about how this new article by Zwally et al fits in the wider context of Antarctic studies.Complements this one by Bamber nicely.
How the ice age commencing ~3 million years ago may have been caused (several angles follow:)
a) There are different hypothesis that have been tested in global cooling model simulation to check their potential importance in the glacial inception of the Northern Hemisphere. One of the major hypotheses is the closure of both the Indonesian (~3-5 Ma, Cane and Molnar, 2001) and Panama seaways (~3 Ma, Bartoli et al, 2005). The closure of the Panama isthmus, which began 13 Ma, was very slow. When the connection between the Pacific and the Atlantic Oceans closed, it intensified the thermohaline circulation in the Atlantic intensifying the heat transport from the equator toward high latitudes. Such hypotheses tested in GCMs circulation show that, even if a larger heat export could bring more precipitation and lead to the built of an ice sheet, the difference in ice sheet volume accumulated between an “open” or “closed” isthmus is small (Klocker et al., 2005; Lunt et al., 2008). On the contrary, the closure of the Indonesian seaway stopped the warm waters from the South Pacific from flowing into the Indian Ocean. This increased the amount of the North Pacific cold waters involved in circulation into the Indian Ocean and thus reduced the heat transport from the tropics toward the higher latitudes, finally triggering a global cooling (Cane and Molnar, 2001). http://www.climatescienceandpolicy.eu/2011/01/the-three-million-years-ago-dilemma-the-beginning-of-the-ice-ages/
……………………………………..
b) The collision of India and southern Asia began between 50 million and 40 million years ago, during the Eocene Epoch, and continues today. The collision produced two main geologic results. First, it began to block the westward-flowing Tethys seaway near the Equator, a process completed with the junction of Africa and Asia near present-day Iran roughly 16 million to 14 million years ago. Second, the creation of the Himalayas and the Plateau of Tibet, which resulted from the collision, altered global climates by changing patterns of weathering (and thus the transfer rate of carbon to the atmosphere) as well as wind circulation. India’s collision with southern Asia also altered patterns of oceanic productivity by increasing erosion and thus nutrient runoff to the Indian Ocean.
Principal Cenozoic faunal migration routes and barriers.
Encyclopædia Britannica, Inc.
The present-day Mediterranean Sea is a geologically recent descendant of a portion of the Tethys seaway. About six million years ago, during the Messinian Age, the western remnant of the Tethys seaway was subject to a brief paroxysm, known as the Messinian salinity crisis, that lasted approximately 270,000 years and saw the entire basin virtually isolated from the wrld ocean. The basin experienced severe desiccation and the precipitation of vast deposits of evaporites (such as salt and gypsum) up to several kilometres in thickness. The Atlantic Ocean subsequently refilled the basin from the west at the beginning of the Zanclean Age. Geologic evidence suggests that water rushing through a channel cut near Gibraltar filled some 90 percent of the Mediterranean Sea within two years. Some scientists contend that sea levels may have risen 10 metres (about 33 feet) per day within the basin during the period of peak flow. The Mediterranean basin has undergone significant geologic evolution during the most recent five million years. About one million years ago this part of the Tethys was transformed into the Mediterranean Sea by the elevation of the Gibraltar sill. Consequently, the Mediterranean basin became isolated from deep oceanic bottom waters, and the present-day pattern of circulation developed. …
The Bering land bridge which united Siberia and Alaska served as a second connection between Eurasia and North America. This link seems to have been breached by the Arctic and Pacific oceans between five and seven million years ago, allowing the transit of cold water currents and marine faunas between the Pacific and Atlantic oceans. The Atlantic and Pacific were also linked by the Central American seaway in the area of present-day Costa Rica and Panama. This seaway, extant since the first half of the Cretaceous Period, prevented the interchange of terrestrial fauna between North and South America; however, for a brief interlude during the Paleocene, a land connection may have existed between North and South America across the volcanic archipelago of the Greater Antillean arc, and some scholars have argued that land bridges between the two continents may have existed for short periods during the Late Cretaceous and again during the late Miocene. The seaway was closed by the elevation of the Central American isthmus between 5.5 million and 3 million years ago. This event had two significant geologic results. … Second, the emergence of the isthmus deflected the westward-flowing North Equatorial Current toward the north and enhanced the northward-flowing Gulf Stream. This newly invigorated current carried warm, salty waters into high northern latitudes, which contributed to increased rates of evaporation over the oceans and greater precipitation over the region of eastern Canada and Greenland. This pattern eventually led to the formation and development of the polar ice cap in the Northern Hemisphere between 4 million and 2.5 million years ago. https://www.britannica.com/science/Tertiary-Period
………………………………………………..
More angles: ("Ice age" is differentiated from "periodic glaciation".)
c) For several million years the Earth has experienced regular galciations followed by shorter warmer periods roughly every 100,000 years. What causes this seemingly regular climate oscillation ? The textbook answer is that they are initiated by changes in the Earth’s orbit and axis tilt called Milankowitch cycles and are then enhanced by a CO2 feedback effect. However the details are complex. For the last 1 million years Ice ages have occurred more or less every 100,000 years which corresponds to the change in eccentricity of the Earth’s orbit around the sun. Looking at the detailed effects on changes to incident solar radiation we find:
1. A 41,000 year variation in the tilt of the Earth’s axis to the sun. This effects the severity of winters and summers during the year.
2. A 23,000 year precession of the same axis of rotation which changes the season within the year. 13,000 years ago Winter in the Northern hemispheer was in June.
3. A 100,000 year oscillaton in the elipticity of the Earth’s orbit around the sun. Most important is the change in elipticity of the Earth’s orbit which changes the distance from the Sun during the year. So when winter in the northern hemisheper corresponds to a large distince from the sun we can expect more severe cold winters. http://clivebest.com/blog/?p=2732
…….
d)
antarctica: 40 million years ago to present
How Antarctica got its ice sheets–In the continual movement of Earth’s tectonic plates, Antarctica was severed from the southern tip of South America about 34 million years ago, creating the Drake Passage. Antarctica became completely surrounded by ocean. The powerful Antarctic Circumpolar Current began to sweep around the continent, isolating Antarctica from the warmth of the global oceans and provoking large-scale cooling. Illustration by Jack Cook. http://www.whoi.edu/services/communications/oceanusmag.050826/v42n2/haug-en1.html
…………
e) 3-22-04 How could the Gulf Stream–which transports not only moisture but also heat to the North Atlantic–lead to major Northern Hemisphere cooling and the formation of ice?
Neal Driscoll and Gerald Haug proposed one solution. They postulated that moisture carried northward by the Gulf Stream was transported by prevailing westerly winds to Eurasia. It fell as rain or snow, eventually depositing more fresh water into the Arctic Ocean–either directly, or via the great Siberian rivers that empty into the Arctic Ocean.
The added fresh water would have facilitated the formation of sea ice, which would reflect sunlight and heat back into space. It would also act as a barrier blocking heat stored in the ocean from escaping to the atmosphere above the Arctic. Both these phenomena would further cool the high latitudes. In addition, Arctic waters flowing back into the North Atlantic would have become less cold and salty–short-circuiting the efficiency of the Ocean Conveyor belt as a global heat pump to North Atlantic regions.
These preconditions–moisture plus an Arctic nucleus for cooling–would have made the climate system highly susceptible to ice sheet growth. Even modest changes in the global environment would have been sufficient to tip the scales and lead to the onset of major Northern Hemisphere glaciation.
Just such a change occurred between 3.1 and 2.5 million years ago, as Earth’s axis fluctuated so that the planet’s tilt toward the sun was less than today’s angle of 23.45 degrees. Less tilt to the Earth would have reduced the amount and intensity of solar radiation hitting the Northern Hemisphere, leading to colder summers and less melting of winter snows.
The onset of Northern Hemisphere glaciation also affected the Subarctic Pacific. It led to the formation about 2.7 million years ago of a freshwater lid at the surface of the ocean, called a halocline. This Arctic halocline would have created a barrier to upwelling, which blocked deep carbon-dioxide-rich deep waters from rising to the surface. The “leak” of heat-trapping carbon dioxide into the atmosphere was stemmed, further cooling the planet.
Many other ocean-atmosphere feedback mechanisms, resulting from the opening and closing of oceanic gateways, remain imperfectly understood. http://www.whoi.edu/services/communications/oceanusmag.050826/v42n2/haug.html
………..
f) Their case rests on temporal correlations between tectonic and climatic phenomena. Particularly impressive is the correlation at 50 Ma of the Indian–Asian collision and the consequent shutdown of what they call the “carbon factory” during the climate optimum, which is immediately followed by the temperature decline of the Middle and Late Eocene and the transition to a glacial state. Correlations do not necessarily imply causation, but they are strongly suggestive when linked in the manner that Kent and Muttoni (1) do. http://www.pnas.org/content/105/42/16061.full
………..
g)
III. The mechanisms behind sudden climate transitions.
It is still unclear how the climate on a regional or even global scale can change as rapidly as present evidence suggests. It appears that the climate system is more delicately balanced than had previously been thought, linked by a cascade of powerful mechanisms that can amplify a small initial change into a much larger shift in temperature and aridity (e.g., Rind and Overpeck, 1993). At present, the thinking of climatologists tends to emphasize several key components:
III.1. North Atlantic circulation as a trigger or an amplifier in rapid climate changes.
The circulation of the north Atlantic Ocean probably plays a major role in either triggering or amplifying rapid climate changes in the historical and recent geological record (Broecker 1995, Keigwin et al., 1994, Jones et al., 1996; Rahmstorf et al., 1996).
II.2 Carbon dioxide and methane concentration as a feedback in sudden changes.
Analysis of bubbles in ice cores shows that at the peak of glacial phases, CO2 was about 30% lower than during interglacial conditions (e.g., Jouzel et al., 1993). We do not at present know whether the lower glacial CO2 levels were a cause or merely an effect of the ice ages.
III.3 Surface reflectivity (albedo) of ice, snow and vegetation.
The intensely white surface of sea ice and snow reflects back much of the sun’s heat, hence keeping the surface cool. Presently, about a third of the heat received from the sun is reflected back into space, and changes in this proportion thus have the potential to strongly influence global climate (e.g., Crowley and North, 1991). In general the ice cover on the sea, and the snow cover on the land, have the potential to set off rapid climate changes because they can either appear or disappear rapidly given the right circumstances.
III.4 Water vapour as a feedback in sudden changes.
Water vapour is a more important greenhouse gas than carbon dioxide, and as its atmospheric concentration can vary rapidly, it could have been a major trigger or amplifier in many sudden climate changes.
III.5. Dust and particulates as a feedback in sudden changes.
Particles of mineral dust, plus the aerosols formed from fires and from chemicals evaporating out of vegetation and the oceans, may also be a major feedback in co-ordinating and amplifying sudden large climate fluctuations.
III.6. Seasonal sunlight intensity as a background to sudden changes.
A major background factor in pacing climate switches on timescales of tens of thousands of years seems to have been the set of ‘Milankovitch’ rhythms in seasonal sunlight distribution or insolation (Imbrie and Imbrie, 1992; Imbrie et al., 1992, 1993). Although the insolation values change gradually over thousands of years, they may take the earth’s climate to a ‘break point’ at which other factors will begin to amplify change into a sudden transition. http://www.esd.ornl.gov/projects/qen/transit.html
…………
h) Last but certainly not least in this list of factors causing the last ice age is that the continent of Antarctica moved to its locale near the South Polar Axis, via continental plate drift.
8-27-09 According to calculations by geologist Professor Christopher Scotese of the University of Texas, Antarctica could
move significantly away from its current location and become at least partially ice-free again within the next 50 million years. http://www.sciencefocus.com/qa/antarctica-moving-away-south-pole