Climate Science Glossary

Term Lookup

Enter a term in the search box to find its definition.

Settings

Use the controls in the far right panel to increase or decrease the number of terms automatically displayed (or to completely turn that feature off).

Term Lookup

Settings


All IPCC definitions taken from Climate Change 2007: The Physical Science Basis. Working Group I Contribution to the Fourth Assessment Report of the Intergovernmental Panel on Climate Change, Annex I, Glossary, pp. 941-954. Cambridge University Press.

Home Arguments Software Resources Comments The Consensus Project Translations About Support

Twitter Facebook YouTube Mastodon MeWe

RSS Posts RSS Comments Email Subscribe


Climate's changed before
It's the sun
It's not bad
There is no consensus
It's cooling
Models are unreliable
Temp record is unreliable
Animals and plants can adapt
It hasn't warmed since 1998
Antarctica is gaining ice
View All Arguments...


Username
Password
New? Register here
Forgot your password?

Latest Posts

Archives

2009 - 2nd hottest year on record while sun is coolest in a century

Posted on 16 January 2010 by John Cook

The skeptic argument "It's the sun" is both the most used skeptic argument and the most visited page on this website. So with NASA GISS updating the surface temperature record with completed 2009 data, I've updated the comparison between sun and temperature. While 2009 is the second hottest year on record (tied with 2007), solar activity has fallen to its lowest level in over a century.

To compare sun and climate, the temperature data was taken from the NASA GISS global land-ocean temperature index. To plot Total Solar Irradiance (TSI), I borrowed a technique from Kelly O'Day's Climate Charts & Graphs. Satellite measurements of TSI only began in 1978 while reconstructions of TSI from sunspot numbers go back to 1611 but end at 2004. As the two datasets show good correlation when they overlap, I've used Solanki's reconstruction from 1880 to 1978 and satellite data from 1979 to 2009.

Of course, I'm being a bit cheeky in comparing single data points - a technique often criticised here. Of more significance is the long term trend which is shown by plotting 11 year moving averages. As the solar cycle is roughly 11 years, using an 11 year average effectively filters out this cycle, giving us the long term solar trend. For the temperature record, an 11 year average also filters out short term variations from ocean cycles such as the El Nino Southern Oscillation. This enables us to directly compare the long term trends of Total Solar Irradiance and Global Temperature Change.
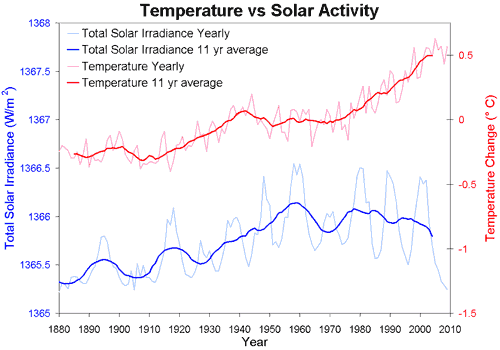
Global Temperature vs Solar Activity (Total Solar Irradiance)
Figure 1: Annual global temperature change (thin light red) with 11 year moving average of temperature (thick dark red). Temperature from 
NASA GISS. Annual Total Solar Irradiance (thin light blue) with 11 year moving average of TSI (thick dark blue). TSI from 1880 to 1978 from Solanki. TSI from 1979 to 2009 from PMOD.

There is some controversy about the degree that the sun affects climate. As TSI shows little variation, the direct influence from changing solar energy is modest. However, phenomena such as cosmic rays (which are modulated by solar activity) may enhance the sun's impact. However, an increased effect from cosmic rays would only serve to magnify the effect of the cooling sun over the last few decades. Since 1975, global temperature has shown long term warming while at the same time, the sun has shown long term cooling.

0 0

Printable Version  |  Link to this page

Comments

Comments 1 to 49:

  1. Something smells in Denmark, to coin a phrase. We all know the northern hemisphere has been the coldest in many years during early January. The stories abound everywhere (I in S. MN. on the Iowa border have yet to see the temperature above freezing this year and spent most of the first two weeks below zero F). Now as us skeptics (realist) are gloating. It just so happens the people behind the curtain, come out and say we just had the warmest January day in recorded history during the frigid plunge? ( Some Global Temperature recording site UAH) Well excuse me, I wasn’t born yesterday. I would like to add, I found this site http://data.giss.nasa.gov/gistemp/station_data/ I typed in my local rural city and asked for raw data graphed since 1886 (real temp data I assume). Anyhow here is the result http://data.giss.nasa.gov/cgi-bin/gistemp/gistemp_station.py?id=425744400040&data_set=0&num_neighbors=1 Amazingly their is not any Hockey Stick My city is near as cold in 2009 as it has ever been in recorded History! No wonder I do not buy into the GW frenzy. I am a Farmer and would wish it would warm up so I could consistently raise better crops, extend my growing season and have less fear of severe crop loss from sudden freezes in the spring and fall…and it I really do have Global Cooling here in Rural MN………..John PS Why don’t some of you guys put in some pertinent cities and see if You also have Global cooling or at least zero warming over the last last 120 years Like I have…….John………
    0 0
  2. I live in Saskatchewan (north of North Dakota), and we have entered our second week of above zero Celsius weather. We're running somewhere around 12-15C above normal. It is however not unheard of to get this type of weather pattern (locally known as the Pineapple Express). It is exactly why extrapolating local conditions globally is completely foolhardy.
    0 0
  3. Sir Osis of Liver, True but 120 years of actual data and no warming make you wonder. I got this from a friend in Farmington MN (a suburb of the Twin Cities. His 120 record actually shows a negative slope and Cooling..... mhtml:{9CAB5588-3D14-48A7-9773-AF7ABC0BBA08}mid://00000737/!x-usc:http://data.giss.nasa.gov/cgi-bin/gistemp/gistemp_station.py?id=425726580010&data_set=1&num_neighbors=1
    0 0
  4. John P, while i might agree with you on many respects, i can not think of the problem of global climate as based on anyone's backyard. Probably other farmers further south are not so willing to have warmer climate. I don't know what happens in your neiborhood, I do not live in USA. But I can tell you that where i live (mediterranean area) we suffered a marked increase in temperature, reduction in precipitations and more heat waves in summer. Farmers here are struggling hard to cope with this new climate and for sure they're not willing to get a warmer one. So, think globally, the earth is one and we all (together!) need to find our way out of this unsustainable trend.
    0 0
  5. John Cook: The Early XX Century Warming(+0,5ºC) peaked at about the same time than WWII(around 1940), then a slight cooling of about -0,1ºC followed until about 10 years when temperatures stayed nearly constant between 1955 and 1975. The Sun Activity instead continued to incrase until mid-1950s, when it began a slow decline. Remarcable is that temperatures peaked BEFORE Solar Activity (a whole solar 11-year cycle indeed!). This seem inconsistent with the hypothesis that the Sun is the main responsible of the Early 20th Century warming. This plus the REGIONAL nature of this warming event (the Arctic and North Temperate zone, while Tropics and Southern latitudes show a near-constant warming rate during the whole century) suggest to me that such warming WAS NOT NATURAL BUT ANTROPOGENIC, but not from Grenhouse Gases but from Aerosol forcing. Has anyone compared the Sulfate vs. Black Carbon emissions making timeseries-graphs like the one presented here? That will do a good to determine which forcing (Solar or Aerosols) had the greatest impact.
    0 0
  6. "We all know the northern hemisphere has been the coldest in many years during early January." No, it's cold this year -where you live-. It's been cold in a lot of places, warm in others. Overall, the past year has been warmer. Your local mileage may vary. Here where I live, temperatures's running above average this month. Last month, it was below average. Global warming stopping and starting? No, weather. "I got this from a friend in Farmington MN (a suburb of the Twin Cities. His 120 record actually shows a negative slope and Cooling." But I thought doubters believe that temperature records are unreliable? His may be bad, right? You need to make a more persuasive and consistent argument if swaying opinions is your goal.
    0 0
  7. John P: While it doesn't make sense to try to understand climate trends from a single station if you have available data for multiple stations for your region or state, there is non-the-less a discernable upward trend in that dataset (in spite of the substantial year to year variation). I used the R statistical package to analyse your data. It shows that there is an upward trend of .06ºC per decade and that that trend is statistically significant. If instead of the raw data, you use the Fairmont dataset with homegeneity adjustements then the trend is more apparent. I note that using all the available data, the Minnesota Climatology Working Group finds that across most of your state that everage temperature of 1997-2006 is 1 to 4ºF above the 1970-2000 average. They also find that over the last 25 years, water temperatures in Lake Superior have risen 4ºF While this may not seem like much to you, such changes are already great enough to have allowed pine beetles to proliferate and kill off vast areas of US and Canadian pine forests.
    0 0
  8. Also, John P, there are a lot of farmers here in Australia who are thoroughly sick & tired of watching their crops die in the ground due to more frequent heat waves & significant reductions in rainfall during the peak growing periods. I'd say that there are a hell of a lot more farmers who dread increasing warming than would welcome it. Still, I've got to love your persistence in flying the flag for the fossil fuel industry. They usually pay for this kind of propaganda, but you're giving it to them for free!
    0 0
  9. Oh, & you should see the AMSU-A data for the troposphere at a distance of 4km up. 2010, so far, has been 0.3 to 0.6 degrees warmer than the same point at 2009. These temps are also a clear +0.7 degrees higher than the 20-year average (1979-2000). You see, no matter how often some people try & pull the wool over our eyes, the data tells the real story-which is one of ongoing warming!
    0 0
  10. JohnP, please read this: If It's That Warm, How Come It's So Damned Cold?, at http://www.columbia.edu/‾jeh1/mailings/2010/20100115_Temperature2009.pdf I hope that it will answer many of your questions and concerns-- it is written by a leading authority on global temperature data. Regarding crops, I hope that you are aware that heat stress lowers yields (especially for C3 plants). You (or your children) might also regret wishing for much warmer weather if you are still around 20 years or more from now. Count yourself incredibly lucky thus far. Marcus, I agree. Unless something drastic changes, January 2010 will have record high (for the satellite record) global temp. anomalies. November 2009 was also a record high for that month.
    0 0
  11. The brocken link in Albatross' comment should be If It's That Warm, How Come It's So Damned Cold?
    0 0
  12. Thanks Pico!
    0 0
  13. "They usually pay for this kind of propaganda, but you're giving it to them for free!" Are you sure about that Marcus? Something sure does smell in Denmark about "John P." On thread after thread we now find this pattern of some "newcomer" who manages to post first and within a very short time of an article going up. Although he has this amazing efficiency he has apparently never heard or read any climate change material before, and trots out the same tired old stuff as if we are hearing it for the first time. And what old rubbish it is - he uses "real data" he has "global cooling" after two weeks cold snap, oh, and of course, as a farmer, "wish it would warm up so I could consistently raise better crops, extend my growing season and have less fear of severe crop loss from sudden freezes in the spring and fall". I doubt he will come back to this thread, or indeed another one under the same name. But he has got everyone here treating him politely and seriously and answering his questions as if they were a genuine search for truth. Ask yourselves, for a moment, is it really credible that anyone, let alone a "farmer" could really in 2010, be so ignorant about the debates and the data and still manage to find this site and be the first to post? No, it's not, but he has managed to get denialist rubbish in place as the first post and waste everyone's time. Mission accomplished, paid or willing volunteer.
    0 0
  14. I'm a lukewarmer myself and agree that things are getting warmer, but when years start and end are arbitrary human artifacts. I've plotted monthly temperature anomalies on a 12 month moving average and the HADCRUT and UAH show several higher peaks in the last 10 years. Of course, when you consider the confidence intervals of the various temperature indexes, then the general conclusion would be that we haven't had significant warming or cooling since around 2002. Here is my graph: http://www.anupchurchchrestomathy.com/2010/01/comparing-giss-hadcru-and-uah.html Click on the graph to see it full size. I'll try to add the RSS data when I get some time.
    0 0
  15. Couple of thing Joel. (1) Don't forget that the UAH data incorrectly includes diurnal variations, which result in a smaller trend. When you exclude these variations, the temperature trends are closer to those of RSS, HadCRU & GISS. (2) Though years are a human artifact, they're still based around natural phenomenon-namely the turn of the seasons. (3) What counts is how the anomaly changes over time. That change will probably be the same whether I look at a month-by-month or a year-by-year basis. If I take GISS data, averaged on a yearly basis, I get a result of x=0.0163, which isn't that much different from the result you've calculated. For RSS, I get a result of x=0.0156, which is only slightly higher than for UAH. My point is that, no matter how we choose to calculate the anomaly over time (per month, per year, per 5 years or per 11-years) we still end up with an undeniable warming trend. The question then becomes-what could be causing the warming trend? I'm still waiting for an answer to that question from the so-called "skeptics"-especially given the roughly downward trend in TSI over the last 30 years.
    0 0
  16. Oh, one other point Joel. Your claim re: 2002 is actually reflected in the 5-year average data for GISS, albeit with the warming trend ending closer to 2005. Here's the thing, though-solar irradiance/sunspot numbers have been dropping all decade, & have been at unprecedented lows for the last 4 years (much longer than most solar minima). Yet still temperatures have failed to drop. If the sun were to blame, then I would have expected to see a strong cooling trend from 2000-2002 onwards.
    0 0
  17. 3rd? Why are the two not the same 2009 14.57 & 2009 14.71 http://data.giss.nasa.gov/gistemp/tabledata/GLB.Ts.txt
    0 0
  18. Sorry meteorological stations only did not see it.
    0 0
  19. When people try that one, since they almost always live in the NH as indeed do I], I visit the Australian Bureau of Meteorology. I think it's caused a few to inhale their coffee / tea in surprise! I even caught-out an Australian, who was assailing me with a stream of BS! Note: For non Australians, the following links may be of interest. Australia temperature / rainfall; absolute / anomaly maps accessible here tinyurl.com/ylozhlg 1/3/6/12 month mean min / maxi / & etc. ; temperature / anomaly for Australia tinyurl.com/yao4ntb Hope this helps!
    0 0
  20. Pico, So your saying that real temperature data in MN that shows no warming in 120 years right through the Industrial Reveolution is not right. You have to Homoginize the real data to show warming, that is really there. Is that correct?.......John..
    0 0
  21. John P, there is a reason it's called global warming. Now, if it was was called Minnisota warming,or Twin Cities warming, you might have a point. Look at the temperature map in the previous article here if you need more clarification.
    0 0
  22. John P has placed his exact same comment on The Blackboard as comment 30360 of Lucia's GISS December Anomaly update. http://rankexploits.com/musings/2010/giss-december-anonaly-0-59c-down-from-0-68c/#comments John from Mn submitted the exact same comment to Watts Up With That http://wattsupwiththat.com/2010/01/15/uah-satellite-data-has-record-warmest-day-for-january/ post on UAH trends. John also placed the exact same comment on The Air Vent http://noconsensus.wordpress.com/2010/01/15/1934-1998-gissmatic/ Here's another: http://joannenova.com.au/2010/01/climategate-arrives-in-the-us/ John P doesn't care about the topic, he justs repeats himself. Has anyone found John P or John from Mn repeats? Let's see how many we can find.
    0 0
  23. "You have to Homoginize the real data to show warming, that is really there. Is that correct?.......John.." Yes, you do. Stations move. Stations get new thermometers. The time of day at which the daily number is recorded changes. They get stevenson screens. All of these impact the recorded data and must be taken account of. That's what the homogenization step does. BTW, it's not cold outside. It's been warmer than normal all month. Right here in the United States! Well, where I live - Portland, OR. It's somewhat more pronounced a bit north in Seattle, WA. Parts of Alaska have been having record or near-record highs. Eastern siberia has been warm, and the far north in Canada. Yes, the dramatic snow storms and frigid weather that have been pushed south have been dominating the news. Ponder the fact that this Arctic air has come from ... the Arctic. So if that Arctic air mass has left the Arctic, what do you think happened up there? Yep. Warmer than normal. Warmer than average in places like Greenland, for instance. That doesn't mean that frigid weather is dominating the northern hemisphere.
    0 0
  24. "John P has placed his exact same comment on [... various other sites ...]" That's frustrating. I come here because of the exceptionally high quality of the science reporting on the site, and the informed discussions particularly from commenters who are actively working in the field. When people spam the site with cut-and-paste comments, particularly ones from joke sites like WUWT, it degrades the quality of the discussion here. I would hope commenters would respect the hard work of our host, and treat the site as a place for sincere discussion, not for cut-and-paste propaganda comments.
    0 0
  25. Good post. I particularly like: "However, phenomena such as cosmic rays (which are modulated by solar activity) may enhance the sun's impact. However, an increased effect from cosmic rays would only serve to magnify the effect of the cooling sun over the last few decades. Since 1975, global temperature has shown long term warming while at the same time, the sun has shown long term cooling. " Indeed. This would indicate that some other factors are to a greater degree offsetting the cooling effect of solar variation. John P (#3), "His 120 record actually shows a negative slope and Cooling" I took a look at your graph. It did not contain a linear trend line. Just eyeballing it, I suspected that your assertion was wrong, so I plugged the annual numbers into a spreadsheet and added a linear trend line (a good exercise for you to do as well). The change has been about +0.5 C from that single station's period of record. Thus, your assertion is incorrect. As others have noted, it's also the raw data, and does not include the homogenization step. Among denialist circles, this automatically translates to "fabrication".
    0 0
  26. NewYorkJ at 08:22 AM on 17 January, 2010 "I took a look at your graph. It did not contain a linear trend line. Just eyeballing it, I suspected that your assertion was wrong, so I plugged the annual numbers into a spreadsheet and added a linear trend line (a good exercise for you to do as well). The change has been about +0.5 C from that single station's period of record. Thus, your assertion is incorrect." A step very few will take, sadly, but thank you. For those with a powerful sense of curiosity but a limited budget, the spreadsheet included in OpenOffice makes NewYorkJ's example extraordinarily easy to follow. Put the data in a column, select the column, use the "insert graph" option, turn on a trend line. Voila. Caveat: OO is a powerful tool but for the relatively ignorant (such as myself) don't go too far with conclusions when so armed, heh!
    0 0
  27. Kelly O'Day and Ned. Call me suspicious and cynical, but I'm guessing that "John P" is just an internet bot. Programmed to respond to key words and then instantly pasting in the same chunk of text. Often this technique is used to advertise porn sites, or via-gra sales, so using it for denialism seems about right. The reason? To ensure (I'm guessing) that every climate change thread anywhere in the world contains denialism material in order to make it seem that there is active debate - "see, the science isn't settled". On the other hand denialist sites, I understand, rarely allow any dissenting posts, conveying the image of overwhelming consensus that "the science isn't settled". If it was me I would delete this stuff, but the cleverness of it is that it looks just like genuine questions, and deletion would have denialists screaming censorship (as distinct from the culling that they engage in). I reckon perhaps the best tactic is simply to ignore anything that smells to high stratosphere. There is no debate on the core of climate change science, however much there might be on precise details. The situation is exactly like evolution where creationists seize on minor debates ("stochastic evolution" "sympatric speciation") to pretend the science is under question. Snow in Minnesota in Winter doesn't quite rise to the level of sympatric speciation as a debating point.
    0 0
  28. re NewYorkJ and top article: Exactly so - we could make a rough quantitative analysis of the cooling contributions that are currently opposing enhanced greenhouse-induced warming: (i) solar cycle max-min give a lagged ~0.1 oC [*]. With an abnormally-prolonged minimum and a small decrease in solar output it seems reasonable that this is currently suppressing current temperatures below the 30 year trend by ~ 0.1 oC. (ii) analysis of ocean regime fluctuations suggests that the current regime (manifest in the negative phase of the PDO) which we've been in since around 1998 may be additionally suppressing surface temperatures by around 0.1 oC [**]. So a peculiar coincidence of well-, or reasonably well-characterised cooling forcings (solar cycle min; prolonged minimum; reduced solar output; negative PDO regime) is likely suppressing current temperatures by perhaps 0.2 oC below the 30-year trend. During the next 5-6 years we expect to "recover" 0.1-0.15 oC of that through the solar cycle "up-swing". The surface temperature has warmed with a max around 2005, and has been pretty much steady since then. Of course we can't say much about trends from a few years of data, but it seems that the CO2-induced warming is "holding its own" against a coincidence of (temporary) cooling forcings. In that light it's difficult (as you and John Cook suggest) to accommodate some of the uncharacterized proposals for contributions to surface temperature. If the cosmic ray flux (CRF) notion had merit, for example, this should be making its strongest cooling contribution since the CRF count has been right near its maximum value for the last few years [***]. Likewise if (as some suggest), the PDO index has made a major contribution to 20th century warming, the current negative PDO phase should be making a stronger cooling contribution than 0.1 oC…. .. however accommodating these contributions would require that the earth is significantly more sensitive to CO2 than we think (or hope)….or something else is countering these cooling contributions (….but what?) [*] J. L. Lean and D. H. Rind (2008) “How natural and anthropogenic influences alter global and regional surface temperatures: 1889 to 2006″, Geophys. Res. Lett.35, L18701. http://pubs.giss.nasa.gov/abstracts/2008/Lean_Rind.html [**] K. L. Swanson, G. Sugihara and A. A. Tsonis Long-term natural variability and 20th century climate change PNAS 106, 16120-16123 http://www.pnas.org/content/106/38/16120.abstract [***] http://cr0.izmiran.rssi.ru/clmx/main.htm
    0 0
  29. You know, this is why I love this site-because, as a scientist, most of the contributors here are able to direct us to Papers or other sources of information to back up the claims being made. At least here the likes of John P & nofreewind are simply an aberration in what is otherwise a hard-science web-site!
    0 0
  30. Hope you don't mind me clarifying this, Chris (#28), but I've always been a little uncertain about the relationship between solar activity & CRF. As I understand it, increasing CRF leads to increased cloud formation which-in turn-leads to increased albedo & hence reduced temperatures-is that right? I also understand that decreasing solar output is strongly correlated to increasing CRF, because the suns output in some way deflects CRF's-again, am I correct in this? So what we're basically looking at here is a negative feedback loop-where reduced solar output directly reduces global temperatures whilst at the same time indirectly resulting in more cloud cover-which should also result in lower overall temperatures. If so, then I'd tend to think that CO2 must have an incredibly strong forcing to overcome such a *double whammy* (which is the scientific term for it ;) ).
    0 0
  31. As Algore said, "It's complicated". UAH has a very different ranking of hottest years, which I tend to trust more than GISS since it is satellite data and not subject to as much manipulation. UAH shows a declining trend more in line with the sun. In any event, sun activity matches temperature better than CO2 concentration. Now, if you can model sun, humidity, high and low clouds, ice and snow, ocean currents, CO2, wobble, solar flares and cosmic rays all operating in a chaotic relationship with unknown interactions and lags, you might be making some progress. I don't think we're there yet. I'll stick with observations and not trust models for now.
    0 0
    Response: That the UAH satellite data is pristine, untouched data seems to be a common misconception. On the contrary, satellite data is subject to a great deal of manipulation. Orbit decay causes the altitude of the satellite to drop so that needs to be filtered out. The temperature of the actual satellite also changes and this affects the readings. Data from different satellites need to be spliced together. Cooling in the stratosphere needs to be filtered from the warming in the troposphere. And probably the most complicated adjustment is accounting for diurnal drift - the time of the day that the satellite passes over the equator slowly drifts over time (exacerbated by orbital decay). In fact, diurnal drift is the greatest source of discrepancy between the UAH data and RSS data.

    And I must say, I find it extraordinary to hear you say "sun activity matches temperature better than CO2 concentration" when we've just established that the sun has been cooling over the last 35 years while global temperatures have been rising.
  32. "...we've just established that the sun has been cooling over the last 35 years while global temperatures have been rising." Well, the radiometer measurements must have been manipulated. Or the sun must have been manipulated. Whatever. Will The Team stop at nothing in their quest to establish a global Marxist wealth redistribution machine?
    0 0
  33. Trog writes: "[...] I tend to trust [UAH] more than GISS since it is satellite data and not subject to as much manipulation. UAH shows a declining trend more in line with the sun." There are at least four satellite-derived temperature analyses (from RSS, UAH, and two from UW). Their current temperature trends are as follows (in K/decade): RSS: +0.15 UAH: +0.13 UW-RSS: +0.15 UW-UAH: +0.11 All four of these show positive trends during a time when the sun has been cooling. (They're also not all that far from the GISS trend, which is +0.16 K/decade over the same period) In other words, the relatively small effect of the solar cycle on global climate is only partially reducing the impact of CO2 driven warming. And of course once the sun starts to warm again, it will be exacerbating the problem (slightly) rather than helping mask it as it does now (slightly).
    0 0
  34. Skeptics have long pointed out that atmospheric CO2 rise is a near perfect linear rise over the century while global temperatures have seen periods of rise, leveling and decline (as seen on your graph). If you also posted CO2 levels on the graph in figure 1 you could just as easily argue that the CO2 and global temperature graphs look unrelated in the period of 1940-1970 when temperatures where declining or steady.
    0 0
    Response: The issue of mid-century cooling is addressed here. The basic point is there is not a single driver of climate - you need to take into account all forcings: sun, volcanoes, CO2, sulfate aerosols, etc. The same point applies to this page - sun is the not the only driver of climate and that becomes apparent when global temperatures rise during a period of cooling sun. Obviously some other forcing other than solar variations is driving the warming.
  35. " Of more significance is the long term trend " Why didn't you just put single trend line for the whole time period for both temp and TSI (I've seen it done for temp before). That would show TSI going up since 1880 and temp going up since 1880. What could we draw from that?
    0 0
  36. The short and obvious answer to both comments is that John is not trying to fool people.
    0 0
  37. #35 "TSI going up since 1880" - have you actually looked at the graphs?
    0 0
  38. #34 response EXACTLY!! It does appear though that in your article you are dismissing solar variance because the relationship breaks down after 1975. There is nothing in this article any stronger or weaker than the "issue of mid-century cooling" by the skeptics. For that reason you should dismiss it. Riccardo Nobody suggested John was trying to fool us. But there is no reason to believe, like the rest of us mortals, that he's infallable. David Horton I have looked at the graph it starts lower and ends higher. If you put a single linear trend line through it I'm fairly sure that the slope would be positive. If you look at some of the links John has provided or google it you'll see that there is an upward trend since records began in the 1600's
    0 0
    Response: Mid-century cooling is a good example of the logic used in this article. In recent decades, the sun has been cooling. Therefore, the logical conclusion is that the sun is not contributing any warming over this period.

    The same logic applies to mid-century cooling. At that time, CO2 levels were rising. Therefore, the logical conclusion is that CO2 was not contributing any cooling over this period.

    CO2 did not cause mid-century cooling. Other forcings must have been responsible.

    The sun is not causing current global warming. Other forcings must be responsible.
  39. HumanityRules, nobody, as well, is suggesting that John is infallable. But, as he himself just explained, there's a logical fallacy in your request; showing what yout asked to show is usually done just to fool people.
    0 0
  40. Riccardo the fallacy is to take a single effector of climate and plot it against global mean temperature and then say "hey presto" the relationship breaks down here. That seems true whether you're a sceptic or a believer. And to completely contradict my point heres something thats been bugging me a while. Looks at this graph of ENSO index http://oceanworld.tamu.edu/resources/oceanography-book/Images/elninoindex.gif There are many other variations of this on the web if you want to search for them. Look around 1978 there seems to be a general shift. Before mainly blue (negative) after mainly red (positive). This is also the time when the most recent period of temperature increase also kicked in. If El nino and La nina can have dramatic affects on global temperature measurements, and if we see a resumption of increased temperature change around this period, can this not be an explanation of late 20th century temperature increase. John accepts that the radiative forcing of CO2 took a back seat in the mid-century cooling to another factor then why not that it's taking a back seat (along with TSI) to ENSO in heating in late 20th century.
    0 0
    Response: Let me be clear about the point being made in the comparison between sun and global temperatures. I am not saying the sun doesn't change climate. I'm just making the simple point that during the last few decades of global warming, the sun has been going in the opposite direction. So any contribution the sun has made to global warming is actually a cooling effect.

    But like I say all the time, and I think the point you're trying to make - we need to look at the broader picture and take into account all the forcings that drive climate.

    BTW, we examine the impact of El Nino on long term climate trends here...
  41. HumanityRules, if i want to describe the ascent to Mt. Everest i do not start from the airoport where i live; i will start from the base camp at 5000 m. So, a _general_ description of the climate is one thing, pointing to the effect of CO2 is another. For the latter, i'd start when it is more clearly visible, not when the signal is low and confused by other effects. No one is trying to "take a single effect"; on the contrary, because there are many and i want to describe as clearly as possible just one, i'd just use part of the data. If i want to show the effect of ENSO, i'll use a period around 1998 where the ENSO signal is more evident. Wouldn't you? And as for ENSO, once and again, while it is a good part of climate variability it does nothing to the long term trend. It makes no sense keep saying that it has a huge effect on climate ... You know, in 2008 we had the effect of La Nina and the temperature was relatively low, last year we had El Nino and the temperature increased. Put the numbers, an anomaly (GISS) of 0.43 °C in 2008, 0.57 in 2009; an increase of 0.14 °C. The big one, 1998 was 0.56 °C, 1999 was 0.32, a decrease of 0.23 °C. Can you see what the numbers tell us?
    0 0
  42. #40 reply So I read " impact of El Nino on long term climate trends here..." and this jumped out at me "The Southern Oscillation Index shows no long term trend (hence the term Oscillation)",. Which seemed to conradict what I said earlier. So i got to thinking if you got an oscillation and you only examine a short section of it then what you've got is a trend (eg the up slope only or the downslope only). So I dug out the ERSL MEI data and the GISS temp anomoly data (thank god for jet lag). http://data.giss.nasa.gov/gistemp/tabledata/GLB.Ts+dSST.txt http://www.esrl.noaa.gov/psd/people/klaus.wolter/MEI/table.html And I plotted annual average data for 1950-2009 (full extent of MEI data). And I added a linear trend line. Both have a positive trend (MEI slope +0.0136 and temp anomoly +0.0109). Seems Riccardo understands each La Nina and El Nino as an isolated event. Can you not understand this as an on going process with additive effect?
    0 0
  43. HumanityRules, ENSO, by definition, cannot create energy, it's just a redistribution of energy through the climate system. If we were able to calculate the energy fluxes they _must_ average to zero unless there's something else providing the energy. The MEI index is more complicated in what it includes other parameters, six overall including surface air temperature. Your comparison is then misleading. The MEI index is useful to account for short term global temperature variability but not for long term trends.
    0 0
  44. HumanityRules, i forgot to mention one more step you should take even if you do not understand the meaning of the MEI index. Try to fit the temperature trend with the MEI index alone (scaled by some factor) instead of just say they are both increasing. You won't be successful. Try instead a straight line plus the MEI index and you'll account for both the trend and a great part of the short term variability, at least in the period after 1970.
    0 0
  45. To extend Riccardo's answer: You really need to understand what the ENSO Index is, HumanityRules, before attempting to use it to assess its contribution/response to surface temperatures under the influence of external forcing. There are two main problems with your analysis: (i) Yes, linear regression of the MEI Index gives a slope of 0.0136 yr-1. However the Index is just an Index. If one wants to consider its contribution (if any) to the surface temperature trend, one would (at least) have to normalize the index with respect to temperature. One way one to do this might be to observe that the very strong El Nino of 1997/1998 lifted the 1998 surface temperature around 0.2 oC above the long term temperature trend. Thus we could scale the Index (crudely) by estimating that an Index value of 1.5 is equivalent to 0.2 oC of surface temperature. This would give a very crudely "temperature-normalized" trend of 0.018 oC per decade (compared with a surface temperature trend 0.11 oC). (ii) However that analysis still overestimates the contribution of ENSO to any trend since one of the parameters of the multivariate analysis that yields MEI is sea surface temperature. This is increasing in a warming world as a result of enhanced radiative forcing. In fact it is considered that as the earth warms we will expect to shift ENSO towards more frequent El Nino states, tending perhaps to permanent El Nino states. Since the MEI Index has a sea surface temperature componewnt, the ENSO Index must rise in time unless there are compensating components of the Index that decrease in a warming world. So it is the latter effect that is likely the cause of any apparent trend in ENSO as determined by linear regression of the MEI Index. As Riccardo says, ENSO can't generate heat, it largely redistributes this within the ocean. (iii) Obviously the best means of attributing contributions to surface temperature is to assess the individual contributions and combine these to reconstruct the record of temporal temperature variation in response to internal/external forcings and any oscillatory contributions, rather as is done here (see Figure in post #8): http://www.skepticalscience.com/What-does-Solar-Cycle-Length-tell-us-about-the-sun-role-in-global-warming.html One would find that while ENSO makes essentially no contribution to the trends, it accounts for a substantial part of the variability around the trend (as Riccardo also said!).
    0 0
  46. Riccardo, I get that ENSO doesn't produce energy only redistributes it but this manifests itself as an increase in global temp which is the measurement we are comparing these things to. Although the potential to alter water vapour in the atmosphere would You're also asking me to fit ENSO to temp increase, something I agree you can't do well but then as I keep saying the graph of CO2 increase doesn't fit well to temp either. Why would you start the analysis at 1970 when you have data back to 1950?
    0 0
  47. Well yes HumanityRules, by why pretend that one should fit the earth's temperature evolution to a single contribution (whether ENSO or solar or CO2)? Why would we throw out everything that we know in pursuit of a spurious "argument" that we know is wrong? Obviously to reproduce the 20th century temperature we should include all of the contributions and their amplitudes and temporal variation. Anthropogenic greenhouse forcing predominates, but anthropogenic aerosols, black carbon, volcanoes, solar etc. all contribute to the temporal variation in surface temperature. See for example Figure 1 here: http://pubs.giss.nasa.gov/docs/2005/2005_Hansen_etal_1.pdf In relation to your post #38, to point out that solar irradiance change has made no significant contribution to warming since the 1950's, and likely a small cooling contribution since the mid 1980's, is not to dismiss solar irradiance changes as a contribution to surface temperature change - it just hasn't made a contribution since the 1950's. That's all very straightfoward isn't it? To address attribution to surface temperature variation we address all of the contributions according to their individual effects during the period of interest...
    0 0
  48. Humanity Rules, yes, we are looking a temperature and ENSO do have an effect. But given that no energy is produced it can just cause fluctuations, not trends. I already explained why i took just part of the time range available. From around the '70s the contribution of GHG to warming has been strong enough to be clearly identified and the sun forcing has been roughly constant. If you want to reproduce the whole instrumental record from 1880, you need to put together all the contributions to forcing.
    0 0
  49. John I've been working on showing current TSI data. I have added a widget to my blog to show NASA's SORCE TSI data. University of Colorado - Bolder posts the data about 1 week after readings. Here's a link to my most recent TSI image, using SORCE daily readings
    0 0
    Response: Thanks Kelly, that's a great resource. It's interesting to see the upturn of TSI in recent months as the next solar cycle begins - the PMOD TSI data stops halfway through 2009 so its good to have more recent data.

You need to be logged in to post a comment. Login via the left margin or if you're new, register here.


The Consensus Project Website

THE ESCALATOR

(free to republish)


© Copyright 2024 John Cook
Home | Translations | About Us | Privacy | Contact Us