


 Arguments


2014 Arctic sea ice extent - 6th lowest in millennia
Posted on 23 October 2014 by dana1981
The National Snow and Ice Data Center has reported that this year we saw the 6th-lowest minimum Arctic sea ice extent on record. Research has shown that most of the long-term decline in sea ice, or the “death spiral” as it’s come to be known, is due to human-caused global warming.
Natural factors play a role in the extent of the Arctic sea ice as well, especially changes in weather conditions on a year-to-year basis. For example, 2012 shattered the previous record low Arctic sea ice extent because on top of the human influences, the weather conditions were ripe for a dramatic decline that year. In 2013 and 2014, weather conditions were closer to normal, so they didn’t break the 2012 record. As a result, the usual suspects have declared that Arctic sea ice is now “expanded” compared to 2 years ago.
The flaw in that argument is illustrated in this animated graphic I created.
September Arctic sea ice extent data since 1980 from the National Snow and Ice Data Center (blue diamonds). "Recovery" years, meaning years when the sea ice extent is greater than the previous year, are highlighted in red to mock the repeated cynical claims of climate change "skeptics" that global warming has somehow stopped.
We can also consider Arctic sea ice extent further back in time, over the past 145 years:
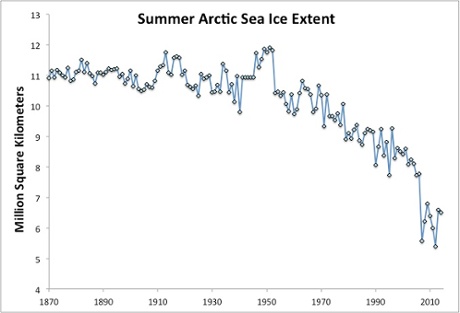 Average July through September Arctic sea ice extent 1870–2008 from the University of Illinois (Walsh & Chapman 2001 updated to 2008) and observational data from NSIDC for 2009–2014.
Or even the past 1,450 years:
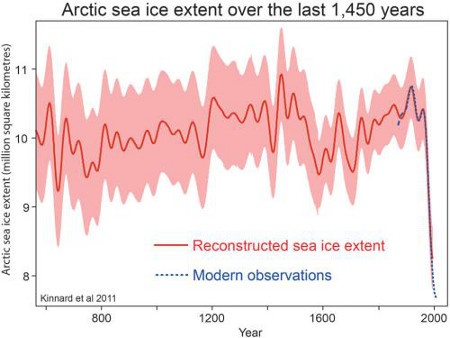 Reconstructed Arctic sea ice extent over the past 1,450 years, from Kinnard et al. (2011)
The current Arctic sea ice death spiral is clearly outside the norm and natural variability we’ve seen in recent history.
Exactly how rapidly it will continue to decline is a subject of open debate among climate scientists. A few, like Peter Wadhams and Wieslaw Maslowski had predicted that the Arctic could be nearly ice-free in the summer as early as this year. A few others fall on the opposite extreme, believing like Judith Curry that the death spiral has “reversed.”
The vast majority of climate scientists fall in the middle, with the evidence indicating that the long-term decline will continue as human carbon pollution continues to warm the planet, and the Arctic will eventually become ice free within the next few decades.
There was recently a contentious dispute at a Royal Society Arctic Sea Ice meeting, in which Wadhams felt that his views were being disrespected by some of those mainstream climate scientists. Those scientists argued that Wadhams was misinterpreting their comments, but this dispute illustrates where the climate debate really lies.
Normally the ‘debate’ is depicted as being between climate ‘sceptics’ on one side and mainstream climate scientists on the other. Many bystanders assume that the truth must lie somewhere in the middle. However, in reality it’s the mainstream scientists who fall into the middle of the spectrum, with climate contrarians on one extreme, and those who believe climate scientists are underestimating the impacts of global warming on the other extreme.
Moreover, climate contrarians have made the most consistently inaccurate annual Arctic sea ice predictions to date. Once again this year, contrarian blog readers submitted the most optimistic Arctic sea ice prediction to the competition hosted by the Study of Environmental Arctic Change (SEARCH), and once again their predictions were among the least accurate.


It's quite sad how this same old 'Arctic sea ice is recovering' mishmash can get repeated every few years...
Sort of like claiming your college football team staged a comeback in a blowout game:
Qtr 1 2 3 4 Total
Wisconsin 28 21 17 0 66
Illinois 0 3 0 10 13
"But we outplayed them in the 4th quarter!!!!"
Wonder how a shift of that magnitude and rate affects fauna, flora and climatic system?
Rate of change must influence things as well.
Does the rate of change the way choatic systems change, cna we expect a more turbulent ride the faster things progress?
Does the rate, change the way choatic systems change, i.e. can we expect a more turbulent ride the faster things progress?
ranyl - Well, weather is highly non-linear, rather chaotic, but that's probably not the real reason.
Tamino had a post a while back on sea ice that indicated a significant change in 2007, namely that the annual cycle got bigger:
[Source]
This may be due to the ongoing thinning of the Arctic ice leading to more susceptibility to weather - thinner ice is just more likely to be pushed around by winds and currents.
An importat factor to remember wrt sea ic is that it isn't just the melting that matters. It is the refreeze each fall/winter. Decline can arise just as easily if refreeze declines as well as melting increasing.
And in this respect the basic thermodynamics of sea ice formation matters. Freezing starts once the air is cold enough. Then as the ice is forming the refreeze occurs on the bottom of the ice, where it is in contact with the water. But the driver for this is the air temperature above the ice.
And ice is actually a reasonable insulator.
So as the ice thickens, the air above needs to get progressively colder to allow the temperature of the ice at the bottom to be at the freezing point to cause more freeze. So as the ice thickens, the harder it becomes for it to thicken further.
So if we compare a patch of ice that is 1 meter thick when the refreeze starts with a patch that is say 2 meters thick, for the same weather conditions the thinner ice will thicken more over the wintter than the originally thicker ice
So the shift Tamino reported is most likely due to the fact that much of the old, thickest multi-year ice has been lost. So far more of the ice at the end of the melting season is thinner ice. And thus can actually put on greater thickness during the winter.
So the variation over the season increases.
To save interested readers the trouble of clicking through a couple of posts looking for a link, the Kinnard et al. (2011) reference is to the Nature paper 'Reconstructed changes in Arctic sea ice over the past 1,450 years'.
Journal link at http://www.nature.com/nature/journal/v479/n7374/full/nature10581.html
Author's copies can be found online with a search.
[PS] Fixed link. Thanks for that.
Can I get a copy of that first animated image as an animated GIF?
There's a few sites I'd like to post it to.
When you dealing with such sensitive commodities as water on earth and in the atmosphere you need a benchmark. Total water, whether as solid, liquid or gas, is a constant. How nature deals with this we can theorise. We are not the master, because if we are, where is the operating manual, with is FAQ and trouble shooting chapter. (I get the wrath of the Moderator for this.)
Following the atmospheric hydrogen bomb experiments in the 1960-70s the Soviet Academy of Scientists released a document in 1984(?) warning of a new ice age if the heavy release of carbon dioxide into the atmosphere as experienced in those tests was to be continued.
That correlates with Goode's finding in 1949 that adding water vapour to the atmosphere tends to warm it (sauna principle), but adding carbon dioxide tends to cool the atmosphere. (Elementary Meteorology HMSO 1975).
Back to ice. In 1958 as part of an exercise the USS Nautilus navigated to the North Pole
https://www.youtube.com/watch?v=lQ08GY8RJdU
The pictures reveal a quite this layer of ice. Ice in water melts. But following the nuclear experiments, it ice cover go thicker by an unnatural way that has not been explained. Over the years since then we have experience a gradual decrease in ice cover. My experience, practical that is, is that we are seing a long resettling of what should have been there years ago. Thus research on ice in water, being loss/gain in areas where you have 6 moths daylight and 6 months night is not enhancing our knowledge of Nature.
For the Moderator: You can scratch me off if you like. I am an un-educated individual, but I have learned a lot. please contact my on 2ingvar@gmail.com an I will add some more to your woes. It is embarrassing to learn the truth. Cheers
[PS] Comments are moderated only for conformance with the comments policy, which is designed to encourage informed and polite debate. If you are not interested in such a discussion, then go elsewhere.
You are making claims above which are "surprising" to put it mildly. Please accurately source your material so others can ascertain your claim.
Reference to Goode 1949 as follows:
Page 11 A Course in Elementary Meteorology HMSO ISBN 0 11 04000090 3. Text: In 1946 Dobson, Brewer and Cwilong pointed out the importance of ozone as an absorber and emitter of radiation, but Goody, in 1949, suggested that water vapour and carbon dioxide are more important, the first constituent tending to cause a heating of the atmosphere and the second a cooling. It cannot be said that a full explanation has yet been obtained.
I am polite. I only point out that since 1949 we have not learned anymore about this secret gas called water vapour. Why is it kept out of all climate and climate change research papers when the gas is the prime motor of warming?
Ingvar @9 and @10, the abstract of Goody (1949) states:
This, firstly, confirms (as I had begun to suspect) that you were mistaking results about the stratosphere (where increased CO2 cools the atmosphere) with those for the troposphere, and in particular the near surface atmospheric temperature, where increased CO2 warms the atmosphere. As Goody is discussing stratospheric temperatures, his is in no way a contradictory result to those which show that increased greenhouse gases will warm near surface temperatures. Indeed, the cooling stratosphere along with a warming troposphere is one of the signatures of a greenhouse related warming of the troposphere, and the observed cooling of the stratosphere along with the observed warming of the troposphere is a major result confirming the theory of the greenhouse effect.
Second, from the abstract (I have not purchased the paper) it appears that Goody attributes variation in stratospheric CO2 and H2O concentrations by latitude as the primary driver variations by latitude of stratospheric temperatures. That is a very different thing from determining that H2O and CO2 are more important than O3 in the overall temperature budget. You will note that Goody confirms Dobson's theory that seasonal variation in O3 is the major source of seasonal variations in temperature. If we follow the logic that the major source of a variation in temperature is the major source of the temperature mean, then we would equally be required to affirm O3 as the main source of the mean stratospheric temperature, thus seperately affirming that O3 is a more important contributor to that temperature than CO2 and H2O, and the reverse (ie, contradicting ourselves). It is better to stay rational (ie, not believe contradictions) and reject the mistaken inference which you apply to Goody's results.
Ingvar
" I only point out that since 1949 we have not learned anymore about this secret gas called water vapour. Why is it kept out of all climate and climate change research papers when the gas is the prime motor of warming?"
Simple answer Ingvar, it isn't.
The role of water vapour in the atmosphere in its contribution to the Greenhouse Effect, cloud formation, its contribution to setting the observed value for the atmospheric Lapse Rate (its cooling effect), its role in the stratosphere, the rules governing it's concentration in the atmosphere and why it can't accumulate or decline on it's own without some other factor driving it are all well considered in very great detail.
For example the research in the early 1960's investigating whether Specific or Relative Humidity was more likely to remain constant as the atmosphere warms.
Do we know everything about everything? No. But we know a very, very great deal
Water has been included as a major part of climate science ever since the renaissance in inquiries into the subject in the 1950's.
So a question for you, and I am intrigued to understand your answer. Where did you get the idea that water isn't considered?
Ingvar wrote: "I only point out that since 1949 we have not learned anymore about this secret gas called water vapour. Why is it kept out of all climate and climate change research papers when the gas is the prime motor of warming?"
As Tom and Glenn have shown, you misunderstood the research you cite from 1949 and your belief that water vapor is "kept out" of climate research is completely incorrect. One point they didn't cover is that it is also misleading to call it the "prime motor" of warming.
The water vapor content of the atmosphere cannot change significantly on its own... and thus it is not the 'motor' of anything. If some magical force were to double the water vapor content of the atmosphere tomorrow, while keeping everything else the same, we'd have a few days of heavy dew and rainfall and then everything would be back to normal. The amount of water vapor the atmosphere can hold is directly correlated to temperature. The warmer the atmosphere in a given location the more water vapor the air can hold (though if little / no water is available you can still have a warm area with low water vapor... deserts for instance). Thus, the warmer the average temperature of the planet's atmosphere the greater the amount of water vapor it can hold. Yes, that additional water vapor then causes additional warming, but without some other warming or cooling factor you don't get a change in atmospheric water vapor levles. It is not a 'motor' which drives climate change at all. Rather, it is a feedback when something else is forcing a change. The actual 'prime motor' / forcing of warming is carbon dioxide. Unlike water vapor it doesn't rapidly 'drop out' of the atmosphere based on temperature (or anything else). The warming from CO2 is roughly doubled by the resulting increase in water vapor, but the water vapor level can't change without the warming. CO2 level changes can be triggered by either temperatue shifts (e.g. Milankovitch cycle warming causing ice melt and release of previously frozen organic carbon) or release of carbon previously trapped underground. In the past this has happened when massive volcanic events have released large amounts of CO2. Currently it is happening because of human burning of fossil fuels.
Ingvar, see the post Water Vapor Is the Most Powerful Greenhouse Gas, and make any further comments on that topic there, not here.
I'm always astounded that people actually make such absurd claims as the effects of water vapor are "kept out" of the research. It's a blatantly made-up and completely false claim stated with absolute certainty. Yet, 30 seconds on google would show the statement to be incorrect.
It truly boggles the mind.
Speaking of 30 seconds on Google (or Yahoo! in my case)
The "ever accurate" Wikipedia page on greenhouse gases has for years stated that water vapor is about 55% of the greenhouse effect, and CO2 about 17%, both with a fair uncertainty band.
Given 45 seconds I found a 2006 paper:
Earth’s Annual Global Mean Energy Budget, by J. T. Kiehl and Kevin E. Trenberth, National Center for Atmospheric Research, Boulder, Colorado.
which gave a 60% Water Vapor and 26% CO2 contribution on a sunny day.
IF as Ingvar claims, water vapor has been excluded from the research, hidden if you will, it seems the "conspiracy minded climate scientists" have done a mighty poor job of keeping it out of the hands of lay scientists such as myself. I rather think this is one of many red herring arguments I see from those who seek to diminish the science.
... just another case of going up the down escallator. Interesting that the excallator link is nearly beside the chart of this article.
knaugle @15, you may want to add to the list of papers that purportedly ignore water vapour, Schmidt et al (2010) (Open access), which quantifies the water vapour plus cloud contribution to the "total greenhouse effect" as 75%, and that of CO2 at 20%. I should add for knaugle's benefit that the "total greenhouse effect" is the difference between upward IR radation at the surface and upward IR radiation at the top of the atmosphere. It includes many factors which are feedbacks in that their concentration in the atmosphere is primarilly controlled by temperature, and which as a result would not be able to maintain their effect without more stable atmospheric components such as CO2.
Returning to Ingvar @8:
1) With regards to hydrogen bombs and CO2, Ingvar is probably referring to Alexandrov, V. V. and G. I. Stenchikov (1983): "On the modeling of the climatic consequences of the nuclear war" which I cannot find on the internet, or "Numerical simulation of the climactic consequences of nulear war" by the same authors (1984). The abstract of the later indicates, unsurprisingly, that it models the impact of dust and soot injected into the stratosphere by nuclear explosions. That is unsurprising, of course, because that was the primary climate related concern of nuclear weapons which do not generate CO2 except incidentally by causing fires. The incidental fires do not generate anywhere near the amount of CO2 as that emitted from a single years fossil fuel use. They certainly did not suggest that increased CO2 cools the troposphere.
2) The Nautilus navigated past the North Pole but never surfaced. It was able to do this because the sea is 4 kilometers deep at the North Pole. The trans-arctic voyage of the Nautilus is therefore irrelevant to climate change.
Slightly better informed pseudo-skeptics draw attention to the USS Skate, the first submarine to surface at the North Pole on August 11th, 1958 and again on March 17, 1959. The following are images of the Skate at the North Pole in 1958 and then in 1959:
You will notice the ice still on the hull in the first image, showing the Skate surfaced through very thin ice, not open water.
In both cases the Skate surfaced through areas of thin ice caused by wind opening up gaps in the ice (called polynas or leads), which then refreeze. The refrozen surface is thinner than the multiyear ice typically found in the area. Consequently thin ice in a polyna (all that is shown by the submarine surfacing) is no evidence of thiner ice in the 1950s than exists today.
[PS] Submarine traverses under the arctic did obtain ice thickness data which show ice thickness has sharply declined since 1958. See http://rkwok.jpl.nasa.gov/publications/Kwok.2009.GRL.pdf which uses data from these very submarines.
If I remember correctly, in Stephen Schneider's book, Science as a Contact Sport, he details out the rift between himself and Carl Sagan on the issue of nuclear winter. Of course, as Tom Curtis states, it had nothing to do with CO2 and everything to do with soot and dust. But the rift between them was that Schneider's research pointed to the idea that it wouldn't exactly be nuclear winter, but rather more of a nuclear fall.
Tom, that first image is the Skate, but not at the pole. (See www.navsource.org/archives/08/08578.htm). Best guess I think is Drift station Alpha in August 1958.
scaddenp @20, it appears that you are correct. The history of the Skate compiled by J D Jensen prior to the Skate photos were used to generate fake controversy about ice thickness definitely identifies the 1959 surfacing as the first at the North Pole. That appears to be confirmed by the fact that in their summary of the accomplishments of Calvert (the Skate's commander), the US Navy mentions surfacing at the North Pole in 1959, but not an earlier (more significant had it existed) surfacing.
Further, in January, 1959, the US Navies "All Hands" magazine described the previous years polar operations as follows:
An earlier report (October, 1958) read:
For her 1959 voyage, however, it is reported (July, 1959) that:
Having conceded the point, however, I will note that surfacing just 40 miles from the pole rather than precisely at the pole makes no scientific difference, ie, if ingvaar's point were valid if the Skate surfaced precisely at the pole, it would be equally valid given that it surfaced a mere 40 miles from it.
Moderator's comment @18, thankyou. I had found the earlier paper by Rothrock et al, 1999 who, based on submarine data from the late 50s to early 70s concluded that the ice draft at the end of the melt season had decreased by 1.3 meters over that period. That, of course, is direct evidence rebuting ingvaar's claim.
Thank you all. You have plugged a few holes for me and I am grateful for your comment. I had a brief look at http://www.skepticalscience.com/4-Hiroshima-bombs-worth-of-heat-per-second.html and although this is not in this forum, but interesting.
Rain is measured and can be quantified because official raingauges are models of a template metre-square box in which a millimetre yields one litre. Thus over 1,000 sq metres you have one tonne of water that was water vapour. There is a lot of heat released into space with each mm.
[DB] You comment is off-topic in this thread. As Tom Dayton notes, see the post Water Vapor Is the Most Powerful Greenhouse Gas, and make any further comments on that topic there, not here. Subsequent off-topic comments in this thread will be deleted.
Ingvar @23, the total heat generated by condensation of water vapour is matched by the total heat absorbed by the same water vapour evaporating in the first place. As the absolute humidity is rising with rising temperatures, that the atmospheric water vapour has been a net absorber of heat over the last few decades, slowing down the pace of global warming rather than accelerating it - at least as regards its heat capacity. (Obviously the increase in water vapour increases the water vapour greenhouse effect, an important feedback that means anthropogenic global warming will raise temperatures more overall than would otherwise have been the case.