Climate Science Glossary

Term Lookup

Enter a term in the search box to find its definition.

Settings

Use the controls in the far right panel to increase or decrease the number of terms automatically displayed (or to completely turn that feature off).

Term Lookup

Settings


All IPCC definitions taken from Climate Change 2007: The Physical Science Basis. Working Group I Contribution to the Fourth Assessment Report of the Intergovernmental Panel on Climate Change, Annex I, Glossary, pp. 941-954. Cambridge University Press.

Home Arguments Software Resources Comments The Consensus Project Translations About Support

Twitter Facebook YouTube Mastodon MeWe

RSS Posts RSS Comments Email Subscribe


Climate's changed before
It's the sun
It's not bad
There is no consensus
It's cooling
Models are unreliable
Temp record is unreliable
Animals and plants can adapt
It hasn't warmed since 1998
Antarctica is gaining ice
View All Arguments...


Username
Password
New? Register here
Forgot your password?

Latest Posts

Archives

An overview of glacier trends

Posted on 14 November 2009 by John Cook

Glaciers are considered a proxy for climate. So what are we to make of the skeptic claim that glaciers around the world are growing. In 2008, Alaskan glaciers grew. Glaciers are growing in Washington State. There's a glacier in the Himalayas that's growing, which apparently is "confounding global warming alarmists". Does this selection of glaciers provide enough information to make accurate conclusions about global glacier trends? Let's dive in a little deeper and see what the data tells us.

Glaciers respond directly and quickly to atmospheric conditions. As temperatures warm, summer melting increases. However, accumulation of ice in the winter also increases due to more snowfall. Air temperature tends to play the dominant role - there's a strong statistical correlation between air temperature and glacier fluctuations over large distances (Greene 2005). Generally, when air temperatures warm, glaciers recede. 

Consequently, because they're so sensitive to changes in temperature, glaciers provide clues about the effects of global warming. Glacier mass balance is measured through a variety of techniques. Direct glaciological methods include ablation stakes, snow pits and snow probing. This data is then combined with independent geodetic surveys, collected and published by the World Glacier Monitoring Service (WGMS).

Over the period 1946 to 2005, the WGMS have monitored 228 glaciers. In the early years, just several glaciers were monitored. Over time, observations from more glaciers across the globe were added to the database, giving us a broader picture of global glacier mass balance. The highest quality glacier observations are ongoing, continuous and long term. There are 30 glaciers in 9 different mountain ranges that have been continuously measured since 1976 (11 of them reaching back to 1960 and earlier). These are considered 'reference glaciers'. Figure 1 shows the total number of glaciers monitored since 1946. The black and dark grey bar indicate the number of reference glaciers.
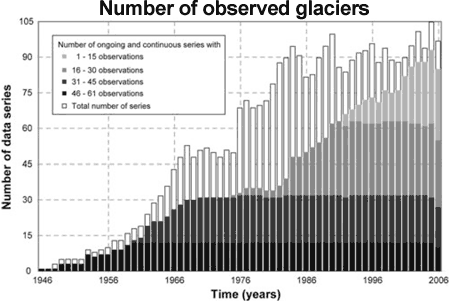

Figure 1: Observed glaciers from 1946 to 2006 (Zemp 2009).

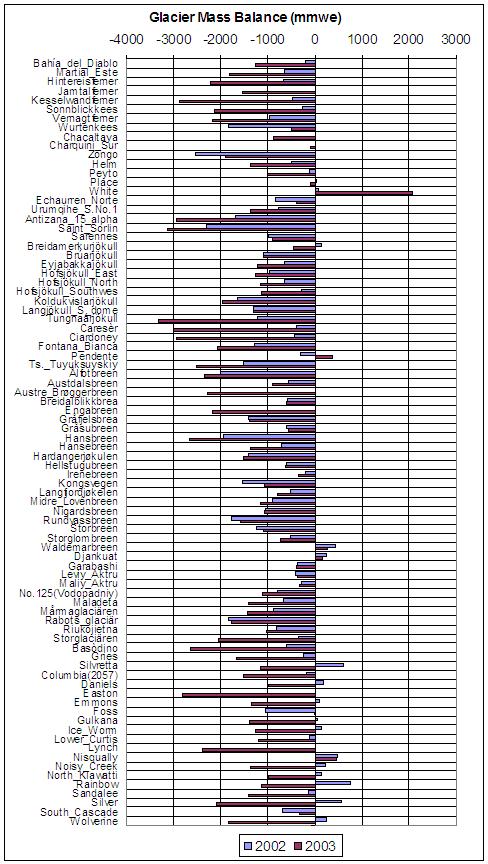
What do these glacier observations reveal? The following table shows the mass balance of individual glaciers over 2002 and 2003. Negative values indicate shrinkage. We see that there are isolated glaciers that are growing. However, focusing solely on these few glaciers to indicate global glacier growth paints a very misleading picture. The vast majority of glaciers are receding. And importantly, the shrinking trend is increasing (eg - 77% in 2002, 94% in 2003).
https://skepticalscience.com/images/glacier_mass_balance_2002_2003.jpg
Figure 2: Glacier Mass Balance over 2002 (blue) and 2003 (red). (WGMS)

What about the long term trend in global glacier mass change? There are several method to calculating global glacier mass change. One way is to use the average value of the 30 reference glaciers. Another is to calculate the moving average of all available glaciers. The results for both methods are displayed in Figure 3. The orange line is the average mass change of the 30 reference glaciers. The blue line includes all glaciers.
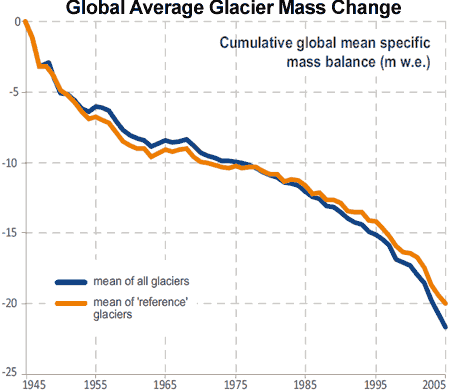

Figure 3: Cumulative mass balance curves for the mean of all glaciers and 30 'reference' glaciers (WGMS 2008).

Both approaches show consistent results (with all glaciers showing a slightly faster drop in mass compared to the 30 reference glaciers). There is strong mass loss in the first decade from 1945. Note that at this time, there were only several glaciers monitored - not quite a global sample. The mass loss slows down in the second decade so that around 1970, global mass balance was close to zero. Glaciers were in near equilbrium which indicates glacier shrinkage in the late 20th Century is essentially a response to post-1970 global warming (Greene 2005).

After 1975, glacier shrinkage continues to accelerate until present. The mass loss from 1996 to 2005 is more than double the mass loss rate in the previous decade of 1986 to 1995 and over four times the mass loss rate over 1976 to 1985. When you narrowly focus on a few cherry picked glaciers, you can be misled into an incorrect view of global glacier trends. When you take in the broader picture, you see that globally, glaciers are shrinking at an accelerating rate.

0 0

Printable Version  |  Link to this page

Comments

Comments 1 to 35:

  1. Is there data available for 2006 - 2008?
    0 0
    Response: Not quite but I dug a little deeper on the WGMS website and found data through to 2007:

  2. I think Fred Singer and others have been doing this cherry-picking for years. I wonder if it would be a worthwhile project to go back and find the glaciers they were identifying, say, 6 or more years ago and see how those glaciers have fared since.
    0 0
  3. pdt, the World Glacier Monitoring Service seems to do periodic updates and are currently collating data for the next update incorporating the period 2007-2008: http://www.geo.unizh.ch/wgms/datasub.html We spent some time in Switzerland this summer, and visited some glaciers. We found this site covering Swiss Alpine data through 2008 pretty interesting: http://glaciology.ethz.ch/messnetz/ While worldwide updated mountain glacier data might not be available through 2008, the increasing rates of polar ice sheet mass loss supports the expectation that mountain glacier retreat is continuing through the last couple of years (as it is in the Swiss Alps): Velicogna, I. (2009), Increasing rates of ice mass loss from the Greenland and Antarctic ice sheets revealed by GRACE Geophys. Res. Lett. in press http://www.agu.org/pubs/crossref/2009/2009GL040222.shtml abstract: “We find that during this time period [April 2002 and February 2009] the mass loss of ice sheets is not constant, but accelerating with time, i.e. that the GRACE observations are better represented by a quadratic trend rather than a linear one, implying that the ice sheets contribution to sea level becomes larger with time. In Greenland, the mass loss increased from 137 Gt (gigatonnes)/yr in 2002-2003 to 286 Gt/yr in 2007-2009, i.e. an acceleration of -30 +/- 11 Gt/yr^2 in 2002-2009. In Antarctica the mass loss increased from 104 Gt/yr in 2002-2006 to 246 Gt/yr in 2006-2009, i.e. an acceleration of -26 +/- 14 Gt/yr^2 in 2002-2009."
    0 0
  4. The first thing I noticed from this post was the small number of glaciers that have a long term record. I was sure we had longer term data on more glaciers. But I guess mass balance is more difficult to estimate than some other metrics regarding recession. So I wonder if data from these photo projects (eg: http://www.nrmsc.usgs.gov/repeatphoto ) can be compiled into something useful for quantitative analysis. I visited the Burgess Shale (Canadian Rockies) about a decade ago and saw two glaciers across a valley and could make a comparison to photos taken from the same spot approximately 80 years earlier. Surely there are many such instances around the world.
    0 0
  5. Great work as always John, clear and succinct. Are there no NZ glaciers included? I don't see Franz Joseph there which is the one Australian denialists always like to mention. And Steve at #2 - yes, that would be interesting, but you may find that the ones they cherry picked are still gaining. My understanding is that glaciers (the vast majority) are shrinking because of rising temperatures at their site. On the other hand in some situations, particularly (solely?) those near coasts, rising water temperatures may result in increased snow fall which will counteract the melting. Franz Joseph is a case in point. The same thing applies, on a much larger scale, to Antarctica.
    0 0
  6. Here's an interesting graphic from the IPCC: http://www.grida.no/publications/other/ipcc_tar/?src=/climate/ipcc_tar/wg1/fig2-18.htm
    0 0
    Response: That is an interesting graphic. Note that the New Zealand glacier Franz Joseph is included at the bottom:

  7. John, A few more good images include: http://www.wgms.ch/mbb/mbb10/Abb1.pdf (This is just a bar chart of the same image you showed in comment #1) http://www2.sunysuffolk.edu/mandias/global_warming... Source: http://www.grid.unep.ch/glaciers/graphics.php
    0 0
  8. From WGMS: In 2005 there were 442 glaciers examined, 26 advancing, 18 stationary and 398 retreating. 90% of worldwide glaciers are retreating. In 2005, for the first time ever, no observed Swiss glaciers advanced. Of the 26 advancing glaciers, 15 were in New Zealand. Overall there has been a substantial volume loss of 11% of New Zealand glaciers from 1975-2005, but the number of advancing glacier is still significant. Tamino also has a very good image that shows the absurdity of the cliams that galciers are advancing: http://tamino.files.wordpress.com/2009/08/glaciers.jpg?w=500&h=295
    0 0
  9. I hate to keep repeating myself but how does this all fit into historical data. If glaciers have generally been receding since before the industrial age then how should we interpret the recent data. Some early pioneers in the field, papers taken from the WGMS literature section. http://iahs.info/redbooks/a039/039053.pdf looked at 12 glaciers in the Canadian Rookies and found all had been receding from before 19th century. What about this delicious paper on American glaciers http://iahs.info/redbooks/a039/039056.pdf which includes the following quote "It's [the paper's] primary purpose is to aquaint the listener (reader) with the factual data that has been obtained for the several glaciers mentioned rather than to make interpretation thereof". Imagine a publication that just presents the facts and doesn't attempt outlandish claims, wow. Anyway they find Nisqually glacier retreating from when records began (1857) and 4 other again receding from when records began (1920s-1930s). Only one (Coleman Glacier) was advancing and the report is accompanied by this comment "This, as far as known, is the only glacier where factual data are actually available to show that a terminal advance is in progress". Interesting that advancing glacier where rare back in the 1950's. A further paper put the maxima point for the Nisqually glacier at around 1750 http://www.wgms.ch/downloads/Harrison_RB039_1954.pdf. I see the table above suggests this glacier is now advancing. How about this gentle paper fron the 1940's on Columbian glaciers http://iahs.info/redbooks/a030/03040.pdf. More deglaciation. Steve L you may get your comparative photos from the likes of this guy. Or this report in the 1940's of "dying glaciers" http://iahs.info/redbooks/a030/03037.pdf Or this from 1940s that show mainly receding Alaskan glaciers http://iahs.info/redbooks/a030/03038.pdf. Or these receding Peruvian glaciers in the 1940's http://iahs.info/redbooks/a030/03039.pdf How about this paper which suggest Norwegian glaciers have been retreating for 200 years http://iahs.info/redbooks/a030/03042.pdf Or this paper that puts the start of the retreat in European glaciers in the 1700's http://iahs.info/redbooks/a030/03043.pdf Maybe I could go on and on. Anybody interested could keep looking at pdfs from that website, just keep changing the number at the end of the address. These are all old, many include measurements and photographs but all seem to tell the same story. General retreat of glaciers and in many cases this begins in the 1700's.
    0 0
    Response: Just letting you know, in my new phase of curmudgeon webmaster, even terms like "outlandish claims" gets you close to deletion. Do we really need to resort to such hyperbole in a constructive discussion?

    How should we interpret recent data? Considering the correlation between air temperature and glacier extent (Greene 2005), it's hardly outlandish to link the last few decades of warming temperatures with shrinking glaciers.

    Could current glacier trends be just the result of coming out of an ice age? Around 1960 to 1970, glaciers were in near equilbrium which indicates glacier shrinkage in the late 20th Century is essentially a response to post-1970 global warming (Greene 2005).

    Lastly, thanks for the links to glaciers receding as far back as the 1700s. What does this prove? That climate has changed in the past, with only a minimal or no influence from CO2. Does this mean humans can't affect climate? Quite the contrary. Natural climate change in the past proves that climate is sensitive to radiative forcing. If the planet is in energy imbalance, global temperatures will change.

    CO2 is imposing an energy imbalance on climate now. The CO2 radiative forcing is well understood and observationally measured. So citing past climate change is actually citing evidence for our climate's sensitivity to CO2.
  10. Sorry webmaster the outlandish claims wasn't directed at you more the publishers of papers. I've noticed a tendancy in this field at this present time for authors to add comment to their data usually giving it more media appeal. But I guess they have the to speculate on their data. I have no problem with what's written on this website. I guess the point is to stress there was a process of deglaciation going back to before industrialization which maybe continuing today. The 1960s-1970's information you present is informative. I take your presentation is similar to the original authors. He see equilibrium in 1960-1970s followed by retreat which must be global warming, I guess the real point being AGW. Whereas looking at a longer series of data might only see a pause in a much longer process of deglaciation. The data doesn't change but the distinction in terms of the impact on our thinking is important. "CO2 is imposing an energy imbalance on climate now. The CO2 radiative forcing is well understood and observationally measured. So citing past climate change is actually citing evidence for our climate's sensitivity to CO2." ....or other factors that affect deglaciation/temp/climate.
    0 0
    Response: I appreciate your response. It's not like you hurt my feelings or anything (I cop a lot worse, believe me). I would just prefer, in the interest of conducting respectful, constructive discussion, that we refrain from such characterizations, whether talking about me, climate scientists or skeptics.

    In regard to the notion that current glacier shrinkage is part of the continued deglaciation since the Little Ice Age (or further, from the Last Glacial Maximum), I gleaned several points when researching on glaciers:
    1. Zemp 2009 looks at how glacier mass balance is a direct and undelayed response to atmospheric conditions. It reacts to climate change relatively quickly.
    2. Keeping that in mind, Greene 2005 notes that as glaciers were in near equilbrium from 1960 to 1970, glacier shrinkage in the late 20th Century is essentially a response to post-1970 global warming
    3. The trend in glacier mass balance is not a gradual return to equilibrium as part of a long term deglaciation. Glacier shrinkage been accelerating over the past few decades.

    "past climate change is actually citing evidence for our climate's sensitivity to CO2... or other factors that affect deglaciation/temp/climate"


    You're correct. Any radiative forcing will affect global temperatures and hence glacier mass balance. Every climate scientist will tell you CO2 is not the only driver of climate. But the reason for the focus on CO2 is because CO2 is the most dominant radiative forcing and it's also increasing faster than any other forcing.
  11. I'm going to keep at this. i looked for papers that had cited Greene's work. Only 2 came up, an important measure of the importance other scientists put on his work. Here's one of them Changes of Glaciers and Climate in Northwestern North America during the Late Twentieth Century Anthony Arendt John Walsh William Harrison Journal of Climate Volume 22, Issue 15 (August 2009) His general conclusions are a general increasing rate of mass loss from glaciers since the 1970's. But as you (really I) say the 1960-1970s represent a pause in the deglaciation process so any measurement afterwards is really likely to see an increasing rate of retreat. He makes this point "a warm period occurred between about 1920 and 1940 that would have put the glaciers in a state of negative balance prior to the 1950". Some data in those old papers I linked to suggested this as well. Why not do a comparison of rates in 1920-40 with 1970-2010. Identifying a rapid increase from a time when things are in stasis doesn't necessarily tell us much. And seems destined only to confirm an already held theory. Some further quote from this paper. "Additional complications arise when considering the fact that glaciers, because they have a delayed response to climate, may be changing due to climatic events that occurred prior to the measurement period" I guess the pause in the 1970s can't wholly be explained by the brief cold snap in the 1970s if this is the case. Just as a extra I'm puzzled by this quote which is discussing temperature records for Alaska based on weather station data. "Most of the change in temperature was attributed to a large temperature increase that occurred in 1976. Examination of the periods before and after this climate shift show that average annual temperatures decreased by 0.72°C during 1949–75 and increased by 0.3°C during 1977–2005." Given that the overall temperature change for 1949-2005 is ~2.5oC that means there was a sudden shift of >2oC in 1976 in average annual temp. that has remained ever since. It just seems fairly bizarre to me if irrelevant.
    0 0
  12. In fact it looks as though deglaciation rates (certainly in northern hemisphere) change with PDO cycle more than increased CO2 caused warming. http://climate.gi.alaska.edu/ClimTrends/Change/TempChange.html http://jisao.washington.edu/pdo/
    0 0
  13. HumanityRules, my impression is that you are mixing an aspect of local (although large scale) climate variability with a global trend. As stated explicitly by John Cook, glaciers respond do temperature, whatever the cause of the temperature increase might be. So the global retreat of glaciers is just a sign of global warming as opposed to _anthropogenic_ global warming.
    0 0
  14. #13 Accepted but the 'global' data set admits there is a "strong bias" towards the northern hemisphere. From the summary page of http://www.grid.unep.ch/glaciers/ from where this article takes some of it's data. "The moraines formed towards the end of the Little Ice Age, between the 17th and the second half of the 19th century, are prominent features of the landscape, and mark Holocene glacier maximum extents in many mountain ranges around the globe. From these positions, glaciers worldwide have been shrinking significantly, with strong glacier retreats in the 1940s, stable or growing conditions around the 1920s and 1970s, and again increasing rates of ice loss since the mid 1980s. However, on a time scale of decades, glaciers in various mountain ranges have shown intermittent re-advances. When looking at individual fluctuation series, one finds a high rate of variability and sometimes widely contrasting behaviour of neighbouring ice bodies." It may well be coincidence that the shift in the PDO occured in the 1920s and 1970s around the same time the glacier retreat slowed/stopped/reversed. But also maybe significant. I see the obvious truth in warmer world = melting ice but that may not be the whole story. And finally while it is not always stated directly that this is about AGW the implication is there otherwise we are wasting our time here and this is only an issue for glaciologists(?) to argue over.
    0 0
    Response: Through trial and error on this website, I find it more productive to take baby steps rather than try and bite off more than I can chew. Eg - rather than try to answer the entire AGW question in one go (although I did have a crack at that once), I address specific points that skeptics bring up. Eg - "glaciers are growing". The answer to that is relatively simple - some are growing, most are shrinking, the overall trend is accelerated shrinking. We then take the next step, combining glacier's relatively quick response to climate and glacier equilibrium in the 1960s, to deduce that post-1970s warming is causing the recent acceleration in glacier shrinkage. As to the next step of what is causing the warming, the gorilla in the room if you will, that is addressed elsewhere.

    However, you also mention that the database of glaciers is heavily biased towards the Northern Hemisphere which is quite true. In fact, I've been waiting for someone to bring that up. Zemp 2009 goes into much detail about the geographical distribution of the glacier data and ways to account for this.

    The figure below is from Zemp 2009 and demonstrates various ways to estimate global glacier mass change. The solid black line is the average mass change of the 30 reference glaciers. The dashed line is the average mass change of all glaciers and the dashed-dotted line is all glaciers excluding the reference glaciers. There is also the consideration that the observed glaciers are located in the Northern Hemisphere and tend to be clustered in Europe. So another method to determine the global mean is to calculate average mass changes over macro-regions (thick grey line) or area-weighted averages of the macro-regions (thin grey line).


    My first draft of this glacier overview included this graph and that mouthful of an explanation above of the 5 different time series. I agonised over it for a while but decided in the end to go for the easier to understand (and yes, more colourful) Figure 3 above (from WGMS 2008). But I spent a lot of time in Zemp 2009 so you've given me the opportunity to dredge up all that work for which I'm thankful. :-)
  15. re #9; The dominant effect on mountain glacier recession/advance, polar ice sheet recession/advance and sea level rise and fall is temperature. This relationship is obvious to the extent that it’s possible to assign rather crude correlates of glacier advance/recession and historical temperature (i.e. using global glacier records as a crude thermometer for global temperature change) [*], and between global temperature change and sea level rise [**]. In relation to the ice/sea level response to temperature, it’s not so much the rate of change that’s important as the degree of temperature rise above the temperature where ice sheet/sea levels have roughly come to equilibrium [**]. It’s temperature change that dominates ice and sea level change. So considering glacier recession since the depths of the Little Ice Age around AD 1600-1700), we aren’t surprised that this is associated with a temperature rise to the pre LIA temperature by the mid-late 18th century, followed by a further warming that accelerated in the 20th century [e.g. see Moberg et al (2005) which is the Northern hemisphere temperature reconstruction that is often used as a (possibly extreme) measure of temperature change during the last 2000 years; this can be freely downloaded: http://coast.gkss.de/staff/storch/pdf/moberg.nature.0502.pdf So the question is what are the dominant influences on temperature rise since the LIA (say to the middle of the 20th century where temperatures might be around 0.6 oC warmer than the bottom of the LIA according to Moberg’s reconstruction, and remembering that this is a NH reconstruction)? A number of analyses of the solar records, indicate that the temperature contribution to the LIA was around 0.1 oC of cooling relative to the mi-20th century (e.g. [***]). Likewise analysis of the record of volcanic activity indicates that this was likely causal for some of the low temperatures during the LIA (say another 0.1 oC). So some of the temperature change from the bottom of the LIA to mid-20th century, that obviously influenced land ice recession and sea level rise was a recovery from negative (solar and volcanic) forcing. The anthropogenic component was rather significant too, since it produced a rise in atmospheric CO2 from 280 ppm at the end of the 18th century to 300 ppm by 1900, and 310 ppm by 1940. It’s easy to calculate using the mid-range of climate sensitivities of 3 oC of warming per doubling of atmospheric CO2, that the equilibrium temperature response from this raised [CO2] is 0.3 and 0.44 oC of warming, respectively. Since the pre-20th century anthropogenic CO2 increase was slow, the earth temperature response likely came close to equilibrium with the forcing, and we might have expected to have realised 0.3 - 0.35 oC of warming associated with the anthropogenic forcing by the mid-20th century. In other words, considering the temperature rise due to fairly established forcings, a considerable amount of the pre 20th century glacier recession, polar ice sheet recession and sea level rise since the LIA is likely anthropogenic. It’s often not realized that there was a very significant anthropogenic component to global warming pre-20th century… [*] J. Oerlemans (2005) Extracting a Climate Signal from 169 Glacier Records Science 308, 675 – 677 http://www.sciencemag.org/cgi/content/abstract/308/5722/675 [**] S. Rahmstorf (2007) A Semi-Empirical Approach to Projecting Future Sea-Level Rise Science, 315, 368 – 370 http://www.sciencemag.org/cgi/content/abstract/1135456 [***] Y.M. Wang et al. (2005) Modeling the sun's magnetic field and irradiance since 1713. Astrophys. J. 625, 522-528. http://sun.stanford.edu/LWS_Dynamo_2009/61797.web.pdf (not the most accessible paper in the world!)
    0 0
  16. John it occurs to me, looking at the interesting graphic at #6 that you could do an interesting look at why certain glaciers are bucking the trend. Franz-Josef is the obvious one, but in the graphic there seem to be several others. An eyeball suggests that these were all dropping but around 1980 turned around. My guess would be that these actually provide further evidence of the effect of global warming on glaciers. Looks as if they lose ice as temperatures slowly rise, but then about 1980 this effect is overtaken by the effects of warming seas giving more precipitation of snow, and then the warmer it gets the bigger they get.
    0 0
    Response: David, that's an excellent idea. It would require tracking down studies examining each of the growing glaciers. I'm not sure I have the time to do it myself as I have a specific list of topics I need to get through at the moment. But if you're interested in tracking down the papers, I'd be happy to host a guest blog post from you :-)
  17. #14 response So your presentation is "The answer to that is relatively simple - some are growing, most are shrinking, the overall trend is accelerated shrinking." An alternative way to present the recent history of glaciers would be " Evidence of general glacier retreat since the 1700's. detailed data for the last century identifying period when this retreat has been quicker (1940s and 1980 onwards) and other times when the retreat has slowed or even reversed (1920s and 1970s)" Both would be generally correct for the data available but the first would emphasise the past few decades as something standout (accelarated shrink) with the inherent implication that AGW is involved while the second version paints a picture of general, variable natural retreat of several centuries. Further on the accelarated shrinking. Just from eyeballing the Zemp graphes you present the slope of the graph between 1945-1955 and 1995-2005 look to be very similar so rather than accelerating shrinkage one could argue that glacier retreat has returned to its previous rate before the pause associated with the 1970s. This is not just semantics but important in shaping how we respond to the data. I'm interested in the Zemp macro-region data unfortunately I can't get free access to that paper. I think it would be interesting to see if glaciers in different macro-regions show generally similarly or different patterns of retreat/pause/advance of the last century. Presenting the mean of the regions obscures that. The reason I say that is because the WGMS (http://www.grid.unep.ch/glaciers/) does attempt to breakdown the data into regions. The NZ data (6.3) presents front variation on 12 glaciers for 2000-2005 which shows no nett retreat in these 12 glaciers. While some of the graphs you present in your article suggest this is a time of global retreat. Just on #16 It is not just advancing glaciers that can or need to be explained by local conditions. Take for example Kilimanjaro the following paper suggests glacier retreat here is down to changes in humidity/precipitation not air temperature http://www3.interscience.wiley.com/journal/107630666/abstract?CRETRY=1&SRETRY=0
    0 0
  18. Mmmmm. See what I can do John!
    0 0
  19. HR, it seems to me like you're trying to say that recent/current mass loss in alpine glaciers is a continuation of a prior process. That's an analog of this argument: http://skepticalscience.com/coming-out-of-ice-age.htm but I think this argument is even worse when applied to alpine glaciers.
    0 0
  20. Steve "HR, it seems to me like you're trying to say that recent/current mass loss in alpine glaciers is a continuation of a prior process." I'm certainly saying that is a possibility. Lets split the past century up into sections based on global mean temperature change and glacier retreat. 1920s stable glaciers 1940s strong retreat 1970s stable glaciers 1980s onwards strong retreat 1915-1935 rising temperatures 1935-1975 steady temperatures 1975-1995 rising temperatures how can you directly relate these two processes? In the 1940s glaciers were retreating right in the middle of a period of stable global mean temperatures while glaciers were stable in the 1920s during a period of global rising tamperatures. Before anybody says there is a delay in the glacier reaction to global mean temperatures the state of glacier retreat nicely coincides with changes in mean global temperature from 1970s onwards. Something I guess John and Chris have been pushing. I just think that once one goes back in time past the 1970s simple relationships begin to breakdown.
    0 0
  21. #20 HR you're throwing out everything that we know about the phenomenon (glacier responses to forcings), and then trashing a simplistic caricature (your "simple relationhips"), which no one considers to be valid (i.e. that there should be a one-one contemporaneous correspondence between temperature variation and glacier response measurement). So in considering the relationship between glacier advance/retreat and global temperature, at least three relevant factors should be considered: (i) glacier response times to temperature change, (ii) the levels of volcanic aerosols to which glaciers are particularly sensitive and (iii) local geometric and climatic conditions that influence local glacier responses. Just considering glacier response times (since you tried to "head off" discussion of this rather obvious point!): Glacier recession will occur well after temperatures have levelled off from a warming phase, and recession can continue for a long time afterwards. This is because the glacier response is to the temperature difference from the previous "equilibrium", rather than to the temperature as it changes (see my post #15). Oerlemans recently estimated glacier length response times (which is somewhat similar to the time constant for an e-fold change for an exponential decay/rise), for several European glaciers, to be in the range between 4 years and 36 years (partly depending on the steepness of the glacial valley) [*] It's likely that the post 1940's glacial retreat that you mention was a continuing response to the warming to the 1940's, as the glaciers continued to respond to the temperature rise above the early 20th century temperature, even as the temperature rise stopped. Likewise, speaking of the European Alps, Solomina et al. (2007) [**] state:
    After a transitional time of modest gain since the 1960s, mass balances become strongly negative after about 1980. Most glacier tongues have started to react to this signal but are still far from a full dynamic response. Today – here in the sense of the year 2005 – tongues of medium-sized valley glaciers still reflect climatic conditions towards the end of the past century. In the meantime, average volume loss of Alpine glaciers has increased to about 2 to 3% per year. For a full geometric adjustment to the climatic conditions of 2000–2005, most glacier tongues and ice margins would require a farther retreat of a kilometer or more; and with repeated conditions of the extreme summer of 2003, most glaciers would disappear completely.
    "Simple relationships" do "begin to breakdown" if we pretend not to know what we know about them! [*] J. Oerlemans (2007) Estimating response times of Vadret da Morteratsch, Vadret da Palu¨, Briksdalsbreen and Nigardsbreen from their length records. Journal of Glaciology, Vol. 53, No. 182, 2007 [**] O. Solomina et al. (2008) Historical and Holocene glacier–climate variations: General concepts and overview. Global and Planetary Change 60, 1-9
    0 0
  22. #21 This is from your #15 post "The dominant effect on mountain glacier recession/advance, polar ice sheet recession/advance and sea level rise and fall is temperature. This relationship is obvious to the extent that it’s possible to assign rather crude correlates of glacier advance/recession and historical temperature" I'm not sure whether the words crude and obvious should have been in the same sentance given the context but there is a suggestion in that remark that there was a correlate. Your points i) and iii) seem to suggest that local, specific factors may dominate individual glaciers. If you accept that then really you can't make any general points about glaciers whether the data is to support one arguement or another. I'm unsure what you mean in point ii) Honestly with a lag time of 4-36years you can fit just about any pattern to a data series which is less than 100years. How does lag work taking into account the often huge intra-seasonal variation in glaciers? Heres my crude understanding. This is a general scheme. Ice in glaciers can exist in areas where the air temperature will allow this. During the warming (summer) months the glacier retreats and in the cold winter months the ice can again flow further to regain some of the lost ground. Given that Fig5 in this Report suggests that intra-seasonal variation can be many multiples of the final nett annual change then how does lag work. In series of years with warming temperature how can glaciers ignore the warming weather to regrow each year and show no annual nett change. I can accept that for individual glaciers there may have specific local conditions that may allow deviation from a strong correlation of warmer air = retreating glaciers but its difficult to see how that occurs as a generalized phenomenon averaged of the global data (and this is what we are talking about). Your quote about European Alps in many ways sum up things for me. 1) An extreme summer of 2003 can be directly associated with 5-10% mass loss, where is the lag? 2) Many glaciers are responding quickly but conviniently some are taking upto 100 years to respond. 3) How do we every draw reliable averaged, global data when we continue to dismiss anything that doesn't fit into the theory with arguments ground local conditions. As a scientist I'd love to be able to dismiss the data that doesn't fit my theory it would make the whole process a lot easier.
    0 0
  23. "Honestly with a lag time of 4-36years you can fit just about any pattern to a data series which is less than 100 years" why does this sound familiar? Hmm, I know, because on an earlier thread a denialist was insisting that some mechanism involving the sun (decreasing in activity in recent years) was causing climate change because there was a time lag, using an analogy which seemed to involve hot plates and watched pots if I remember correctly. And yet here the whole concept of time lag, perfectly valid for glaciers whose form reflects a balance of losses and gains, is rejected out of hand by another denialist. Cherry picking, in denioworld, is not restricted just to data.
    0 0
  24. re #22. As on the other thread you're playing fast and loose with the particular and the general and the local and global. One might think you were attempting to muddy what is a rather straightforward issue! If one samples over populations of glaciers, one finds that there is an overall glacier recession in a warming world (good examples in the USGS report you linked to) and advance in a cooling one. This is a sufficiently obvious and robust finding that one can use glacier recession as a crude "thermometer" of historical global temperature rise. One should incorporate what we know about glacier responses, as Oerlemans did (see paper cited in my post #21); he took account of the response time of the individuals glaciers studied, in other words the time it takes for glaciers progress towards the new equilibrium length/mass balance in response to temperature change (see [*] and papers by Oerlemans cited in my posts #15, and 21). Using glacier recession as a thermometer is bound to be a "crude" means of measuring global surface temperature (wouldn't you say?), but it's "obvious" that the straightforward relationship between glacier advance/recession and temperature (as in the USGS report you linked to) allows this to be done. Nothing wrong with including "crude" and "obvious" in a single sentence! Not sure what your insinuation re glacier response times is supposed to convey. This is a well characterized phenomenon, is specific to individual glaciers and can be assessed on an individual basis (see papers by Oerlemans cited in my posts #15 and #21 and [*]). If one wants to understand the relationship between temperature change and glacier response, we should assess response times and incorporate these into our understanding. You introduce a delicious false argument (with an interesting precedent) here: HumanityRules: "Your points i) and iii) seem to suggest that local, specific factors may dominate individual glaciers. If you accept that then really you can't make any general points about glaciers whether the data is to support one arguement or another." We could reframe your argument in the manner that it was used by antiscience propagandists of a recent generation, to highlight its deficiencies. If you assess cigarette smokers you'll find that their risk of contracting lung cancer relates to a number of factors outwith smoking that are both genetic and environmental (e.g. diet related). These latter factors are specific to the individual (highly "local"). One can then resurrect an analogous false argument by replacing a few appropriate words of your argument; e.g. "Your points (personal genetic/environmental factors) seem to suggest that local, specific factors may dominate individual lung cancer susceptibility. If you accept that then really you can't make any general points about smoking and lung cancer whether the data is to support one arguement or another". Do you see the deficiency in that argument HR? This relates to your focusing on the specific (individual glaciers or single specific local relative sea level as on the other thread) as if this negated the possibility of determining general trends by sampling over populations (and especially by taking into account what we know about the local factors). That’s obviously and crudely fallacious (apologies for using “obvious” and “crude” in a single sentence). You’ve made some odd misrepresentation of the text I pasted from the Solomina review: (i) 2003 in Europe was hot (we were in France that summer and it was definitely toasty). Solomina point out that those conditions would eventually cause most Alpine glaciers to disappear completely. Not very controversial. Your false précis of Solimina’s statement isn’t very interesting. (ii) Glaciers respond to changes in temperature. The response time is related to some rather well-characterised factors involving glacier geometry (e.g. the steepness of the glacial valley; its size). It’s silly to pretend that we don’t know about this. Try this paper [*] (or do some Googling), and work forward through the large number of papers that address this. (iii) If we want to understand natural phenomena we don’t dismiss what we know, and attempt to interpret observations in terms of caricatures denuded of meaningful detail. [*] David B. Bahr et al. (1998) Response time of glaciers as a function of size and mass balance: 1. Theory J. Geophys. Res. 103, 9777-9782
    0 0
  25. David You may want to watch what you write on this website I got my wrists slapped for writing "outlandish comment" Chris It's funny I accuse you of confounding local and global and you accuse me of the same. Points i) and iii) did attempt to highlight specific local conditions something that should be irrelevant over an averaged global scenario. I have no problem with the general principle of warming air = melting ice. I have a problem with the degree to which the historical process is minimised by yourself in order to over emphasis what is occuring today. Take the use of the term accelerating retreat, used to describe the retreat from 1970s to the present. Technically accurate, suggestive of an extra ordinary process occuring over the past 2 decades but go further back in time and you realise what is happening is a return to a previous rate of retreat in the 1940-50 before the pause around the 1970's.
    0 0
  26. Hi Steve, Yes, the situation with polar ice sheets and mountain glaciers must be very different. I’m no expert (I just read the papers to find out what the science shows!), but I expect that sea level rise should continue to accelerate as temperature continues to rise, since the rate of sea level rise seems to be for now related to the extent of warming above the pre-industrial temperature (e.g. see [*]). Much of this so far seems to be due to thermal expansion with some polar ice sheet contributions the latter seeming to be accelerating, and a small amount from mountain glaciers. I would have thought that the polar ice sheet contribution wouldn’t slow down for a very long time, whether or not any “catastrophic” “collapse”-type scenarios might kick in. Since polar ice sheet re-equilibration to a new forcing occurs on very slow timescales (hundreds of years; although HumanityRules doesn’t seem to like what I think is a very obvious expectation of a slow response time!), sea level rise isn’t expected to slow down for a very long time. In relation to the slow ice sheet response time, the fact that pre-industrial Holocene temperatures maxed around 8000 years ago, and sea levels were still rising from post-glacial ice sheet responses and warming-induced ocean expansion at least through 6000 years ago and possibly as late as 3000 years ago, it seems obvious that ice sheet responses (and ocean warming) have slow response times to warming forcings. As for mountain glaciers, I’m sure you’re right. There are definitely geographical contributions to glacier length and mass balance responses. According to several studies I’ve looked at there’s a strong geometrical contribution to the glacier response time (e.g. [**]), with steeper glaciers showing more rapid response times that shallow glaciers. My own feeling/guess/intuition/deduction would be that as glaciers retreated to higher and higher altitudes, the residual “rump” would become more and more difficult to melt. However, that might not be correct! Going back to your specific question I expect that sea level rise in the long term will be dominated by polar ice sheet melt, and this won’t stop for a very long time. It will continue to accelerate as the forcing increases (temperature continues to rise), and when the forcing stops rising, the ice sheets will continue to melt for many, many decades as they slowly re-equilibrate. [*] S. Rahmstorf (2007) A Semi-Empirical Approach to Projecting Future Sea-Level Rise Science 315, 368 – 370 A semi-empirical relation is presented that connects global sea-level rise to global mean surface temperature. It is proposed that, for time scales relevant to anthropogenic warming, the rate of sea-level rise is roughly proportional to the magnitude of warming above the temperatures of the pre–Industrial Age. This holds to good approximation for temperature and sea-level changes during the 20th century, with a proportionality constant of 3.4 millimeters/year per °C. When applied to future warming scenarios of the Intergovernmental Panel on Climate Change, this relationship results in a projected sea-level rise in 2100 of 0.5 to 1.4 meters above the 1990 level. [**] J. Oerlemans (2007) Estimating response times of Vadret da Morteratsch, Vadret da Palu¨, Briksdalsbreen and Nigardsbreen from their length records Journal of Glaciology, Vol. 53, No. 182 Abstract: Length records of two pairs of glaciers are used to reconstruct the equilibrium-line altitude (ELA) and to estimate glacier response times. The method is based on the assumption that neighbouring glaciers should be subject to the same climatic forcing, and that differences in the length records are thus caused by differences in response times and climate sensitivities. By means of a control method, in which the difference between the reconstructed histories of the ELA is minimized, realistic response times are found. The pairs of glaciers studied are: (i) Vadret da Morteratsch and Vadret da Palu¨ in the Swiss Alps and (ii) Briksdalsbreen and Nigardsbreen in southern Norway. In both cases the reconstructed ELA histories of the individual glaciers are very similar, in spite of the large differences in the length records. Short e-folding response times are found for the steep glaciers: 4.4 years for Vadret da Palii, 5.0 years for Briksdalsbreen. For the larger glaciers with a more gentle slope the response times are substantially larger: 33.0 years for Vadret da Morteratsch, 34.8 years for Nigardsbreen.
    0 0
  27. re #26; Steve, I posted this post on the wrong thread! I've posted it also on the Greenland ice trends where it belongs (even though it sounds like it should belong on a glacier thread like this one!)
    0 0
  28. Thanks Chris. You're right, my question might have been better here.
    0 0
  29. Pardon me gentlmen,Its my initial observation that your discussion is based on relatively short spans of time. Could any point me in the direction to obtain graphs of N.A.contitnental ice sheet deglaciation rates in more geologic time frames?
    0 0
  30. Additionally, if any could resolve Mr.Lindzens concerns about climate modeling,as expressed in this article. http://online.wsj.com/article/SB10001424052748703939404574567423917025400.html?mod=googlenews_wsj
    0 0
  31. bigdaddy, the point is that the changes we are experiencing now are far, far faster than those in more geologic time frames. That's the point, and that's the problem.
    0 0
  32. well, perhaps, I have other use for this data than the current climate change issue, wich i do.Thats why i was hoping someone could help me.I am specifically looking for North American continiental deglacition rates from the point in time of its southern most advance to the present day.estimated original mass,percentage of the original mass that exist today.wether it be tables, graphs etc. Im not sure that such estimates even exist.However, you have knowledge i dont wich points that its far far greater than it was in time frames of geologic scale. perhaps you could provide those geologic time frames you work with ? I have to start somewhere
    0 0
    Response: I don't know of tables or downloadable data but one paper How sensitive is the world's climate? (Hansen 1993) examines the period when the Earth fell into the last major ice age, calculating the change in Earth's albedo due to growing ice sheets. Should be worth a read - a good introduction to the concept of climate sensitivity also.
  33. An excellent read, Thanks for the suggestion.However, not much information of the sort i am seeking.
    0 0
  34. I have found an estimate of the North american Continental Ice sheet at the LGM,as measured in area, just in case any others might find this information usefull. " an area of about 15 million square kilometres (17.4 million, including Greenland ice)." For a full description here is the source: http://ess.nrcan.gc.ca/ercc-rrcc/proj4/theme1/deglac_e.php
    0 0
  35. Data: current North American Glacial Area 13080.6 sq.Km Overview of current North american Glaciation: Source: http://www.ccin.ca/cms/en/socc/currentGlaciers.aspx
    0 0

You need to be logged in to post a comment. Login via the left margin or if you're new, register here.


The Consensus Project Website

THE ESCALATOR

(free to republish)


© Copyright 2024 John Cook
Home | Translations | About Us | Privacy | Contact Us