Climate Science Glossary

Term Lookup

Enter a term in the search box to find its definition.

Settings

Use the controls in the far right panel to increase or decrease the number of terms automatically displayed (or to completely turn that feature off).

Term Lookup

Settings


All IPCC definitions taken from Climate Change 2007: The Physical Science Basis. Working Group I Contribution to the Fourth Assessment Report of the Intergovernmental Panel on Climate Change, Annex I, Glossary, pp. 941-954. Cambridge University Press.

Home Arguments Software Resources Comments The Consensus Project Translations About Support

Twitter Facebook YouTube Mastodon MeWe

RSS Posts RSS Comments Email Subscribe


Climate's changed before
It's the sun
It's not bad
There is no consensus
It's cooling
Models are unreliable
Temp record is unreliable
Animals and plants can adapt
It hasn't warmed since 1998
Antarctica is gaining ice
View All Arguments...


Username
Password
New? Register here
Forgot your password?

Latest Posts

Archives

The Climate Show #5: Green roofs and Brisbane floods

Posted on 21 January 2011 by John Cook

The Climate Show podcast have just released Episode 5. Their guest is Dr Brad Bass, an expert in “green” roofing who discussed the many advantages of growing things (even trees!) on our buildings. They also discuss last year’s record setting temperatures, the fakery of Don Easterbrook and an interesting breakthrough in solar power technology. Check it all out at the Hot Topic blog.

I talk to Glenn and Gareth about the Brisbane floods. I sent them a few pics to display during the interview - they include them in their show notes but I'll include some additional details below. A big factor in Queensland's heavy rainfall of late was conditions in the Pacific Ocean which is currently in a strong La Nina phase. The following picture shows La Nina conditions on Jan 17 (Monday just gone). You can see the effect of the strong trade winds pushing warm water to the west Pacific with cold, deeper water rising up to replace it in the east Pacific.

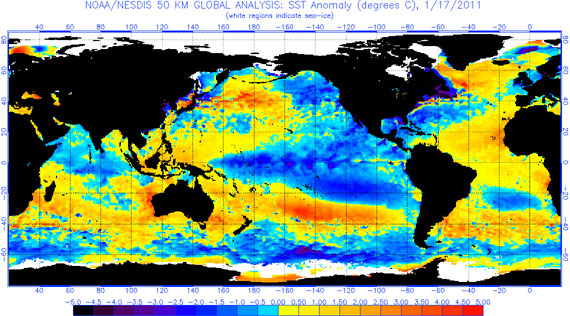
Figure 1: La Nina pattern on 17 Jan, 2011 (NOAA).

Historically, we're experiencing an unusually strong La Nina conditions. The SOI values for October 2010 and December 2010 were the largest positive values on record for those months:


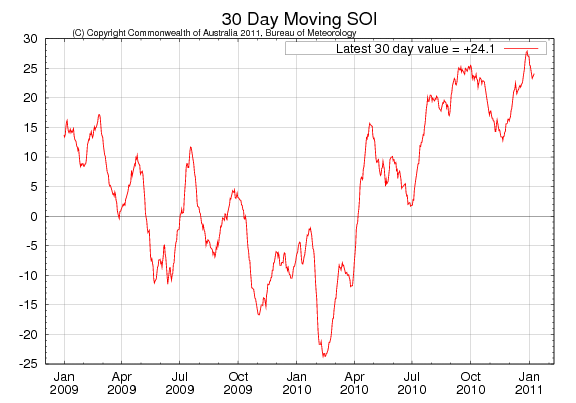
Figure 2: Southern Oscillation Index (Bureau of Meteorology).

Sea surface temperatures have steadily risen over the past century. Sea surface temperatures around Australia in 2010 were the hottest on record. Between January 3 to 13, CSIRO buoys off Queensland and Western Australia recorded sea surface temperatures 5°C above average.

http://www.bom.gov.au/announcements/media_releases/climate/change/20110105SSTgraph10.gif

Figure 3: Sea surface temperature around Australia (BoM).

When sea surface temperatures warm, we get more evaporation. This means more water vapour in the air. Globally, atmospheric water vapour has increased by about 5% over the 20th century.

Change in water vapor % over global ocean
Figure 4: Change in water vapor percentage relative to the 1988 to 2004 period over the global ocean plus linear trend, measured by satellite (
IPCC AR4 3.4.2.1).

At this point in the interview, I mentioned that the rise in atmospheric water vapour over the past 40 years was equivalent to around 900 Sydney Harbours - a factoid so pointless and bizarre, Gareth couldn't help laughing. Afterwards, someone emailed me, asking where that figure came from. Actually, I worked it out just before the interview. If anyone would like to check my calculations, they were as follows:

Around 1970, the water vapor in the atmosphere totaled about 1.27 x 10¹⁶ kg.

The Sydney harbour contains 556 gigalitres which weighs 5.56 x 10¹¹ kg.

Over the last half century, water vapor has increased about 4%. This is equivalent to 5.08 x 10¹⁴ kg which equals around 913 Sydney harbours.

The extra moisture in the air is expected to produce more extreme precipitation events. Globally, there's been a widespread increase in heavy precipitation days since 1950 (Alexander 2006, Groisman 2006).


Figure 5: Global number of days per year when precipitation was greater than 10mm per day, expressed as an anomaly from the 1961 tp 1990 reference period (Alexander 2006).

0 0

Printable Version  |  Link to this page

Comments

Comments 1 to 18:

  1. Thanks John, I picked up on the "900 Sydney Harbours" comment as I recently read a similar calculation stating the additional global precipitation in "Lake Superiors" (here). The most authoritative source I can find for the volume of Sydney Harbour (other than Wikipedia, which gives approximately 500 gigalitres ) is this - "An informal unit of storage capacity commonly used in Australia is the “Sydharb”, which is the amount of water in Sydney Harbour, about 530 000 megalitres or roughly half a cubic kilometre of water", (in Water History - Lessons for the Future) Also, The Honourable Craig Wallace, in a media release, December 13, 2007 says, "A sydharb is used as a unit of volume of water in Australia. One sydharb is the amount of water in Sydney Harbour - approximately 562,000 megalitres at high tide". The Encyclopedia of Earth figure used in the Lake Superior calculation (13,000 cubic km water in the atmosphere) came from an article on the Hydrologic Cycle and is consistent with the 1970 figure you used. I'd be interested if anybody can refine your calculation.
    0 0
  2. @ Steve Meacher (1) I had read that CP thread & remembered Leif's analogy as well. Some time back, I mentioned it to Lou Grinzo on his blog & between us we came up with this:
    Volume of water in the atmosphere = 1.27 x 10¹⁶kg Volume of water in Lake Superior = 1.21 x 10¹⁶kg
    Too close for Lake Superior to equal a 4% increase, as it was roughly equal to the volume of moisture in the air itself. However, Lake Erie is 4% of Lake Superior (119 3 miles vs that of Lake Superior at 2,900 3 miles). Interestingly, that is about equal to the volume of ice Greenland lost last summer (500 gigatons)...Lake Erie, a useful metric? Whodathunkit? Thus, the 4% increase in humidity can be said to equal the volume of Lake Erie raining down on you...hardly an encouraging thought, in more ways than one. The Yooper
    0 0
  3. #2: Yooper, The image of 'its raining Lake Erie' is too ghastly to consider.
    0 0
  4. Yay, another episode :) On a more technical note though, John thanks for the Groisman (2006) and Alexander (2006) papers, I have been looking for something like that. Does anyone know if there are more recent papers on trends in heavy precipitation event around the globe? Yes, I'm being lazy, sorry.
    0 0
  5. @ Albatross (4) Not a global study, but here's a regional study done in the NE US in 2010: Trends in Extreme Precipitation Events for the Northeastern United States 1948-2007 The source notes cite several other pub's between 2006 and 2009. The Yooper
    0 0
  6. #4: "more recent papers on trends in heavy precipitation events" Here's another resource for rain, snow and temperature extremes: NOAA Climate Attribution: Assessments and Factsheets Interesting bit about global sea surface temps, not ENSO, being responsible for US drought conditions: An SST-induced dry signal did exist in 2007, spanning much of the southern U.S., and originated from SST conditions outside the tropical Pacific. This dry signal overwhelmed the ENSO wet signal, and we estimate a large increase in the probability of U.S. drying having intensities as large as observed in 2007 due to such a global SST influence. That would verify that global SSTs are warm.
    0 0
  7. Dan and Muoncounter, Thanks for those links. Beautiful image on the front of the PDF Dan... Some of the links therein inspired me to dig a little deeper and I found some recent papers on trends in precipitation and heavy precipitation (it would be great if someone had the time to do an up to date meta analysis). Anyways this is what I found: Wentz et al. (2007, Nature): "Climate models and satellite observations both indicate that the total amount of water in the atmosphere will increase at a rate of 7% per kelvin of surface warming. However, the climate models predict that global precipitation will increase at a much slower rate of 1 to 3% per kelvin. A recent analysis of satellite observations does not support this prediction of a muted response of precipitation to global warming. Rather, the observations suggest that precipitation and total atmospheric water have increased at about the same rate over the past two decades." Zhang et al. (2007, Nature): "We estimate that anthropogenic forcing contributed significantly to observed increases in precipitation in the Northern Hemisphere mid-latitudes, drying in the Northern Hemisphere subtropics and tropics, and moistening in the Southern Hemisphere subtropics and deep tropics. The observed changes, which are larger than estimated from model simulations, may have already had significant effects on ecosystems, agriculture and human health in regions that are sensitive to changes in precipitation, such as the Sahel." Lau et al. (2008, JGR-A) Allan et al. (2010, Env. Res. Letters): "Analysing changes in extreme precipitation using daily data within the wet regions, an increase in the frequency of the heaviest 6% of events with warming for the SSM/I observations and model ensemble mean is identified. The SSM/I data indicate an increased frequency of the heaviest events with warming, several times larger than the expected Clausius–Clapeyron scaling and at the upper limit of the substantial range in responses in the model simulations." Allan and Soden (2008, Science) "We used satellite observations and model simulations to examine the response of tropical precipitation events to naturally driven changes in surface temperature and atmospheric moisture content. These observations reveal a distinct link between rainfall extremes and temperature, with heavy rain events increasing during warm periods and decreasing during cold periods. Furthermore, the observed amplification of rainfall extremes is found to be larger than that predicted by models, implying that projections of future changes in rainfall extremes in response to anthropogenic global warming may be underestimated." New et al. (2001, IJC): "Data from a number of countries provide evidence of increased intensity of daily precipitation, generally manifested through increased frequency of wet days and an increased proportion of total precipitation occurring during the heaviest events. Over most land areas there has also been an increase in the persistence of wet spells."
    0 0
  8. sciencedirect.com/science?_ob=ArticleURL... Abstract One of the more important questions in hydrology is: if the climate warms in the future, will there be an intensification of the water cycle and, if so, the nature of that intensification? There is considerable interest in this question because an intensification of the water cycle may lead to changes in water-resource availability, an increase in the frequency and intensity of tropical storms, floods, and droughts, and an amplification of warming through the water vapor feedback. Empirical evidence for ongoing intensification of the water cycle would provide additional support for the theoretical framework that links intensification with warming. This paper briefly reviews the current state of science regarding historical trends in hydrologic variables, including precipitation, runoff, tropospheric water vapor, soil moisture, glacier mass balance, evaporation, evapotranspiration, and growing season length. Data are often incomplete in spatial and temporal domains and regional analyses are variable and sometimes contradictory; however, the weight of evidence indicates an ongoing intensification of the water cycle. In contrast to these trends, the empirical evidence to date does not consistently support an increase in the frequency or intensity of tropical storms and floods Note the last sentence of the abstract.
    0 0
  9. OK....off topic. What do you need to do to post the link so nicely as comment number 7 has done?
    0 0
  10. Re: Camburn (9) Veteran posters like Albatross rely on using HTML tags to make a clean presentation, as you note. Here's some basic tags: Practice by using the Preview button. The Yooper
    0 0
  11. Camburn, Thanks for the link. Huntington (2006, J. Hydrol.). From his conclusions: "Consistency in response among multiple variables lends observational support for theoretical arguments and GCM predictions that warming will likely result in further increases in evaporation and precipitation.The theoretical hydrologic response to a warming-induced intensification as manifested in an increasing frequency and intensity of tropical storms and floods (Knutson and Tuleya, 1999; Tuleya and Knutson, 2002; Karl and Trenberth, 2003) is not supported by the preponderance of evidence to date. Because of the long-term return intervals and stochastic nature of the occurrence of extreme events, however, it may require substantially more time before a change in frequency can be detected (Free et al., 2004). The lack of detectable trends in the frequency and intensity of tropical storms during the 20th century should not be taken as evidence that further warming will not lead to such changes in the future, particularly as the rate of warming in the 21st century is expected to be several times greater than in the 20th century (Cubasch and Meehl, 2001)." The Huntington paper is actually in closer agreement with the findings papers I cited than his abstract suggests. The paper cited referring to tropical storms and floods are quite old, from 1999-2003. The Allan et al. (2010) paper uses satellite data (which provides continuous spatial and temporal coverage) and reveals a different picture regarding tropical storms: "The SSM/I data indicate an increased frequency of the heaviest events with warming, several times larger than the expected Clausius–Clapeyron scaling and at the upper limit of the substantial range in responses in the model simulations."
    0 0
  12. Albatros@11: Personally, I am not comfortable with satillite data indicating rain, or its intensity. As a farmer, I watch the satillite/radar data with great interest. South America does not have a very good radar system, so one has to rely on satillites for hints of their precip pattern. Cloud temp etc will indicate that rain should be falling, and a lot of times it isn't. The satillite maps are useful in that one can see what should be happening, then find the local meteorlogical office for that potential event to see what emperical evidence of rain etc is there.
    0 0
  13. #8: "Note the last sentence of the abstract." The Huntington paper, with its "should not be taken as evidence that further warming will not lead to such changes in the future" was accepted for publication in July 2005. Ironic that a mere 6 weeks later, Katrina arrived and the remainder of the 2005 Atlantic tropical storm season was one of the worst ever. Pretty good prediction of the future after all.
    0 0
  14. Camburn, I think you underestimate the satellite-derived precipitation data. Please read more about the SSM/I data and there validation. I'm afraid to tell you that rain gauge and radar (especially C-band) data are also fraught with problems, they are not the panacea that some think them to be-- I have worked with both platforms and can attest to the fact that they have issues. Yet, I do not dismiss the research done using them simply b/c they provide inconvenient or uncomfortable results. Regardless, I pretty coherent, robust and substantive picture is beginning to emerge with time using data from multiple, independent precipitation observation platforms. Further, the observations suggest that the models are likely underestimating the increase in precipitation intensity (see the papers by Zhang et al. and Wentz et al above). Please apply your "skepticism" properly and not uni-directionally.
    0 0
  15. # Daniel Bailey (2) I've had another look at Leif's original calculation. He was actually not looking at total increased water vapour in the atmosphere (as John is) but at increased total precipitation over land. Although I disagree with some of the details of his calculation, I reckon his result is about right. I get around 1.6 "Lake Superiors" additional precipitation over land, globally. Given recent media statements that twice the volume of Sydney harbour was flowing daily through Wivenhoe Dam, I thought it might be interesting to estimate how many extra "Sydney harbours" of rainfall Australia might expect. Based on 1989 rainfall (BoM) of 3,713 cubic kms. an increase in precipitation of 4% translates to an extra 267 Sydney harbours falling across Australia each year.
    0 0
  16. Albatross@14: My skepticism of the validity of SSM/I is a result of finding the on ground measurements verses the SSM/I indications. I am most interested in Argentina/Brazil as weather patterns in that area directly affect my business. I do not take a single rain guage as verification. It is quit easy to find various rain guages that verify or refute what the satillite is showing at a certain time. This indicates to me that the satillite measurements/data are not reliable metrics. Radar for sure is an unreliable metric of actual measured precipitation. I have read several papers concerning precipitation events/trends etc. One thing I have noted is the seemingly absense of error bars in the papers. It is very hard to draw conclusions without those present. My experience would indicate that the SSM/I error bars should be relatively large, but without the underlying data it is impossible for me to create them. This type of science is extremely important to me in making sound business decissions and I can only hope it becomes more precise in the future. Thank you for the links presented.
    0 0
  17. Was the last flood in Australia worse than the floods of 1973-74? http://www.bom.gov.au/lam/climate/levelthree/c20thc/flood7.htm
    0 0
  18. Camburn @16, "One thing I have noted is the seemingly absense of error bars in the papers. It is very hard to draw conclusions without those present." That is a generalized statement, and I can only assume it applies to the Allan et al. (2010) paper. If so, you then need to look at the data in their Table 1 (you can view the PDF by clicking on the PDF hyperlink below the abstract) which does in fact include 95% confidence intervals (i.e., error bars) for the satellite data, GPCP data and modelling data. Regardless, Zhang et al. (2007) used observed gauge data: "We used monthly precipitation observations over global land areas from the most recent version of the Global Historical Climatology Network (GHCN) to analyse precipitation trends in two twentieth century periods". "Our best estimate of the response to anthropogenic forcing suggests (Fig. 1b) that anthropogenic forcing has contributed approximately 50–85% (5–95% uncertainty) of the observed 1925–1999 trend in annual total land precipitation between 40 N and 70 N(62 mm per century), 20–40% of the observed drying trend in the northern subtropics and tropics (0 to 30 N; a decrease of 98 mm per century) and most (75–120%) of the moistening trend in the southern tropics and subtropics (0 to 30 S; 8 mm per century)." Note the ranges (i.e., uncertainty ranges). And note the impact on the S. Hemisphere tropics and subtropics have been affected. Camburn, you seem to be seeking out excuses to convince yourself that AGW is not happening and/or that the consequences in many cases are not going to be unpleasant. Feel free to seek out excuses, you are after all entitled you your opinion and interpretation of the facts, but you are not entitled to your own facts. The fact that we can already discern a notable impact on the hydrological cycle from the warming is very telling and not at all reassuring. Consider this paper by Lenderink and Meijgaard (2008, Nature): "Here, we analyse a 99-year record of hourly precipitation observations from De Bilt, the Netherlands, and find that one-hour precipitation extremes increase twice as fast with rising temperatures as expected from the Clausius–Clapeyron relation when daily mean temperatures exceed 12 °C" Only one location, but the physics apply to your part of the world too.
    0 0

You need to be logged in to post a comment. Login via the left margin or if you're new, register here.


The Consensus Project Website

THE ESCALATOR

(free to republish)


© Copyright 2024 John Cook
Home | Translations | About Us | Privacy | Contact Us