Does Urban Heat Island effect add to the global warming trend?
Posted on 24 September 2008 by John Cook
It's well established that urban areas are warmer than surrounding rural areas. However, does Urban Heat Island (UHI) contribute to the global warming trend? Short answer, no. Two thirds of global temperature data comes from ocean records, free of UHI effect. For land records, urban trends are compared to nearby rural data - anomalous urban trends are homogenized to match rural records (Hansen 2001). However, in most cases, the urban temperature trend is observed to be little different to the rural trend. A new paper Urbanization effects in large-scale temperature records, with an emphasis on China (Jones et al 2008) looks at this in more detail.
Comparing rural and urban sites in London and Vienna
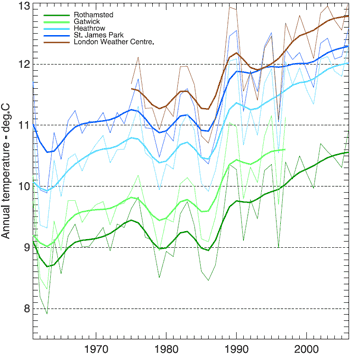
The paper begins by looking at 5 sites in and around London. Figure 1 shows absolute temperatures, clearly indicating a UHI influence on the urban sites at London Weather Centre (brown) and St. James Park (dark blue). The coolest record is the rural based Rothamsted (dark green). However, the excess urban warmth has no effect on the temperature trend - all sites show the same overall trend.

Figure 1: Annual temperature trends for five sites in and around London. Brown and dark blue are urban sites, green are rural.
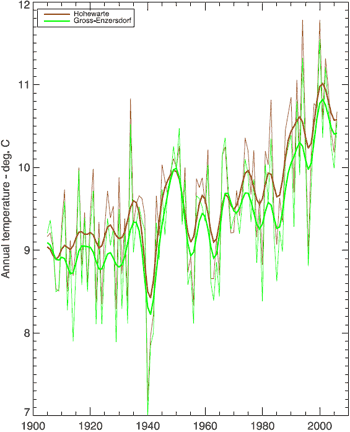
A similar comparison was made between two sites in Vienna. Again, the absolute temperature is greater for the urban site but both sites show near identical trends.

Figure 2: Annual temperature trends for two sites in Vienna – Hohewarte in the center (brown) and the rural location of Grossenzersdorf (green).
Comparing rural and urban networks in China
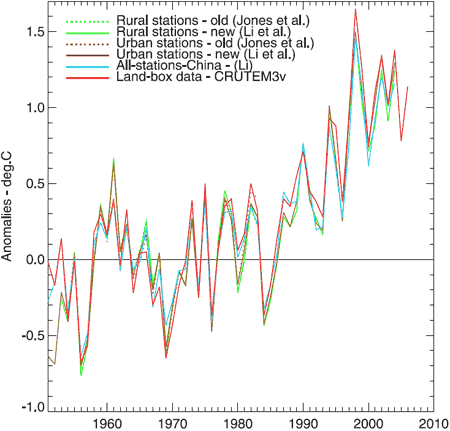
So established urban areas show the same trends as surrounding rural areas. What about urban areas that are still developing? China, in contrast to Europe, has experienced rapid economic growth over the last 30 years with a dramatic increase in its city areas. If there were to be significant urban-related warming, it ought to be in this region and over recent decades. Figure 3 compares a range of temperature datasets:

Figure 3: Annual average temperature anomalies. Jones et all (dotted green and brown) is a dataset of 42 rural and 42 urban sites. Li et al (solid green and brown) is a homogenized dataset of 42 rural and 40 urban sites. Li (blue) is a non-homogenized set of 728 stations, urban and rural. CRUTEM3v (red) is a land-only data set (Brohan et al., 2006). This plot uses the 1954–83 base period.
That there are hardly any differences between the six series tells us several things. Small datasets of 40 stations show the same result as the 728 station dataset. In other words, for a region of this size, the average can be constructed from a limited number of sites, implying that for the 728 station network there is considerable redundancy.
As the scale increases, the overall impact of homogeneity adjustments diminishes. This might be a bit heartbreaking for those hard working boffins who spend hundreds of hours pouring meticulously over station data, ensuring the data is all homogenised (but of course, they don't do it just to calculate global trends).
And of course, the most significant finding: the trend is the same for both urban and rural groups over any of the periods. Even in the case of developing urban areas, when averaged out over large areas, urban heat island has little impact on the warming trend.


 Arguments


I see how they correct for UHI in the urban areas by using nearby rural areas. However, a difference in urbanization between city and rural would not skew global warming as much as the difference in urbanization rates between city and rural. In other words, a city that stays the same size would not give a false global warming effect. But a rural area that turns into a town that grows to a city would.
How do the correct for the urbanization of rural areas?
I dont think I understand your point at all. A rural area that has become urbanized is no longer "rural" for the purposes of correcting the record and cannot be used for such. I highly recommend that you read some of the detailed methodology. Eg Hausfather et al, 2013
EE
Your right that it is a change in the local characteristics of a site that can potentially skew the results.
How do they corrrect for this changing? Hopefully the metadataassociated with each station is updated as any such change occurs.
Also, the GHCN dataset that is used as the basis for some of the temperature products uses an automated pairwise adjustment method, contrasting nearby stations with each other to look for unusual variations in any station.
The data set produced by NASA GISS goes further. They use satellite data about lights at night to estimate degree of urbanisation, independent of station meta data. So any evolution of a site from rural to urban, at least in the satellite era can be detected.