


 Arguments


Ocean Warming has been Greatly Underestimated
Posted on 14 October 2014 by Rob Painting
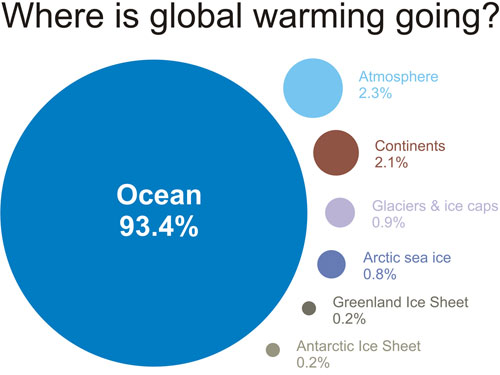
- The oceans are by far the largest heat reservoir on Earth, absorbing 93% of global warming. Because of this, accurate assessments of heat uptake are essential to balance the sea level budget, and for observationally-based estimates of climate sensitivity.
- Prior to 2005, when the Argo global array of submersible floats became operational, ocean temperature was much more sparsely sampled, especially in the southern hemisphere, leading to larger uncertainty over the evolution of ocean warming through time.
- Durack et al (2014) analyse the period from 1970-2004 combining ocean temperature and sea surface height measurements with climate model simulations, and find that sparse sampling in the southern hemisphere oceans, and limitations of previous analytical methods, has led to a substantial underestimate of warming in the 0-700 metre layer*.
- When corrected for this bias, Durack (2014) find that the top 700 metre layer of ocean, over the period 1970-2004, has warmed some 24-58% more than previous analyses have indicated.
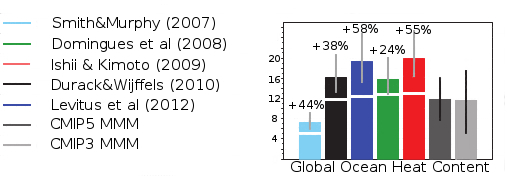
Figure 1 - Observed (coloured bars) and modelled (grey bars) upper ocean heat content changes for the period 1970-2004 from previous analyses. Top coloured segments are the adjustments based on the Durack (2014) study. Units are x1022 joules 35 yr-1 and MMM = multi model mean. Image adapted from Durack et al (2014).
The Oceans Have Warmed, But How Much?
The Argo system of automated floats was constructed in order to provide more reliable and robust measurements of ocean temperature, and other quantities such as salinity and current velocity. Although they only measure down to typical depths of 2000 metres, and still exclude regions such as the Arctic and Indonesian Throughflow, the 3000+ floats represent a major step up in accuracy over older methods.
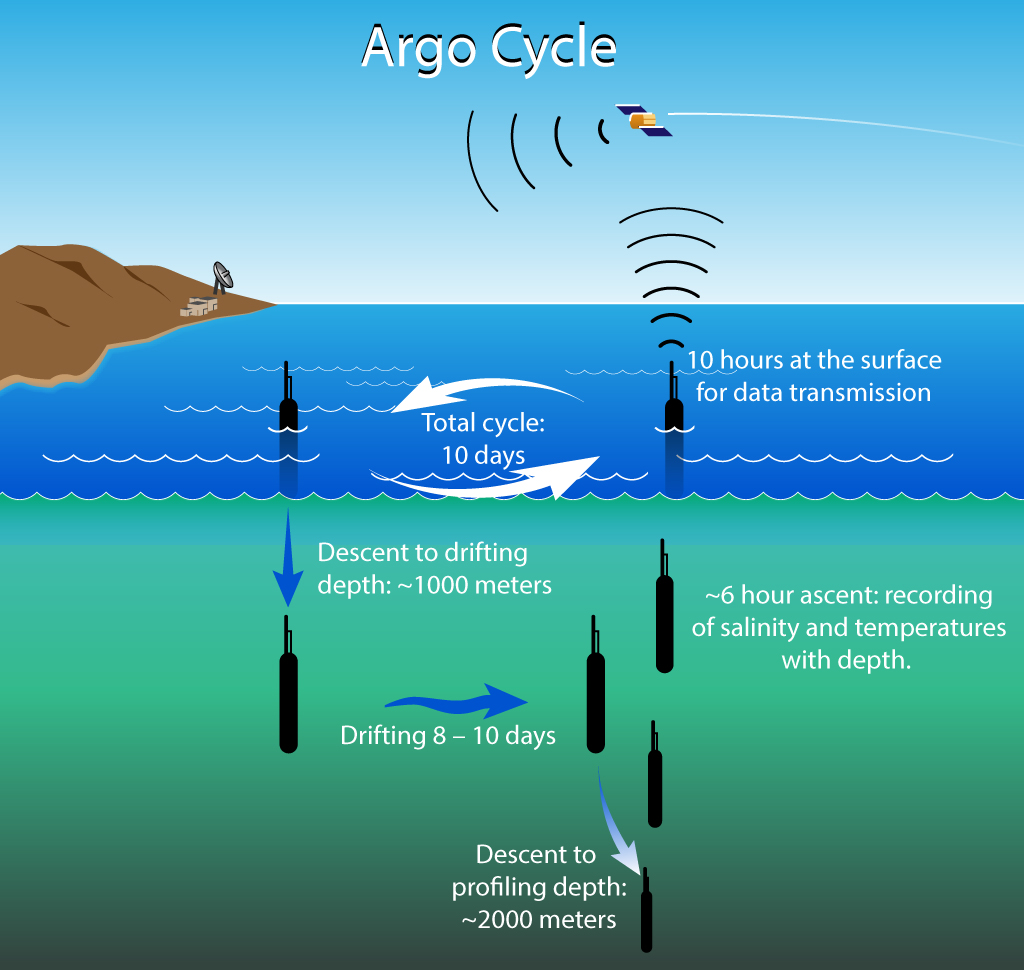
Figure 2 - typical Argo cycle.
By 2005 the Argo network rollout had achieved sufficient coverage to become operational, but prior to that the data collected came largely from ship-based methods which were more sparsely sampled in time and space, and typically only measured down to 700 metres. Some instruments, such as expendable bathythermographs (XBTs), have had major issues too because XBTs don't directly measure depth along with temperature, but instead rely on fall rates to estimate depth at each point in time a particular measurement is taken. Complications with fall rate estimates has introduced a considerable bias into the ocean heat content record that has had to be accounted for (Abraham et al [2013]).
Another issue is that some analyses (Ishii & Kimoto [2009], Levitus et al [2012]) use a method to infill poor or missing data that tends to underestimate any trend. These analyses use the climatological mean, or zero anomaly, to infill the missing data and therefore bias low any trend whether that be warming or cooling . This is particularly relevant to the southern hemisphere where measurements were much sparsely sampled than in the northern hemisphere. All-in-all, these and other sampling problems add much larger uncertainty to pre-Argo data.
Southern Hemisphere Ocean Warming Could Be Massively Underestimated
Unlike the ocean temperature record, precise near-global coverage of sea surface height has been collected by satellite altimetry since 1992. Durack (2014) make use of this satellite altimetry data, and climate model simulations of ocean heat uptake, circulation variability and sea surface height, in order to make a better estimate of changes in ocean heat content prior to 2004 - when the more well-sampled Argo float array took over as the main source of ocean heat content measurements.
It's a clever approach as the satellite sea surface height data contain information about changes in ocean heat content through the effect that temperature has on thermal expansion - raising sea surface height as it grows warmer, and lowering it through cooling. Provided that other sources that alter sea surface height both in time and location can be accounted for, it's possible to determine how much of the sea surface rise was caused by the increase in ocean heat content. This should reveal any discrepancies with previous ocean heat content estimates, if they exist. And that's precisely what they found.
Where Does Ocean Heat Go?
Based on consideration of oceanographic principles - and observations, of how the ocean circulation operates - there are key regions of the world oceans where we would expect the uptake of heat (and other qualities) to be greater-than-average. In the northern hemisphere the number one spot is the North Atlantic Ocean. Here surface currents converge and are forced downwards in the North Atlantic subtropical ocean gyre, and salty surface seawater transported north from the tropics finally cools and sinks further north near Greenland as part of the thermohaline circulation. In the southern hemisphere, the key regions are the subtropical ocean gyres, where convergence of surface currents occur, and the Antarctic Circumpolar Current.
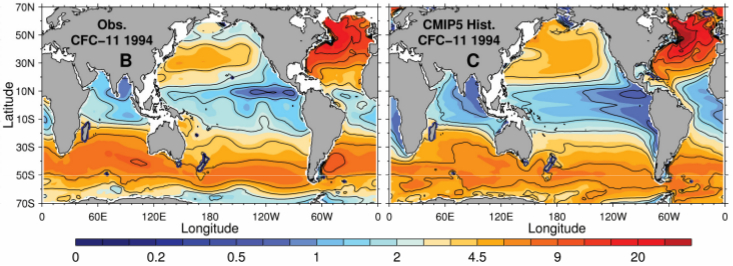
Figure 3 - Chemical tracers in the sea, the banned refrigerant CFC-11 in this instance, highlight the major ocean ventilation pathways. As surface water sinks it takes properties such as heat and dissolved gases with it. Higher densities of dissolved CFC-11 gas at mid and high latitudes (orange/red) reflect the main ventilation sites. The climate models (c) strong match to the observations (b) suggests the models are reproducing the ocean circulation with great skill . Image from Durack (2014).
The Durack (2014) authors make use of the large collection of climate model simulations from the CMIP3 & CMIP5 project covering the period since 1970 - an interval during which sampling deficiencies are small enough to yield reliable ocean heat content estimates. The multi-model mean is a useful metric because, by averaging together all the individual model simulations, this has the effect of removing the inherent natural variability that exists in the climate system. Any chosen observational time period is not expected to match the multi-model mean exactly because the observations do include natural variability, i.e. the observations are equivalent to one climate model simulation, not the mean (average) of all the simulations combined. The observational mean and the multi-model mean, however, should prove instructive - see Figure 4.
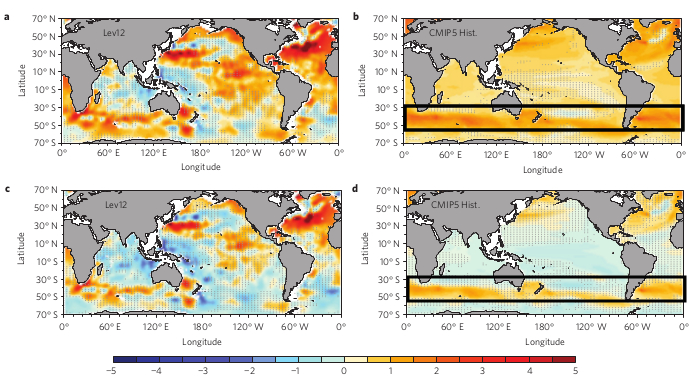
Figure 4 - Upper ocean (0-approx 700 mtrs) heat content trends for 1970-2004. a) & c) are observations from Levitus et al (2012) and b) & d) from the CMIP5 historical simulations. The bottom two panels (c & d) show trends with the global average trend removed (anomalies). The Levitus (2012) observations are inconsistent with theoretical & modelled expectations - as highlighted by the black bars. Image adapted from Durack (2014).
Can Precise Sea Surface Height Observations Shed Some Light?
Although the Levitus (2012) data for the northern hemisphere reveal warming to be strongest in the North Atlantic, as expected, and in the vicinity of the North Pacific subtropical gyre, again expected, the sparsely-sampled southern hemisphere does not meet expectations. It is no coincidence that the strongest warming in the southern hemisphere climate model simulations is mainly within the black bars in Figure 4, as these are the latitudes occupied by the subtropical ocean gyres, where surface water converges and is pumped down (Ekman [1905]) into the ocean interior. Southern hemisphere westerly winds have strengthened considerably since 1970 and shifted poleward (Russell et al [2006]), which should have substantially increased the ventilation of the subtropical gyres (Inui et al [1999]) and thus the downwelling of heat there, but the Levitus (2012) data don't show this.
Durack (2014) now compare the climate model simulations of sea surface height with the well-sampled observations taken from satellite altimetry since 1992. See Figure 5.
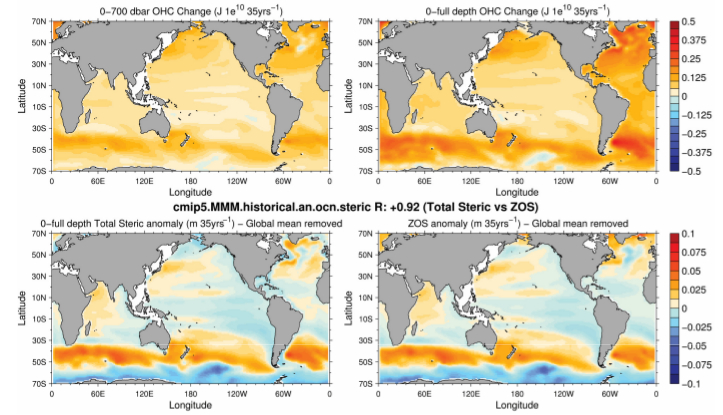
Figure 5 - 35-year multi-model mean of ocean heat content for 0-700 mtrs (top left panel) and full ocean depth (top right panel). Bottom left panel shows the calculated sea surface height anomaly derived from modelled temperature & salinity, and the bottom right panel shows sea surface height anomaly from the CMIP5 climate model simulations. Image from Durack (2014).
So in the context of the various data sets examined, and the consistency with climate model simulations and theoretical understanding, the ocean heat content data in the southern hemisphere are the odd man out here. Accounting for well-known variations in ocean circulation, salinity (which affects density of the water column and therefore sea surface height), and the ongoing addition of meltwater from globally disintegrating land-based ice, the rise in the height of the sea surface in the southern hemisphere, due to thermal expansion, is much larger than older ocean heat content estimates suggest.
Durack (2014) perform a number of other consistency checks to test their findings (see Figure 6), and once satisfied their result is robust, then use the close correspondence between hemispheric-scale sea surface height change and ocean heat content to adjust the southern hemisphere estimates. When they did so, the authors found that the southern hemisphere oceans (0-700 mtrs) warmed a whopping 48%-166% more than previous studies found, and the global ocean 24%-58% more (see figure 1).
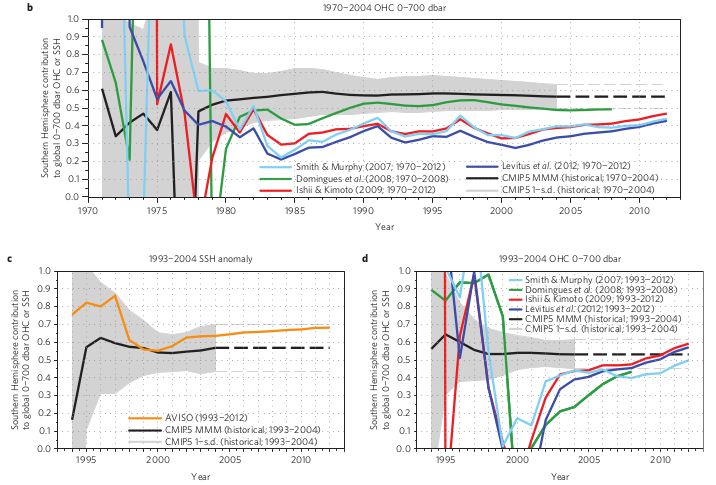
Figure 6 - Southern hemisphere fractional contributions to global upper-ocean heat content (OHC) or global average sea surface height (SSH) anomaly for varying trend lengths (1–35 years). b) ocean heat content. c,d), Results for a shorter 11-year period for SSH (c) and OHC (d) during which observed SSH data is available. Discontinuous black and grey lines extend 2004 CMIP5 values to 2012. The black line is the multi-model mean from CMIP5. Convergence toward the multi-model mean is apparent in all data sets. Image from Durack (2014).
Uncertainty is Like a Dagger - it Cuts Both Ways
The non-stop nature of ocean warming, like most observational evidence, has been a persistent thorn in the side of people who like to imagine that global warming isn't happening. When this ocean warming (93% of global warming) is pointed out, it inevitably prompts excuses about the uncertainty of the measurements, but the evidence laid out by Durack (2014) shows that uncertainty has actually led to a vast underestimate in the magnitude of ocean warming prior to the implementation of the superior Argo network in 2005. This is exactly the opposite of the impression some like to convey about ocean heat content uncertainty - the dagger cuts both ways.
By drawing together observational evidence from multiple sources, and testing the robustness of these data against a large number of climate model simulations, the authors of Durack (2014) make a compelling case that the warming of the southern hemisphere oceans has been greatly underestimated. This is largely due to sparse sampling in time and space, and inadequacies in methods which account for missing data in previous analyses. The likelihood of an underestimate has been highlighted in previous research too (Gille [2008], Lyman & Johnson [2014]), but the novel aspect of this research is the authors' thoroughness in quantifying the magnitude of the underestimate. The oceans have warmed a great deal more than many have realized.
*Durack (2014) use dbar as a 'yardstick', which is conventional in oceanography. dbar is a measure of pressure and therefore depends on the density of the water column, which varies from place to place, and in time. 700 metres is a reasonable depth approximation for most intents and purposes.


1. The adjustments are above the CMIP MMM error bars.
2. The adjustments come from the southern hemisphere only, the northern hemisphere follows with the CMIP MMM.
3. The error found in the 0-700meter southern hemisphere increases the total global heat accumulation (as compared by Nuccitelli et. al 2012) by (roughly) 9-30%.
Implications for TOA heat flux
1. Total heat flux imbalance is now adjusted upwards from .7 to .9 watts per meter squared.
2. Since the entirety of this adjustment occurred in the southern hemisphere, (but not the northern) indicates that there is a fundamental flaw in the basic model of understanding.
3. The basic model of understanding appears to be severely underestimating northern hemisphere aerosol effects.
4. The basic model also appears to be extremely underestimating GHG radiative forcing effects, (measurement error in SH + aerosol adjustment error in NH)
5. This analysis pushes the AR5 results to the very edge of the 2-sigma error range for these two forcing mechanisms.
Iplications:
1. ECS is now likely between 3C and 5.5C with an increased "most likely" value of 4C for a 2X CO2.
2. Future land-only temperatures will increase under given emissions pathways at a much higher rate than previously modeled as TOA energy imbalance increases 20% more rapidly.
3. Carbon cycle and permafrost degredation will occur more rapidly and more intensely than previously considered.
4. This does explain a bit why the modeled arctic sea ice projections were deviatiing so strongly from observations. The relatively aerosol-free arctic is experiencing a much higher downward longwave flux than has been modeled.
It can't be said enough times...
Thanks Rob for a good summary.
Bigger CS less carbon budget.
Not that we have one!
Might help explain why last CO2 350ppm the world was 3-5C hotter a little more, and that is being optimistic as those estimates don't include the warmer Pacific warm pool recently reported for the early Pliocene.
Fascinating paper and well worth a careful read. Actually the paper is dense enough that it requires a careful read. Personally I would have preferred that the AVISO sea surface height data was shown in the body of the main paper rather than being relegated to a supplementary appendix. There are enough inconsistencies with the multi-model mean that it would be better to put it in and let readers work their own way through the comparison and the authors' justifications.
The figure shown here as Figure 5 is Figure S5 in the appendix. There must be some subtle technical details I'm missing, but the comparison seems to be largely pointless, since both sets of modeled data in question pretty much have to have a high degree of correlation.
Apart from water transfered to the oceans from continental glaciers, ice sheets and groundwater, what else besides thermosteric and halosteric effects can affect sea level over large areas on a decadal time frame? Persistant wind patterns, maybe?
[Rob P] - As explained in the post, the multi-model mean is equivalent to an Earth without any natural variability, so of course there are inconsistencies. Yes, there is some circular reasoning here because the sea surface height (SSH) data only extend back to 1992, and it would be nice to see a comparison of two truly independent data sets over the entire period - but they don't exist. Perhaps tide gauge data in tandem with ocean models in the latter part of the 20th century could help here? Lots of issues to overcome there however.
In regard to decadal time frames, the Interdecadal Pacific Oscillation (IPO) has a significant effect on sea surface height. The negative phase (2000-to present-day) sees intensified trade winds which temporarily pile up water mass in the western tropical Pacific and diminish it in the eastern tropical Pacific (see the SkS Tuvalu sea level rise rebuttal) and cause greater-than-average precipitation over land, thus temporarily reducing the ocean volume (see SkS Sea level fell in 2010 rebuttal and SkS post A relentless rise in global sea level).
Maybe once/if a deep Argo network gets underway, we can come to grips with the nitty-gritty details and finally get around to closing that sea level budget.
In addition, a higher GHG forcing and stronger aerosol effect would reveal anthropogenic impacts on 1910-1975 warming trends as well as lend increased weight to Ruddiman et. al (2011) http://www.whoi.edu/pclift/Ruddiman.pdf
A fascinating article. Thanks, Rob. You've persuaded me that it will be worth my while to read Durack et al. in detail. I hope others, who are more knowledgeable, will comment on the fascinating/frightening implications that jja (@1) sees in the results of Durack et al.
If there are markers in the sea how long does it take for Gulf Stream water that sinks off Norway to resurface in Antarctica? http://www.climateoutcome.kiwi.nz/blog/global-warming-pause