


 Arguments


Why is Greenland's ice loss accelerating?
Posted on 17 November 2009 by John Cook
Recently, we looked at satellite gravity measurements of the Greenland ice sheet, finding that Greenland is losing ice at an accelerating rate. This has now been confirmed by independent calculations of surface mass balance and ice discharge rates (van den Broeke et al 2009). More importantly, the extra data offers keen insights into the contributing factors of Greenland's accelerating ice loss.
Greenland's ice mass balance is governed by two factors: Surface Mass Balance (SMB) and ice Discharge (D). Surface Mass Balance is the result of ice gain from precipitation (rain & snow) minus ice loss from sublimation and runoff. In van den Broeke et al 2009, Surface Mass Balance is calculated by the Regional Atmospheric Climate Model which is then confirmed by on-site observations. Ice discharge is the loss of ice as glaciers calve into the ocean. Satellite measure the velocity of ice as it moves towards the coastline as well as the thickness of the glaciers. This data is combined to calculate the total amount of ice discharge (Rignot 2008).
Greenland's total mass change is then calculated by taking the difference between Surface Mass Balance and Discharge. This result SMB - D can be directly compared to Greenland's total mass change as determined by the GRACE satellites' gravity measurements. The two independent time series show strong agreement as seen in Figure 1:
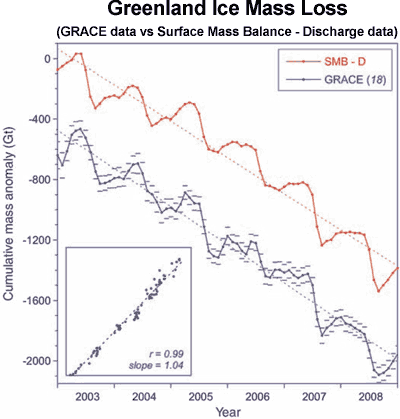
Figure 1: Surface Mass Balance - Discharge (red) compared with GRACE data (blue). GRACE data is offset vertically. Short horizontal lines indicate GRACE uncertainty. Dashed lines indicate linear trends. The scatter plot in the inset shows a direct linear regression between monthly GRACE values as a function of the cumulative SMB - D anomaly (van den Broeke et al 2009).
The Surface Mass Balance reconstruction also offers deeper insight into the various components that cause Greenland's mass loss. Figure 2 shows Greenland's total mass balance broken into its two components: Surface Mass Balance and Discharge. Don't be put off by the Discharge showing a positive upturn after 2000 - this is actually meant to indicate that Greenland is losing more mass due to ice discharge. We see that not only is Discharge increasing sharply due to faster moving glaciers, the Surface Mass Balance also fell sharply. Greenland's total mass loss over 2000 to 2008 is equally split between Surface Mass Balance changes and Ice Discharge.

Figure 2: Greenland mass balance and its components Surface Mass Balance (SMB) and Discharge (D). Before 1996, D and hence SMB - D, are poorly constrained and therefore not shown.
What caused Surface Mass Balance to fall? There are three components to Surface Mass Balance: precipitation (rain & snow), sublimation and runoff (primarily ice melting with the water running off into the ocean). Figure 3 shows the trends for each component along with the resultant Surface Mass Balance in blue. Again, note that while run-off (orange) is displayed as a strongly positive trend, this actually removes ice mass. On the other hand, precipitation adds ice mass through rain and snow. Between 1996 and 2004, runoff and precipitation anomalies both increase simultaneously, roughly cancelling each other out so that Surface Mass Balance remains relatively steady. After 2004, precipitation levels out while runoff remains high. This caused Surface Mass Balance to fall sharply.
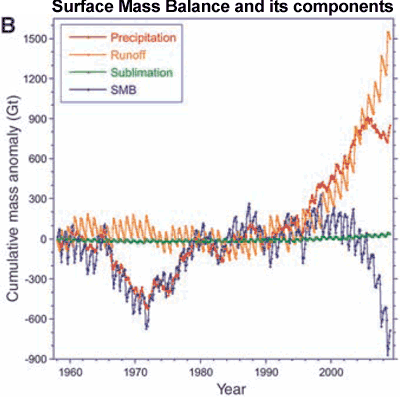
Figure 3: Surface Mass Balance (blue) and its components precipitation (red), runoff (orange) and sublimation (green).
So Surface Mass Balance reconstructions tell us that the acceleration of Greenland ice mass loss is largely due to increased ice discharge and increased run-off. In other words, glaciers are moving faster into the ocean and more ice is melting. Currently, Greenland ice loss is contributing 0.74 mm of sea level rise per year. This is around 23% of the total sea level rise (3.1 mm per year).
Thanks to Ernst Schrama (co-author of the paper), John Cross, Chip Fletcher and chris who all let me know about this paper within a few hours of each other. Obviously I was meant to write a post about this paper!


Agreed re RSVP's comment - I would've deleted it due to the unconstructive tone but there were several interesting comments posted in response which I didn't want to waste (John Cross went to so much effort with his sums) :-)
The amount of energy that goes into ice melt is fairly small compared to the amount of energy being absorbed by the oceans. In the figure below, all the energy gone into ice melt is included in the red "Land + Atmosphere" segment:
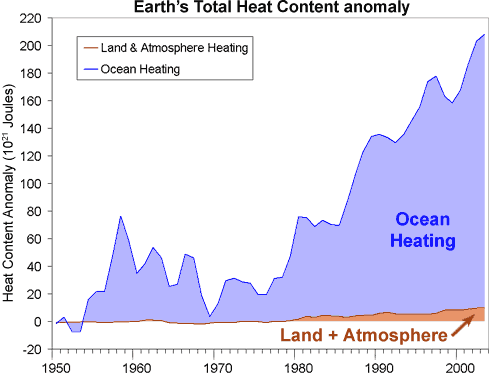
Note that the oceans are still absorbing massive amounts of energy even during recent years when surface temperatures have either flattened or shown short term cooling.
The incorrect comment #2 RSVP and responses of John Cross both miss the most overwhelming piece of science regarding this fallacy of melting ice cooling the ocean's well-mixed layer and this is ironic because the piece ignored is the mechanism of Earth's Energy Balance and the massively overwhelming quantity of the Sun's input and Earth's cooling output to all other energy sources and sinks in the ecosphere, the very essence of "global warming" that this site and discussion everywhere is all about. The details (but unquantified) in this case are:
1) Ice melts and, lets say, spreads over a surface ocean layer of several hundred thousand square kilometres that is colder than it would have been had the ice not melted onto and into it.
2) So now (Stefan Boltzmann t**4 and all that) that ocean layer transmits less LWR up than it would have been had the ice not melted onto and into it. I should think less evaporation and sensible also.
3) None of this affects the solar radiation input so the ice melting and this spreading over a much vaster area than if it had stayed as ice mostly hidden from the Sun by other ice above simply increases Earth's energy imbalance at TOA over that ocean area. The sun warms that colder water back to whatever average temperature was the balanced average temperature for that region, as though ice had not melted and ocean surface not cooled.
To put it simply, melting the ice simply spreads it out thinly over an enormous area and makes it vulnerable to the overpowering energy of the Sun, no sustained cooling occurs. That concept is a fallacy. First point of quantification is how long it takes Sun to warm 12 months of ice loss back to the prior ocean surface temperature. Obviously, if it takes the Sun 10 years, or even 2 years, to warm 12 months of ice loss back to the prior ocean surface temperature then I am incorrect and there is sustained cooling. However, I did a quick calculation a few months ago by spreading the annual Greenland ice loss over that famous Cold Blob (rather arbitrary I know) and found that it takes Sun 7 months to warm 12 months of ice loss back to the prior ocean surface temperature. Therefore there cannot be any cooling of the ocean's well-mixed layer by melting of ice at a rate less than about double the present rate. It isn't just a matter of the cooling being a tiny portion of OHC +ve anomaly, the cooling is not happening at all.
Second point of quantification is how deep the ice melt mixes. I didn't mix it at all and I only computed it for whatever depth (175 mm) matches 350 Gt / yr ice loss ans a 2,000,000 km**2 spreading area, which gives 175 mm depth of non-mixed ice water. I can see that mixing to various depths would slow the rate at which Sun re-heats it but I didn't do a selection of semple computations. Somebody might want to do that some time.
If the melt water from ice plummeted down into the thermocline in the North Atlantic where temperature is >0 degrees then I can see it cooling the ocean but I seriously doubt that fresh water does that.