Climate Science Glossary

Term Lookup

Enter a term in the search box to find its definition.

Settings

Use the controls in the far right panel to increase or decrease the number of terms automatically displayed (or to completely turn that feature off).

Term Lookup

Settings


All IPCC definitions taken from Climate Change 2007: The Physical Science Basis. Working Group I Contribution to the Fourth Assessment Report of the Intergovernmental Panel on Climate Change, Annex I, Glossary, pp. 941-954. Cambridge University Press.

Home Arguments Software Resources Comments The Consensus Project Translations About Support

Twitter Facebook YouTube Mastodon MeWe

RSS Posts RSS Comments Email Subscribe


Climate's changed before
It's the sun
It's not bad
There is no consensus
It's cooling
Models are unreliable
Temp record is unreliable
Animals and plants can adapt
It hasn't warmed since 1998
Antarctica is gaining ice
View All Arguments...


Username
Password
New? Register here
Forgot your password?

Latest Posts

Archives

A Positive Outlook For Clouds

Posted on 29 December 2010 by dana1981

The effect of clouds in a warming world is a difficult one to predict.  One challenge is that clouds have both warming and cooling effects.  Low-level clouds in particular tend to cause a cooling effect by reflecting sunlight, while high-level clouds tend to cause a warming effect by trapping heat.


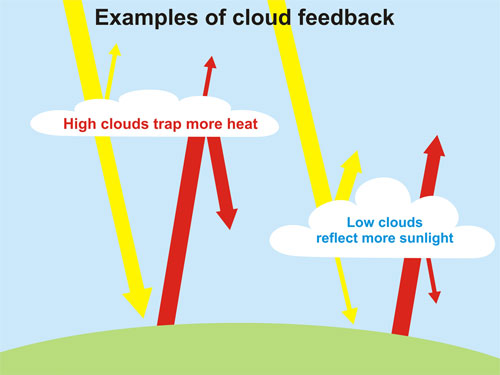
So as the planet warms, clouds can have a cooling effect if the amount of low-level clouds increases and/or if the amount of high-level clouds decreases.  Clouds will have a warming effect if the opposite is true.  Thus it becomes complicated to figure out the overall effect of clouds, because scientists need to determine not only if the amount of clouds increases or decreases in a warming world, but which types of clouds are increasing or decreasing. 

For climate scientists who are skeptical that anthropogenic greenhouse gas emissions will cause a dangerous amount of warming, such as Richard Lindzen and Roy Spencer, their skepticism hinges mainly on this cloud cover uncertainty.  They tend to believe that as the planet warms, low-level cloud cover will increase, thus increasing the overall reflectiveness of the Earth, offsetting the increased greenhouse effect and preventing a dangerous level of global warming from occurring.  However, some recent scientific studies have contradicted this theory.

Most of the cloud feedback uncertainty is due to cloud changes near the equator, in the tropics and subtropics (Stowasser et al. 2006).  Studies by Lauer et al. (2010) and Clement et al. (2009) both looked at cloud changes in these regions in the east Pacific, and both concluded that based on a combination of ship-based cloud observations, satellite observations, and climate models, the cloud feedback in this region appears to be positive, meaning more warming.

Dessler (2010) used cloud measurements over the entire planet by the Clouds and the Earth’s Radiant Energy System (CERES) satellite instruments from March 2000 to February 2010 to attempt to determine the cloud feedback.  Dessler concluded that although a very small negative feedback (cooling) could not be ruled out, the overall short-term global cloud feedback is probably positive (warming), and may be strongly positive.  His measurements showed that it is very unlikely that the cloud feedback will cause enough cooling to offset a significant amount of human-caused global warming.

So while clouds remain a significant uncertainty and more research is needed on this subject, the evidence is building that clouds will probably cause the planet to warm even further, and are very unlikely to offset a significant amount of human-caused global warming.  It's also important to remember that there many other feedbacks besides clouds, and there is a large amount of evidence that the net feedback is positive and will amplify global warming.

This post is the Basic rebuttal (written by Dana Nuccitelli [dana1981]) of the skeptic argument "Clouds Provide Negative Feedback". There is also an Intermediate version which is based on the recent blog posts 'A Cloudy Outlook for Low Climate Sensitivity' and 'An Even Cloudier Outlook for Low Climate Sensitivity'.

0 0

Printable Version  |  Link to this page

Comments

Comments 1 to 40:

  1. If we speculate that there will be more clouds around as a feedback to CO2 induced warming, there will also be more water vapour around (needed to form them). Leaving aside the reflectivity due to the clouds, there will be plenty more water vapour (uncondensed) in the areas between and under the clouds. I am probably showing the limits of my knowledge here, but, as water vapour is a more powerful greenhouse gas than CO2, have Lindzen et al taken into account that whilst his hypothesized "Iris" like effect is reducing the radiative forcing, the increased water vapour necessary to generate the extra "Iris" clouds will be increasing the forcing right back up again? How sure is Prof. Lindzen which effect will dominate? Anyone?
    0 0
  2. Nick - water vapor is a significantly less powerful greenhouse gas than CO2. It's just more prevalent in the Earth's atmosphere, thus it accounts for more of the greenhouse effect. Atmospheric water vapor will indeed increase as the planet warms - there's really no question about that. 'Skeptics' like Lindzen simply postulate that the negative cloud feedback will be so strong as to overwhelm both the CO2 forcing and all positive feedbacks, including water vapor. I can't speak for how sure Lindzen is, but I think the evidence clearly shows that we would be unwise to put our eggs in the 'cloud feedbacks will save us' basket.
    0 0
  3. Dana, thanks for the post. That figure says roughtly the same thing I've seen on Dr. Archer's lectures (recommended, btw). But I have also heard otherwise, and Nasa's figure on your link has arrows with different proportions. Are these rough behaviours still subject of considerable uncertainty? Or can it already be said for sure that high clouds mainly retain heat whereas low clouds mainly reflect sunlight?
    0 0
  4. Thanks for this summary on clouds effects on AGW.
    0 0
  5. Two radiative components involved are long wave and short wave. The long wave component depends on cloud top temperature compared to the surface temperature ("heat trapping" is more just the suppression of radiational cooling). Add the two components and get the net: negative (cooling) or positive (warming). More on that in 12.2 here https://rams.atmos.colostate.edu/AT712/proofs/ch12PostProofing.pdf The doc above says the global average is currently net negative and has a discussion of how that might change mainly as a result of how circulations like the Hadley might change.
    0 0
  6. Eric (skeptic): Yes, but that is cloud radiative forcing, not feedback. It is unlikely that the sign of NCRF will change (if it does = absolute disaster)
    0 0
  7. This is a question. Would it be reasonable to suppose that a warmer atmosphere might have stronger convective forces, therefore cloud formation would shift to slightly higher altitudes overall? I’d appreciate your thoughts on this.
    0 0
  8. rocco, yes, I didn't mean to imply a negative feedback, just a currently negative forcing. The change in that forcing in response to the AGW warming will be the feedback (that is what the paper is trying to figure out). The NRCF does go positive locally and often goes positive at night in large areas of the planet. It could easily go globally-averaged positive for short periods without disaster. The net forcing returns to negative with normal cloud processes that won't be any different in an AGW-warmed world (processes won't change, but frequency, geography, etc will change) Also that forcing is somewhat balanced against latent heat transfer, another reason why positive is not a disaster.
    0 0
  9. #7: Soundoff - I believe this has been calculated by Wolfendale, Sloan & Erlykin but I can't remember where they published this (Prof. Wolfendale told me in person, I can't remember the link) They work on cosmic rays & clouds and there is a negative correlation between cosmic rays and low clouds and a positive one between cosmic rays and medium clouds. Pro cosmic-rays scientists say it's because of cosmic rays, Wolfendale/Sloan/Erlykin found that clouds mostly change before cosmic rays and that much of it could be explained by solar warming raising the clouds (so that some 'low' clouds are now counted as 'medium', hence the correlation). Of course, this is a transient effect and I'm not sure what the overall global, secular effect would be expected to be.
    0 0
  10. #1 Palmer: climate models are unanimous on a positive water vapour feedback (but this also increases the negative lapse rate feedback*), and combined water vapour/albedo bring total global warming to 2-3 C for a doubling of CO2. Dessler, 2008 finds good observational evidence for positive water vapour feedback too... But clouds can have a very, very big effect and, in principle, sufficient to cancel out the water vapour effect. The numbers do appear to 'add up' but models generally disagree and observations can't seem to find it either (discounting Lindzen & Choi which was successfully eviscerated by Trenberth et al IMO) *by increasing the radiative heating on the surface, you encourage more evaporation. Earth no longer has to transfer all of its heat back up radiatively (which is related to temperature through Stefan Boltzmann), but instead more of it goes as latent heat of water which doesn't have an associated temperature change at the surface.
    0 0
  11. It doesn't take much of an analysis to show that clouds cannot have a very strong negative feedback. If so, the feedback would have damped out the glacial cycles. Growth to maximum ice sheet size only made about a 20% change in albedo of the earth, holding clouds constant. If there were a strong negative feedback, clouds could easily have compensated.
    0 0
  12. #10: " ...latent heat of water which doesn't have an associated temperature change at the surface." I don't understand that mechanism. Evaporation from a surface cools the surface. As that vapor rises it will condense, losing its latent heat to the surrounding atmosphere. Whether or not the resulting clouds live long enough to produce precipitation back to surface is highly variable. As would be the so-called negative feedback due to the albedo of said clouds. Is it therefore correct to say no 'associated temperature change' or just 'no equivalent radiative (SB) temperature'?
    0 0
  13. An idea of what to expect from clouds during glacial periods might be gleaned from their current behavior over Greenland and Antarctica, see http://www.phys.uu.nl/~broeke/home_files/MB_pubs_pdf/1996_Bintanja_IJC.pdf They point out that increasing clouds in general means long wave outgoing dominates and NRCF is negative. Their study showed that an increase in clouds cooled in a location on the Antarctic peninsula and interior Greenland, but warmed in two other Antarctic locations. To me this study suggests that warming and cooling feedback is very nonlinear and could change the sign of the cloud forcing, so glacial periods could initially have more net cooling from clouds followed by net warming as cloud amount decrease drastically with full ice and snow cover.
    0 0
  14. Eric (skeptic) the paper considers only the summer energy budget. In winter, clouds of any type can just trap heat, no sunlight to reflect back to space.
    0 0
  15. Supposing that Lindzen is correct and the low level cloud cover eventually is sufficient to limit the increase in global warming, what are the consequences? If that occurs what will be the additional changes in the global weather. Doesn't the additional cloud cover reduce the sunlight reaching the earth, and will more flooding occur due to increased rainfall. According to NOAA, the temperature anomaly in the Arctic is already +5 degrees Centigrade. This warming in the Arctic has been linked to changes in the Jet Stream and the resulting (selective) cooling of the US and Europe. According to NOAA so far this year, January through November, the combined land and sea temperatures are the highest on record. When the temperature stops increasing how bad will it be?
    0 0
  16. Dana1981 #2 Ahh. Most popular descriptions of the greenhouse effect give the strong impression that the H20 molecule has a stronger greenhouse effect than the CO2 molecule - like CH4 (methane). I don't remember seeing it clarified elsewhere that H20 has, although a weaker greenhouse gas, a bigger effect due to its much greater abundance. The various Wiki articles make this less than clear too.
    0 0
  17. Why don't we just look at the record for signs of forcing? Since the end of the last mini ice age we have warmed about 8ths of a degree.Our carbon dioxide has gone up about 50% the last 150 years so we should be seeing half the warming we would get with a doubling of c02.So I am assuming about an additional 8ths of a degree of warming with a full doubling of our c02.This theory assumes no natural variation in our climate and no tipping points either.Lets just pretend they cancel each other out for the sake of this discussion.Some how 8ths of a degree isn't that scary.
    0 0
  18. @adrian smits: except the temperature has increased by more than 1/8th of a degree, and it has done so in mostly in the last 50 years (not 150). Right now, the increase (about 0.8C) falls right within the 2.5-4.5C climate sensitivity for a doubling of CO2, a fact no denier has been able to disprove (though many have tried).
    0 0
  19. I’m not sure if the following reasoning holds for all periods due to other factors that influence climate at different times, but I thought it would be fun to try with our modern period of warming, 1975 to present, to see if climate sensitivity agrees with expectations. Average annual temperatures have increased 0.69ºC since 1975 per GISTemp (-0.04ºC then versus +0.65ºC now). CO2 was 330 ppm in 1975. It’s 390 ppm today. Plugging those two CO2 levels into the standard CO2 radiation forcing formula ΔRF = 5.35 ln(CO2/CO2_orig) gives a increased forcing of 0.894 W/m² since 1975. Applying a climate sensitivity of 3ºC per doubling of CO2 concentration (or 0.75ºC per W/m²) gives an expected temperature increase of 0.67ºC. That’s amazingly close, I’d say. Close enough that you can certainly be confident of the relationship between CO2 and temperature over the last 36 years given that the other positive and negative feedbacks more-or-less cancel each other out.
    0 0
  20. Quick note - I've added the 'Examples of Cloud Feedback' graphic to the list of high-rez climate graphics.
    0 0
  21. #19 – Errata – Last sentence's qualifier should have been: “... given that the other positive and negative forcings more-or-less cancel each other out.”
    0 0
  22. Soundoff #19 I have a bit of a problem with this unit degC per W/sq.m, which is used to measure climate sensitivity. To raise the temperature of a mass you input energy measured in Joules. eg. the specific heat of dirt, water etc is expressed in Joules/gram or kJ/kG. A Watt is an instantaneous applied power or energy flux and to get energy applied you have to multiply by time. ie. a Joule is a Watt-sec. Soundoff's use of the IPCC log equation to calc forcing 'relative to 1975' gives the instantaneous forcing increase for today (2010) at 0.894W/sq.m. That only applies today and not 5, 10, 15, 20 years ago when the CO2 conc was somewhere between 330 and 390 ppmv. To get a temperature increase of 0.65 degC, the increased energy applied would be an 'average' forcing in W/sq.m multiplied by 36 years. That average forcing would be roughly half the 0.894W/sq.m increase (the ln function is non-linear so the half is not exact). That would give a 0.65 degC increase based on roughly half the forcing increase which doubles the 'climate sensitivity' to roughly 1.5degC per W/sq.m (or 6degC per doubling)to be consistent with Soundoff's sum. Not amazingly close at all. All the other forcings need be taken into account to determine the net forcing imbalance (with S-B cooling and CO2-WV feedbacks playing a vital role)
    0 0
  23. The simplistic calculations of climate sensitivity discussed here need to consider that the ocean causes a significant lag in the observed temperature increase. Other threads on Skeptical Science describe this lag as 40 years and more. Thus the 0.8C that we have already measured is due to the CO2 released decades ago. The increase from the last 40 or 60 ppm of CO2 has not yet been seen. The skeptics need to think about their simplistic arguments that "it isn't that scary" and consider that we have not seen the full warming yet. The skeptic argument has shifted from "it is not warming" to "the warming is not so bad". The scientific position has not changed. Tell the 20 million people who were flooded out of their homes in Pakistan this year that "it isn't that scary" and see what they say.
    0 0
  24. I’ve often seen Gavin at RC state that each W/m² equates to about 0.75ºC increase in temperature. I used his number above although it looks to me when I apply the equations that 0.75ºC per W/m² actually equates to a climate sensitivity of 2.78ºC per doubling of CO2 while 0.81ºC per W/m² gives a climate sensitivity of exactly 3ºC. I’m not sure how he arrived at 0.75ºC instead for 3ºC, I just use it. I’ve never seen averages applied in the way Ken Lambert suggests. See The CO2 Problem in 6 Easy Steps at RC. Also see RC comment # 46 by Chris Colose at Some Examples Worked
    0 0
  25. " it looks to me when I apply the equations that 0.75ºC per W/m² actually equates to a climate sensitivity of 2.78ºC per doubling of CO2" 2.78C comes from GISS Model E, I'm sure (i.e. the model that Gavin works on). I know it's < 3C (but well within the error bars that the 3C best estimate from IPCC comes with).
    0 0
  26. Soundoff #24 "I’ve often seen Gavin at RC state that each W/m² equates to about 0.75ºC increase in temperature." Increase in temperature over what time period? Surely I cannot apply 1.0W/sq.m today and get 0.75degC increase tomorrow. Or do I apply 1.0W/sq.m for 100 years to get a 0.75degC increase? One can only assume that the period is the time required for the Earth system to reach a new equilibrium where there is no forcing imbalance. In such case the S-B cooling (being exponential with T^4) would progressively close the imbalance gap - but with several forcings (cloud albedo, WV & ice albedo feedback etc) which are not as well known theoretically as the claimed CO2GHG forcing then I would not venture a guess as to the time period.
    0 0
  27. The goal of my calculation was to test whether the consensus 3ºC climate sensitivity figure for a doubling of CO2 (~0.75ºC per W/m²) is reasonable. Forcing (E) and Temperature (T) are interrelated (E = εσT^4). Time does not play a part in this relationship at the planetary level. Time is only needed to allow equilibrium to be reached so we can see the new temperature properly reflected in surface measurements. A 36-year period should allow that to happen. If one adds one W/m² of forcing in a single day and sustains that forcing until equilibrium is reached, or one adds the same forcing gradually over a period of 100 years, the end result is the same - the measured temperature of Earth will be ~0.75ºC warmer. The continuous warming that occurs over the much longer period is constantly radiated away into space leaving 0.75ºC for us to measure at the end of that period. The time for which the forcing is applied is not relevant to the calculation. As I stated earlier, other non-CO2 forcings neutralize each other (by chance) so they don't really need to be accounted for separately in my rough calculation, and 0.75ºC per W/m² is assumed to reflect all feedbacks, both positive and negative, well-defined or unknown. It is this assumption that I'm testing against reality. In all likelihood, the period for which I calculated the expected warming of 0.67ºC had/has both 0.5ºC of committed warming in the pipe at the start and end of the period, effectively allowing me to see a clear CO2 effect in surface temperatures without waiting for equilibrium to settle in and reflect what's still in the pipe at the end (i.e. the two cancelled). I'm not saying my calculation is proof of the consensus 3ºC climate sensitivity figure. I'm just showing that applying that figure in the standard forcing calculation gives an expected result that's consistent with the observed result. Had the results been wildly different, then I'd be wondering if our scientific understanding is correct. I'm sure if I tried the same calculation with shorter periods or periods before 1975, the result would not match so well. My explanation for that would be to say that CO2 needs to be the dominant driver of temperatures to see the effect clearly. My understanding is that CO2 has been dominant since 1975.
    0 0
  28. Soundoff #27 If you have not already done so, I suggest you have a look at this paper: http://www.cgd.ucar.edu/cas/Trenberth/trenberth.papers/EnergyDiagnostics09final2.pdf In particular Fig 4 which lists the various forcings and the energy equivalents (E20 Joules/year). "Forcing (E) and Temperature (T) are interrelated (E = εσT^4)." What you have quoted is the S-B Eqan for radiative cooling for a body at absolute Temp T in degK. Not the same thing as a temperature increase of the Earth system between two points in time. "If one adds one W/m² of forcing in a single day and sustains that forcing until equilibrium is reached, or one adds the same forcing gradually over a period of 100 years, the end result is the same - the measured temperature of Earth will be ~0.75ºC warmer." I don't think so. The equilibrium will never be reached if a positive forcing is sustained. As temperature rises S-B radiative cooling (currently a climate response feedback of -2.8W/sq.m as per the above paper) increases with absolute T^4 and the forcing gap closes until it approaches zero - at which time the temperature approaches a new higher equilibrium.
    0 0
  29. michael sweet #23 "Other threads on Skeptical Science describe this lag as 40 years and more. Thus the 0.8C that we have already measured is due to the CO2 released decades ago. The increase from the last 40 or 60 ppm of CO2 has not yet been seen." I have often thought about this 'temperature lag' and it seems to make intuitive sense until one thinks it through with reference to the first law. As the Earth system (atmosphere, land, oceans, ice) absorbs heat energy from the theorized positive forcing imbalance it either performs phase changes (melts ice or vaporises water) or warms land and water. My understanding is that up to 90% goes into the oceans because the other sinks have little storage capacity and ice melt is a tiny portion of the total energy absorbed. The energy absorbed in the oceans must be obviously taken from the atmosphere and direct radiation via a temp increase in the top layers. Conduction and convection and complex mixing in the oceans will distribute heat and there will be a lag in the spatial distribution of temperature rise, but this process is moving around energy already absorbed in the system. There is no pipeline of energy from 40 years ago which is just arriving now. Your comment: "Thus the 0.8C that we have already measured is due to the CO2 released decades ago. The increase from the last 40 or 60 ppm of CO2 has not yet been seen" - cannot be true if the CO2GHG forcing is continually (in real time) adding energy to the system, because the bulk of that energy can only be stored by temperature rise of real mass mainly in oceans.
    0 0
    Moderator Response: [muoncounter] The appropriate thread for discussion of the 40 year lag is The 40 year delay between cause and effect.
  30. Ken Lambert #28, "The equilibrium will never be reached if a positive forcing is sustained." --- As long as no increase in forcing occurs (it is only sustained), equilibrium will reached. This is the very basis of equilibrium. I'm very familiar with Trenberth's figure 4. It's the reason I stated other non-CO2 forcings neutralize each other. We'll just disagree on the "two points in time" issue you’ve raised, as it's not clear to me why this is even a pertinent issue. If two point-in-time temperatures are not a function of any time lapse, only of the forcing, the temperature increase is simply the difference between the two point-in-time temperatures regardless of the time lapse between the two points. Adding in a time lapse is only useful to see the rate of temperature increase. Perhaps I’m misunderstanding your issue.
    0 0
  31. Soundoff #30 Let me illustrate by example. Dr Trenberth's 0.9W/sq.m positive forcing imbalance equates to 145E20 Joules/year added to the Earth system. The 0.9 is made up of the sums of all the forcings in Fig 4 including the climate responses at the bottom of that table. If the 0.9W/sq.m is sustained we will add 145E20 Joules every year to the system and this energy will melt ice, warm land & oceans at a roughly steady rate of 'X' degC per year/decade etc. Under this constant positive forcing the system will not appproach an equilibrium. The positive forcing has to reduce to reduce energy takeup in order to slow down warming and approach a new equilibrium at a higher general temperature. The +0.9W/sq.m could be reduced by higher cooling forcings (cloud albedo, S-B), or lower positive forcings (CO2GHG, WV + Ice albedo feedback). We could discuss cloud albedo as having wide error bars, and WV + Ice albedo feedback (currently listed in Fig 4 at about +2.1W/sq.m), but the prime cooling feedback is S-B cooling (currently at -2.8W/sq.m) which will increase at T^4 as the Earth's radiating temperature rises. Whichever way you cut it, the +0.9W/sq.m has to approach zero in order for the Earth system to slow down warming and approach a new higher equilibrium temperature.
    0 0
  32. Constant forcing is an oxymoron, unless the input changes at the same rate as equilibrium is approached. A constant energy input results in a decreasing forcing until equilibrium is reached when energy output reaches that level.
    0 0
  33. Bibliovermis #32 I think you are confusing the totals with the differences. If the total energy flux entering the biosphere is 240.9W/sq.m and the total leaving is 240W/sq.m then the Forcing is positive (+0.9W/sq.m). Temperatures will rise in response to the +0.9W/sq.m over time. 'Forcing' is usually the nomenclature applied to this difference. For a new equilibirum temperature to be reached the outgoing energy flux has to rise to 240.9W/sq.m - hence the 'Forcing' is reduced to zero. The biosphere ceases to gain more energy than it loses.
    0 0
  34. Ken Lambert #31, I don’t disagree with what you’ve said. I just don’t see its relevance. If one adds a continuous forcing, the climate system does reach equilibrium with that specific forcing. If one adds more forcing on top of the earlier one while the system is still adjusting to the earlier forcing and one keeps doing this, the system will never reach full equilibrium. This is true but it has incorporated the earlier forcings at some point by getting warmer in small steps. Equilibrium with a specific forcing is what’s relevant to observing the results of the standard CO2 radiation forcing formula. This is becoming way too complicated for most readers who are not climate scientists, including me. I will leave further discussion for the scientists.
    0 0
  35. As for the work of A. Dessler, based mainly on models - I remind comment R. Spencer from 09.12.10 and 31.12.2010. (e-mail exchange between A.D. and R.S.), and A. Dessler – RealCimate (09.12.10). For me, it is important - here - the sentence of R. S.: “What we demonstrated in our JGR paper earlier this year is that when cloud changes cause temperature changes, it gives the illusion of positive cloud feedback – even if strongly negative cloud feedback is really operating!” By R.S. drop area of low clouds, which results in increase in the share of high clouds - stopping LV (alleged positive feedback described by AD) - "was the first" - is the reason for the current increase temperatures. “Low-cloud feedback has a strong amplifying impact on the tropical ITCZ shift in this model, whereas the effects of high-cloud feedback are weaker.” - this result was obtained when tested AMOC (Sensitivity of Climate Change Induced by the Weakening of the Atlantic Meridional Overturning Circulation to Cloud Feedback, Zhang, Kang and Held, 2009.), which weakens in warm periods. Negative opinion of low clouds can be up to 4 times higher than assumed in the models, which used the A.D.: Is There a Missing Low Cloud Feedback in Current Climate Models? Stephens, 2010.: “The consequence is that this bias artificially suppresses the low cloud optical depth feedback in models by almost a factor of four and thus its potential role as a negative feedback. This bias explains why the optical depth feedback is practically negligible in most global models (e.g., Colman et al., 2003) and why it has received scant attention in low cloud feedback discussion.” I also think that the changes in low clouds (decrease) precede warming - and I have a "strong" evidence. What could be the reason? Svensmark's theory is according to the latest data for only a few percent of cloud cover (eg: Kulmala et al., 2010.). However, note that after the explosions of volcanoes (El Chichon in 1982 and especially Mt. Pinatubo 1991) observed a significant decrease in regional and global NPP, which is difficult to explain short-term (1-3 years) cooled. NPP only now reached the level prior to 1992 (Mt. Pinatubo). Here you can see that ozone levels are lowest circa 1992-1999 ( graph second from the top - on the second slide). The reaction is a bit low clouds shifted over time: Decreasing cloud cover - now slightly increases - such as ozone. This paper: Factors affecting arctic ozone variability in the Arctic, Weatherhead et al., 2010., shows why the fall of ozone in the atmosphere - especially topic of water vapor in the stratosphere is interesting (delaying the restoration of ozone). In the tropics, ozone (rzem the sun) strongly influences the clouds: Amplifying the Pacific Climate System Response to a Small 11-Year Solar Cycle Forcing, Mheel et al., 2009.: “One of the mysteries regarding Earth's climate system response to variations in solar output is how the relatively small fluctuations of the 11-year solar cycle can produce the magnitude of the observed climate signals in the tropical Pacific associated with such solar variability.” “Two mechanisms, the top-down stratospheric response of ozone to fluctuations of shortwave solar forcing and the bottom-up coupled ocean-atmosphere surface response, are included in versions of three global climate models, with either mechanism acting alone or both acting together.” “... during peaks in the 11-year solar cycle ... ...reduce low-latitude clouds to amplify the solar forcing at the surface.” Let's go back to NPP - phytoplankton - effects of ozone and ENSO (please note here, however, with regard to this work: Lack of correlation between chlorophyll a and cloud droplet effective radius in shallow marine clouds, Miller and Yuter, 2007. - “The interactions among aerosols, cloud properties, boundary layer dynamics, surface processes, and radiative effects are complex and can be non-monotonic ...”). : “The regions with higher DMS emissions show an increase in CDNC, a decrease in cloud effective radius and an increase in cloud cover.” “We estimate a maximum decrease of up to 15–18% in the droplet radius and a mean increase in cloud cover by around 2.5% over the southern oceans during SH summer in the simulation with ocean DMS compared to when the DMS emissions are switched off. The global annual mean top of the atmosphere DMS aerosol all sky radiative forcing is −2.03 W/m2, whereas, over the southern oceans during SH summer, the mean DMS aerosol radiative forcing reaches −9.32 W/m2.” Quantification of the Feedback between Phytoplankton and ENSO in the Community Climate System Model, Jochum et al, 2010. - shows that both the ENSO influence on phytoplankton, and phytoplankton affect ENSO. Production and Emissions of Marine Isoprene and Monoterpenes: A Review, Shaw, Gantt, and Meskhidze, 2010. - This review shows that according to numerous works, the impact of aerosols originating from the biosphere (including phytoplankton) can be decisive for the low clouds - and: Global phytoplankton decline over the past century, Boyce et al., 2010.. The first important work that indicates that ozone may have a significant impact on phytoplankton (DMS as a consequence of aerosol - a cloud low) was: Ozone depletion may leave a hole in phytoplankton growth, Andrew Davidson, Kelvin Michael, Manuel Nunez, Simon Wotherspoon and Ben Raymond, 2006. – with relation to this work: - we read: “New research suggests that the growth of phytoplankton is reduced by 56% when stratospheric ozone drops below 17% or less than 300 Dobson Units (DU).” But in another relation: Ozone hole alters Antarctic sea life, Emma Young, 2006., , is sentence: „However, Kevin Arrigo at Stanford University, California, says that on average, chlorophyll concentrations in Antarctic waters under the ozone hole have not changed since the late 1970s, when stratospheric ozone was much higher than today.” K. Arrigo also has estimated that: Primary production in the Southern Ocean, 1997-2006, Arrigo, van Dijken, and Bushinsky, 2008. - “Unlike the Arctic Ocean, there was no secular trend in either sea ice cover or annual primary production in the Southern Ocean during our 9-year study.” For 1997 - 2006 agreement. However, for the years 1987 - 2004, it was found that: Stratospheric ozone depletion reduces ocean carbon uptake and enhances ocean acidification, Lenton et al., 2009. - “We find that Southern Ocean uptake is reduced by 2.47 PgC (1987–2004) and is consistent with atmospheric inversion studies.” UVR indisputable impact on the primary production in Antarctic waters this work states: Temporal changes in effects of ambient UV radiation on natural communities of Antarctic marine protists, Thomson, Davidson, and Cadman, 2008.: “This recurrent decline in ozone over Antarctica between January and April coincides with blooms of diatoms that appear to have low UV-B tolerance but are responsible for ~47% of annual primary production in Antarctic waters.” And this paper: Ozone depletion: ultraviolet radiation and phytoplankton biology in antarctic waters, Smith et al., 2009. - “A minimum 6 to 12 percent reduction in primary production associated with O3 depletion was estimated for the duration of the cruise.” - It is noteworthy that in this figure, however, changes in chlorophyll usually precede changes in temperature. Figure adapted from: Satellite-detected fluorescence reveals global physiology of ocean phytoplankton, Behrenfeld et al., 2009.
    0 0
  36. “The effect of clouds in a warming world is a difficult one to predict. One challenge is that clouds have both warming and cooling effects. Low-level clouds in particular tend to cause a cooling effect by reflecting sunlight, while high-level clouds tend to cause a warming effect by trapping heat.” Nought out of ten – see me. Heat is not a substance, it is not caloric, it cannot be trapped or stored. Energy can be stored but it is not heat. Whether or not any part of stored energy can do anything – produce work or raise temperature – depends on its surroundings. Heat is the transfer of energy between a higher and a lower temperature. It is, by definition, uni-directional. The way you present thermodynamics in this thread simplifies the first law and ignores the second. It suggests to the non-scientist (journalist, politician or lay reader) that the more energy absorbent material we add to the atmosphere, the higher will be its temperature because the “heat” cannot escape to space. Angstrom demonstrated 100 years ago that this is not the case.
    0 0
    Moderator Response: [muoncounter] See Second Law of thermodynamics for a thorough discussion of this question. Hopefully, we don't have to reinvent this wheel.
  37. Excuse me, I format the wrong one link: Quantification of DMS aerosol-cloud-climate interactions using ECHAM5-HAMMOZ model in current climate scenario, Thomas et al., 2010.: “The regions with higher DMS ...
    0 0
  38. "See Second Law of thermodynamics for a thorough discussion of this question. Hopefully, we don't have to reinvent this wheel." Staples might also want to visit Science of Doom, which has dissected the bogus second law arguments in excruciating detail.
    0 0
  39. Global warming due to increasing absorbed solar radiation, Trenberth and Fasullo, 2009.: “While there is a large increase in the greenhouse effect from increasing greenhouse gases and water vapor (as a feedback), this is offset to a large degree by a decreasing greenhouse effect from reducing cloud cover and increasing radiative emissions from higher temperatures. Instead the main warming from an energy budget standpoint comes from increases in absorbed solar radiation that stem directly from the decreasing cloud amounts.” “Sake of completeness.” Low clouds (especially in high latitudes) may also have a positive RF - Observational and Model Evidence for Positive Low-Level Cloud Feedback, Clement, and Burgman, 2010., (cited in paper A.D.) with these caveats: Comment on “Observational and Model Evidence for Positive Low-Level Cloud Feedback”, Broccoli and Klein, 2010. : „... using more complete model output, indicates better agreement with observations, suggesting that more detailed analysis of climate model simulations is necessary.” Another problem is that aerosols and clouds: Europe. Decline of fog, mist and haze in Europe over the past 30, Vautard , Yiou & van Oldenborgh, 2009.: “These variations presumably result from changes in aerosol burden and clouds ...” “Over Europe, the marked solar radiation increase since the 1980s is thought to have contributed to the observed large continental warming ...”, “This decline is spatially and temporally correlated with trends in sulphur dioxide emissions, suggesting a significant contribution of air-quality improvements.” “Statistically linking local visibility changes with temperature variations, we estimate that the reduction in low-visibility conditions could have contributed on average to about 10–20 % of Europe's recent daytime warming and to about 50 % of eastern European warming.” Years of 80th, however, the volcanic eruption of El Chichon. Globally, however, there is no simple correlation between aerosols and clouds - Consistency of global satellite-derived aerosol and cloud data sets with recent brightening observations., Cermak et al., 2010.: “In a period from the mid-1980s to the mid-2000s, aerosol optical depth is found to have started declining in the early 1990s [Mt. Pinatubo], while cloud data sets do not agree on trends.” Because not everyone aerosol increases the amount of clouds (as well as DSM). Can aerosol decrease cloud lifetime?, Small et al., 2009.: “... (ii) the “lifetime effect” whereby anthropogenic aerosol suppresses precipitation and results in clouds with more liquid water, higher fractional cloudiness, and longer lifetimes. Based on new observations presented here, and supported by previous fine-scale modeling studies, we suggest that the balance of evidence shows that non-precipitating cumulus clouds can experience an evaporation-entrainment feedback, and respond to aerosol perturbations in a manner inconsistent with the traditional “lifetime effect.” This is confirmed by other regional examples: Significant decadal brightening of downwelling shortwave in the continental United States, Long et al., 2009.: “We show that widespread brightening has occurred over the continental United States as represented by these measurements over the 12 years of the study, averaging about 8 W m −2 /decade for the all‐sky shortwave and 5 W m −2 /decade for the clear‐sky shortwave. This all‐sky increase is substantially greater than the 2 W m −2 /decade previously reported over much more of the globe as represented by data from the Global Energy Balance Archive spanning 1986–2000 and is more than twice the magnitude of the corresponding 1986–2000 2–3 W m −2 /decade increase in downwelling longwave.” Global Brightening over the Continental US, NASA, 2008.: “Brightening is commonly attributed to decreasing aerosol optical depth. However, these new results show that reductions in dry aerosols and/or direct aerosol effects alone cannot explain even half of the brightening. Changes in cloudiness play the dominant role. And the subtropics: Subtropical Low Cloud Response to a Warmer Climate in an Superparameterized Climate Model, Wyant, Bretherton and Blossey, 2009.: “Intriguingly, SP-CAM shows substantial low cloud increases over the subtropical oceans in the warmer climate.” Regional changes in cloud cover (such as the above) can be ignored by global models - and can affect (is significant) on the balance of RF cloudiness.
    0 0
  40. Thanks Dana - very effective use of diagram.
    0 0

You need to be logged in to post a comment. Login via the left margin or if you're new, register here.


The Consensus Project Website

THE ESCALATOR

(free to republish)


© Copyright 2024 John Cook
Home | Translations | About Us | Privacy | Contact Us