Climate Science Glossary

Term Lookup

Enter a term in the search box to find its definition.

Settings

Use the controls in the far right panel to increase or decrease the number of terms automatically displayed (or to completely turn that feature off).

Term Lookup

Settings


All IPCC definitions taken from Climate Change 2007: The Physical Science Basis. Working Group I Contribution to the Fourth Assessment Report of the Intergovernmental Panel on Climate Change, Annex I, Glossary, pp. 941-954. Cambridge University Press.

Home Arguments Software Resources Comments The Consensus Project Translations About Support

Bluesky Facebook LinkedIn Mastodon MeWe

Twitter YouTube RSS Posts RSS Comments Email Subscribe


Climate's changed before
It's the sun
It's not bad
There is no consensus
It's cooling
Models are unreliable
Temp record is unreliable
Animals and plants can adapt
It hasn't warmed since 1998
Antarctica is gaining ice
View All Arguments...


Username
Password
New? Register here
Forgot your password?

Latest Posts

Archives

Do volcanoes emit more CO2 than humans?

What the science says...

Select a level... Basic Intermediate

Humans emit 100 times more CO2 than volcanoes.

Climate Myth...

Volcanoes emit more CO2 than humans

"Human additions of CO2 to the atmosphere must be taken into perspective.

Over the past 250 years, humans have added just one part of CO2 in 10,000 to the atmosphere. One volcanic cough can do this in a day." (Ian Plimer)

At a glance

The false claim that volcanoes emit more CO2 than humans keeps resurfacing every so often. This is despite debunkings from bodies like the United States Geological Survey (USGS). Such claims may be easy to make, but they fall apart once a little scientific scrutiny is applied. So, to settle this once and for all, let's venture out into the fascinating world of geology, plate tectonics and volcanism.

According to the USGS, there are 1,350 active volcanoes on Earth at the moment. An active volcano is one that can erupt, even if it's decades since it last did so. As of June 2023, 48 volcanoes were in continuous eruption, meaning activity occurs every few weeks. Out of those, around 20 will be erupting on any particular day. Several of those will have erupted by the time you have finished reading this.

People are familiar with a typical volcano, an elevated area with one or more craters or fissures from which lava periodically erupts. But there are also the submarine volcanoes such as those along the mid-oceanic ridges. These vast undersea mountain ranges are a key component of Earth's Plate Tectonics system. The basalts they continually erupt solidify into the oceanic crust making up the flooring of the deep oceans. Oceanic crust is constantly moving away from any mid-ocean ridge in the process known as 'sea-floor spreading'.

Oceanic crust is chemically reactive. It reacts with seawater, allowing the formation of huge quantities of minerals including those carrying carbon in the form of carbonate. But oceanic crust is geologically young. That is because it is also being consumed at subduction zones - the deep ocean 'trenches' where it is forced down into Earth's mantle.

When oceanic crust is forced down into the mantle at subduction zones, it heats up and begins to melt into magma. Carbonate minerals in that crust lose their carbon - it is literally cooked out of them. Magmas then transport the CO2 and other gases up through Earth's crust and if they reach the surface, volcanic eruptions occur and the CO2 and other gases leave the magma for the atmosphere.

So here you can see a long-term cycle in which carbon gets trapped in the sea-floor, subducted into the mantle, liberated into new magma and erupted again. It's a key part of Earth's Slow Carbon Cycle.

Volcanoes are also dangerous. That's why we have studied them for centuries. We have hundreds of years of observations of all sorts of eruptions, at Earth's surface and beneath the oceans. Those observations include millions of geochemical analyses of both lavas and gases.

Because of all of that data collected over so many years, we have a very good idea of the amount of CO2 released to the atmosphere by volcanic activity. According to the USGS, it is between 180 and 440 million tons a year.

In 2019, according to the IPCC's Sixth Assessment Report (2022), human CO2 emissions were:

44.25 thousand million tons.

That's at least a hundred times the amount emitted by volcanoes. Case dismissed.

Please use this form to provide feedback about this new "At a glance" section. Read a more technical version below or dig deeper via the tabs above!


Further details

Beneath the surface of the Earth, in the various rocks making up the crust and the mantle, is a huge quantity of carbon, far more than is present in the atmosphere or oceans. As well as fossil fuels (those still left in the ground) and limestones (made of calcium carbonate), there are many other compounds of carbon in combination with other chemical elements, making up a range of minerals. According to the respected mineralogy reference website mindat, there are 258 different valid carbonate minerals alone!

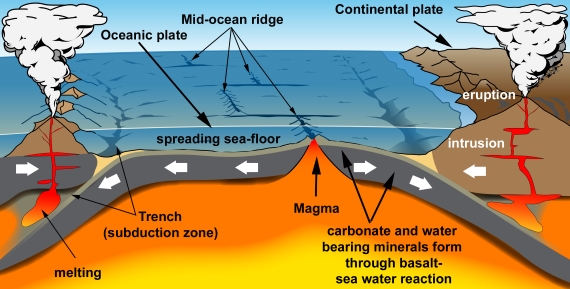
Some of this carbon is released in the form of carbon dioxide, through vents at volcanoes and hot springs. Volcanic emissions are an important part of the global Slow Carbon Cycle, involving the movement of carbon from rocks to the atmosphere and back on geological timescales. In this part of the Slow Carbon Cycle (fig. 1), carbonate minerals such as calcite form through the chemical reaction of sea water with the basalt making up oceanic crust. Almost all oceanic crust ends up getting subducted, whereupon it starts to melt deep in the heat of the mantle. Hydrous minerals lose their water which acts as a flux in the melting process. Carbonates get their carbon driven off by the heating. The result is copious amounts of volatile-rich magma.

Magma is buoyant relative to the dense rocks deep inside the Earth. It rises up into the crust and heads towards the surface. Some magma is trapped underground where it slowly cools and solidifies to form intrusions. Some magma reaches the surface to be erupted from volcanoes. Thus a significant amount of carbon is transferred from ocean water to ocean floor, then to the mantle, then to magma and finally to the atmosphere through volcanic degassing.

 Plate tectonics in cartoon form

Fig. 1: An endless cycle of carbon entrapment and release: plate tectonics in cartoon form. Graphic: jg.

Estimates of the amount of CO2 emitted by volcanic activity vary but are all in the low hundreds of millions of tons per annum. That's a fraction of human emissions (Fischer & Aiuppa 2020 and references therein; open access). There have been counter-claims that volcanoes, especially submarine volcanoes, produce vastly greater amounts of CO2 than these estimates. But they are not supported by any papers published by the scientists who study the subject. The USGS and other organisations have debunked such claims repeatedly, for example here and here. To continue to make the claims is tiresome.

The burning of fossil fuels and changes in land use results in the emission into the atmosphere of approximately 44.25 billion tonnes of carbon dioxide per year worldwide (2019 figures, taken from IPCC AR6, WG III Technical Summary 2022). Human emissions numbers are in the region of two orders of magnitude greater than estimated volcanic CO2 fluxes.

Our knowledge of volcanic CO2 discharges would have to be shown to be very mistaken before volcanic CO2 discharges could be considered anything but a bit player in the current picture. They have done nothing to contribute to the recent changes observed in the concentration of CO2 in the Earth's atmosphere. In the Slow Carbon cycle, volcanic outgassing is only part of the picture. There are also the ways in which CO2 is removed from the atmosphere and oceans. If fossil fuel burning was not happening, the Slow Carbon Cycle would be in balance. Instead we've chucked a great big wrench into its gears.

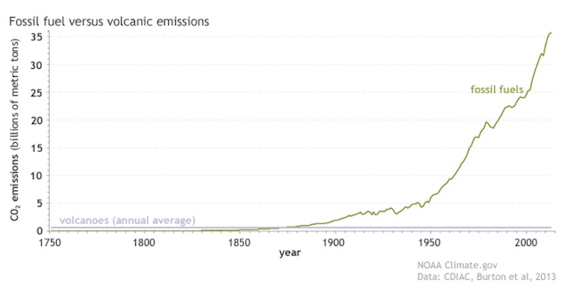
Some people like classic graphs, others prefer alternative ways of illustrating a point. Here's the graph (fig. 2):

Human emissions of CO2 from fossil fuels and cement

Fig. 2: Since the start of the Industrial Revolution, human emissions of carbon dioxide from fossil fuels and cement production (green line) have risen to more than 35 billion metric tons per year, while volcanoes (purple line) produce less than 1 billion metric tons annually. NOAA Climate.gov graph, based on data from the Carbon Dioxide Information Analysis Center (CDIAC) at the DOE's Oak Ridge National Laboratory and Burton et al. (2013).

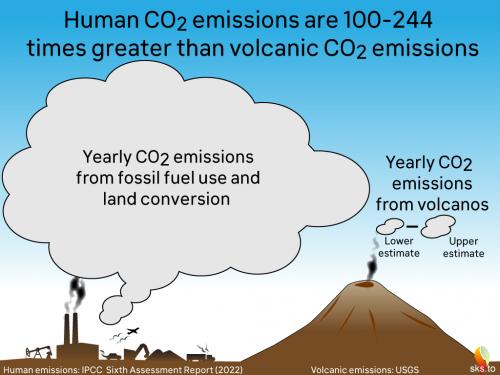
And here's a cartoon version (fig. 3):

 Human and volcanic CO2 emissions

Fig. 3: Another way of expressing the difference between current volcanic and human annual CO2 emissions (as of 2022). Graphic: jg.

Volcanoes can - and do - influence the global climate over time periods of a few years. This is occasionally achieved through the injection of sulfate aerosols into the high reaches of the atmosphere during the very large volcanic eruptions that occur sporadically each century. When such eruptions occur, such as the 1991 example of Mount Pinatubu, a short-lived cooling may be expected and did indeed happen. The aerosols are a cooling agent. So occasional volcanic climate forcing mostly has the opposite sign to global warming.

An exception to this general rule, however, was the cataclysmic January 2022 eruption of the undersea volcano Hunga Tonga–Hunga Ha'apai. The explosion, destroying most of an island, was caused by the sudden interaction of a magma chamber with a vast amount of seawater. It was detected worldwide and the eruption plume shot higher into the atmosphere than any other recorded. The chemistry of the plume was unusual in that water vapour was far more abundant than sulfate. Loading the regional stratosphere with around 150 million tons of water vapour, the eruption is considered to be a rare example of a volcano causing short-term warming, although the amount represents a small addition to the much greater warming caused by human emissions (e.g. Sellitto et al. 2022).

Over geological time, even more intense volcanism has occurred - sometimes on a vast scale compared to anything humans have ever witnessed. Such 'Large Igneous Province' eruptions have even been linked to mass-extinctions, such as that at the end of the Permian period 250 million years ago. So in the absence of humans and their fossil fuel burning, volcanic activity and its carbon emissions have certainly had a hand in driving climate fluctuations on Earth. At times such events have proved disastrous. It's just that today is not one such time. This time, it's mostly down to us.

Last updated on 10 September 2023 by John Mason. View Archives

Printable Version  |  Offline PDF Version  |  Link to this page

Argument Feedback

Please use this form to let us know about suggested updates to this rebuttal.

Related Arguments
Further reading

Tamino has posted two examinations of the "volcanoes emit more CO2 than humans" argument by looking at the impact of the 1991 Pinutabo eruption on CO2 levels and the impact of past super volcanoes on the CO2 record.

The Global Volcanism Program have a list of all "most noteworthy" volcanoes - with for example a Volcanic Explosivity Index (VEI) greater than 5 over the past 10,000 years.

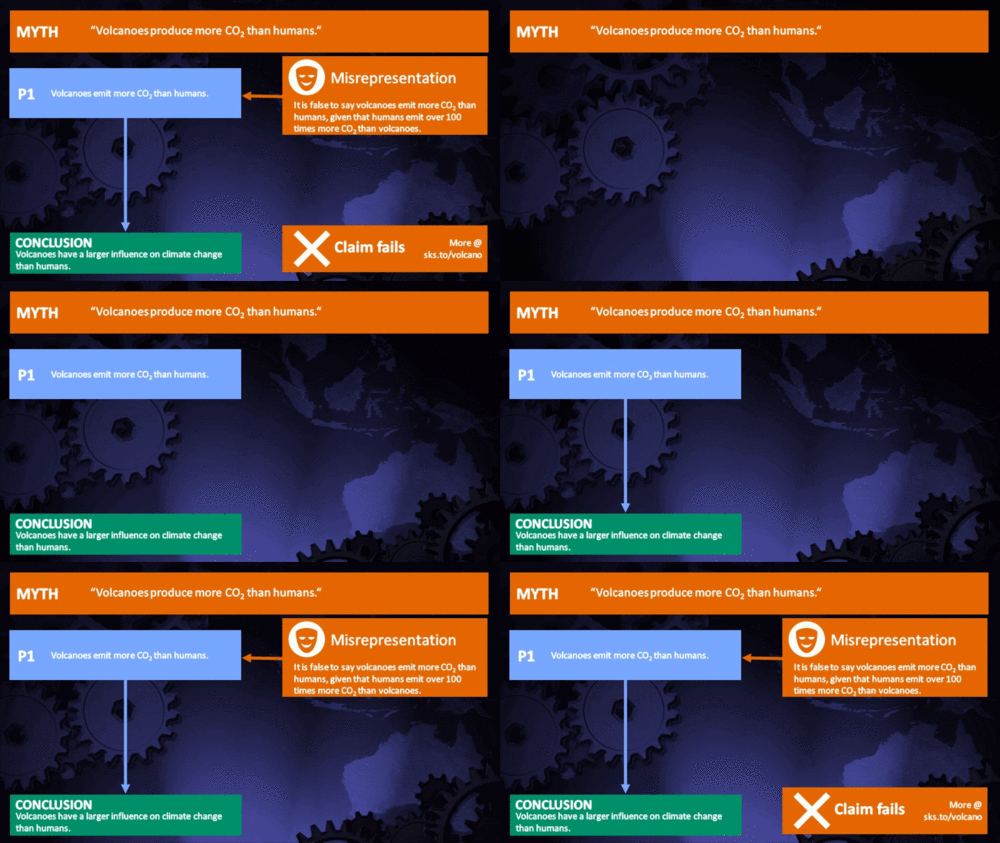
Myth Deconstruction

Related resource: Myth Deconstruction as animated GIF

MD Volcano

Please check the related blog post for background information about this graphics resource.

Denial101x video

Here is the relevant lecture-video from Denial101x - Making Sense of Climate Science Denial

Fact brief

Click the thumbnail for the concise fact brief version created in collaboration with Gigafact:

fact brief

Comments

Prev  1  2  3  4  5  6  7  8  9  10  Next

Comments 101 to 125 out of 243:

  1. ... or 5. internal variability greater than thought __________ About efficacy of forcings: I haven't actually read much about that but here's what I would expect: Consider a forcing by Solar TSI LW (greenhouse) forcing volcanic stratospheric aerosols tropospheric aerosols surface albedo For any given forcing - let's start with radiative forcing - there is: 1. a global average TOA (top of atmosphere) value, R-TOA. 2. a global average tropopause value, R-tp 3. a global average surface value, R-sfc. 4. Some spatial-temporal (seasonal, perhaps interannual) variation in either of R-TOA, R-tp, R-sfc, which I will simply refer to here as R-var. 5. Some climatic response which results from the effect of R and feedbacks. - To start with, we might assume an approximation that the climatic response in so far as global average is concerned, is similar to any R-tp or R-TOA for any forcing. Then we might look for deviations from that. Differences: R-TOA is the forced net change in downward minus outgoing radiation 'at' the top of the atmosphere. R-tp is different then R-TOA; both are different from R-sfc - First: 1. An increase in solar TSI - if the same % increase at all wavelengths - the forcing is a heating distributed (unevenly) through the atmosphere and surface. R-TOA is the sum of all of this heating; R-tp is only the heating below the tropopause and is therefore somewhat less than R-TOA; R-sfc is only surface heating and is therefore less than R-tp. Typically changes in solar TSI are greater in UV in particular, so a larger fraction than otherwise of solar forcing goes into heating the upper atmosphere, thus decreasing R-tp even further. 2. Greenhouse forcing is a reduced cooling to space, which is a heating of the surface and/or lower atmosphere. The cooling to space of the stratosphere and above, however, increases, while the heating of higher atmospheric layers by the surface and/or lower troposphere decreases. Thus for greenhouse forcing, R-TOA will be a little less then R-tp. Starting at minimal LW opacity, R-sfc might be greater than R-tp (?), but at least for CO2, my impression is increases from the current amount result in greater R-tp than R-sfc. Water vapor is a feedback, but applying the same concepts to water vapor, I think, at least under some conditions, R-sfc is greater than R-tp for water vapor. This is at least in part due to water vapor's increasing concentration toward the surface. Ozone concentration is also variable so greenhouse effects of ozone changes may be a bit different than the 'typical' well-mixed greenhouse gas. The exact relationship between R-tp, R-sfc, and R-TOA for even well-mixed greenhouse gases (like CO2, CH4, N2O, CFCs) (they have some spatial and seasonal variations but not to the degree of ozone or water vapor) could vary because they have different spectrums, and temperature (and water vapor, ozone, cloud content) varies with height (and other dimensions), they may overlap with each other and other things in different ways due to the above differences, and they have different initial amounts before changes occur. 3. a decrease (to keep the same sign of forcings for more straightforward comparison) in volcanic stratospheric aerosols - this would reduce albedo. The aerosols reflect SW (solar) radiation back up from the stratosphere, thus cooling the troposphere and surface but possibly heating the air above; and perhaps heating the stratosphere a little bit (? I think the stratosphere or some part of it actually warms up after relevant eruptions - this might be due to the nonzero absorption of solar radiation by the aerosols themselves) (some of the solar radiation is scattered downward or sideways - for a near-overhead sun (middle of day, summer midlatitude, or at low latitude), this can increase the path length before reaching the surface, thus increasing the portion absorbed in the air...) ... SO scattering of radiation is complicated (but not so much that it isn't understood), but reducing volcanic aerosols results in an R-sfc and R-tp greater than R-TOA, and I suspect R-sfc would be greater than R-tp. 4. tropospheric aerosols 4a. A decrease in the albedo from reduced scattering by aerosols: R-sfc will be greater than R-tp and R-TOA as some of the reflected and scattered radiation had been absorbed by air and clouds. 4b. An increase in the atmospheric heating by increased absorption of aerosols: R-TOA and R-tp will be positive while R-sfc is negative. 4c. scattered radiation can be subsequently absorbed in the air; the total effect of aerosols is not simple, but again, it isn't an impossible riddle either. 5. Decrease in albedo due to surface conditions: The change in albedo actually at the surface may have to be greater than that which results at TOA, due to clouds, but also time of day and year issues, and latitude. Anyway, reflected solar radiation has a second chance to be absorbed by the air, so the decrease in albedo because of surface conditions may result in R-sfc greater than R-tp and R-tp greater than R-TOA (but perhaps only slightly). HOWEVER: R-tp may be (as it is in IPCC work) defined as that which occurs after the stratosphere and above have reached thermal equilibrium with the forced heating or cooling (R-TOA - R-tp) which occurs there (PS notice this is not the same as that equilibrium which would result after the climate response including the tropsophere and surface). If R-TOA is greater than R-tp, then the stratosphere, etc, will have warmed, so R-tp will be a little higher as a result due to increased downward LW radiation (or a decrease in net upward LW radiation). If R-TOA is less than R-tp, the opposite will be true. In other words, R-tp will get closer to the original R-TOA (But I don't think it would be equal to the original R-TOA - I expect it to still be less or greater than R-TOA, whichever was the case to begin with). R-sfc might also shift in the same direction but not as much so long as there are any greenhouse agents within the troposphere. Of course, in the full climatic response, however tropospheric heating (R-tp - R-sfc) is distributed within the troposphere, or however much it is, as an upper layer warms up, it reduces convective heat transport from below, thus the tendency is for the full effect of R-tp to propogate by convection to the surface, whatever R-sfc was. However, a larger R-tp - R-sfc and/or smaller or negative R-sfc value will tend to reduce convection from the surface - HOWEVER, after all feedbacks have occured, the radiative heating/cooling distribution may be different again. ***I think this would be less true for regionally-concentrated forcings (pockets of high aerosol concentrations, for example), because advection into and out of the area would prevent a radiative convective equilibrium on the regional scale, so perhaps this is partly why I hear of atmospheric brown clouds (dark absorbing aerosols) in particular reducing vertical motion by increasing stability. So a global average R-tp will tend to result in some global average tropospheric and surface temperature increase. Some other effects due to the vertical distribution may change the feedbacks that occur and thus the resulting temperature changes in the surface and troposphere - but to my knowledge that is not a big effect (?). The horizontal (and seasonal, if and when it matters (ozone)) variations could also affect the actual global average results. For example - the R-tp and R-TOA of albedo reduction from BC landing on snow/ice will likely be a little smaller than the R-sfc value (some radiation reflected from the surface can be reflected back to the surface by clouds, aerosols, and air molecules); furthermore and perhaps much more importantly, the effect is concentrated where a positive feedback is also concentrated (snow-ice albedo feedback). Thus the climate sensitivity could be expected to be larger to BC on snow/ice forcing than to some other forcings, to the extent that the forced heating is not entirely advected away from similar locations. As far as anthropogenic well mixed greenhouse gases (WMGHG - to adopt the acronymn I saw in a paper - this includes CO2, CH4, N2O, CFCs - well, at least a couple CFCs) compare to solar radiative forcing - the geographic distribution of R-tp is going to be at least a little similar on a broad scale - the LW forcing is highest in the subtropics because of the relatively dry cloud-free air and higher lapse rates; high cloud tops in the tropics prevent greenhouse gases below them from having any direct effect on R-tp; lower tropospheric and surface temperatures in general and smaller lapse rates at higher latitudes reduce the difference in outgoing LW radiation (at least at tropopause level - and the tropopause is lower there, too) that would result from changing greenhouse gas concentrations (and the lower surface temperatures. Solar forcing will generally be greatest at low latitudes, during the day, and/or in summer, where there are fewer clouds, reflective aerosols, darker surfaces (ocean, forests), etc. For example, the dry subtropics (but unlike WMGHGs, solar forcing would not be as large over dry light-colored landscapes as it would be over dark oceans). Etc. R-tp will be higher than otherwise when there is less stratospheric ozone. There is a latitudinal and seasonal ozone variation - there tends to be more ozone at higher latitudes in winter/spring, I think - because while stratospheric ozone is produced more at low latitudes, winter stratospheric circulation brings it into high latitudes, and actually 'piles it up' there, in part (if not in whole) because the stratosphere is thicker at higher latitudes (lower tropopause)... ---- Of course anthropogentic GHG forcing is expected to result in a cooler stratosphere (observed - although stratospheric ozone depletion also has a similar effect - but each can be calculated so it should be possible to attribute portions of cooling), and greater warming at nights during days near and at the surface over land (not much diurnal cycle to begin with over oceans because of heat capacity) - (also observed, at least somewhat). Positive solar forcing that would warm the surface and troposphere would also warm the stratosphere (not observed). However, because of this, there could be effects on atmospheric circulation that are different than for GHGs, which might affect climate sensitivity (but how much and in what direction?).*** (Quietman - if you want to show a reduced climate sensitivity by way of greater total forcing, you might try looking into how solar forcing, including non-TSI or non-UV effects, affect not only the stratosphere, but also the ionosphere, and for example the E-region dynamo, and how geomagnetic effects also affec the E-region dynamo and solar-magnetospheric-ionospheric interactions, and what any resulting circulation pattern changes would be, and if and how that propogates downward. I am not saying that I expect you to be successful, but it's a thought - while I have my doubts, I think it's got a lot more potential than submarine volcanism, solar jerk, tides on sun, Spencer's PDO+ENSO work, Spencer's cloud forcing work, urban heat island dominance, or the idea that there hasn't been a recent spurt of global warming above and beyond internal variability.)
  2. "so perhaps this is partly why I hear of atmospheric brown clouds (dark absorbing aerosols) in particular reducing vertical motion by increasing stability." Actually, the full effect may be an increase in stability to moist convection by reduction in evaporation; in so far as dry convection is concerned, while the heating has been moved upward from the surface, it won't generally be all the way up to the tropopause; while there will tend to be increased stability beneath such a brown cloud, there will tend to be reduced stability above it. The heating of the brown cloud itself will tend to cause a low pressure beneath it and a high pressure above it, and the brown cloud itself will tend to rise.
  3. ... of course, I've never been quite clear on 'global dimming - H2O evaporation' - of course if water is being heated to higher temperature, the tendency is for faster evaporation under the same wind and relative humidity. But there has been global warming along with 'global dimming' (? - according to some comments at "Arctic sea ice..."), so how does decreased solar radiation reaching the surface affect evaporation independently of temperature? Is it analogous to the photoelectric effect - in this case, individual higher energy photons are able to kick off H2O molecules into the air even if the temperature is low (but not too low)? Sounds conceivable, but then again, the absorption of solar radiation is distributed within a depth of water from the surface downward; less so for the shortest wavelengths, red light and solar IR, but I suspect it's a tiny tiny fraction that would be absorbed within a 'molecular layer' or two from the surface.
  4. Since much of what I am about to say applies to the "Arctic sea ice"... , I'm going to post a few comments there now. If after that I haven't covered some of what was brought up here in comments 87-95, I'll come back here.
  5. Patrick Your explanations and willingness to look at both sides is exactly why I asked you to come to this site. In most cases I can see your logic and find it convincing. Keep in mind that this type of science is new to me. I have a beckground in engineering research (product developement) and bench testing emissions but I have never done well with theoretical math only logic and applied math, so keep it simple. Trust me, it is just as frustrating for me when someone points to a paper and claims it as fact without a logical explanation as it is when I get quoted from a bible passage. The fact that you don't resort to that is quite refreshing.
  6. Patrick In a new article at MSNBC titled ‘Dead’ planets might be livable after all they explain planetary tidal forces in the manner that I see them (inferring from the Solar Jerk) but carried to more of an extreme than we experience. The hypothesis is the same however, it's only a matter of degree.
  7. Patrick I found a little more background data: Evidence Mounts For Arctic Oscillation's Impact On Northern Climate: ScienceDaily (Dec. 20, 1999)- A growing body of evidence indicates that a climate phenomenon called the Arctic Oscillation has wide-ranging effects in the Northern Hemisphere and operates differently from other known climate cycles. Arctic Oscillation Has Moderated Northern Winters Of 1980s And '90s: ScienceDaily (July 10, 2001) - The Arctic Oscillation has been linked to wide-ranging climate effects in the Northern Hemisphere, but new evidence shows that in recent decades it has been the key in preventing freezing temperatures from extending as far south as they had previously. Synchronized Chaos: Mechanisms For Major Climate Shifts: ScienceDaily (Aug. 2, 2007) — In the mid-1970s, a climate shift cooled sea surface temperatures in the central Pacific Ocean and warmed the coast of western North America, bringing long-range changes to the northern hemisphere. It seems that someone has been ignoring this data for quite a few years now. I wonder why.
  8. That was interesting. One important point is that the heat would take time to build up from such a process. In spite of all the Earth's internal heat, it counts little for regional or global scale climate (directly), because the heat flux is very small. For internal heat to make a difference to surface temperatures on a large scale, the heat flux has to be significant compared to the heating by radiation from the planet's star. Assuming a rocky crust as on Earth, the thermal gradient must then be that much greater, which means perhaps a thin crust on a molten mantle.
  9. That last comment was about "'Dead' planets might be livable after all". hope to get back to AO discussion within a few days...
  10. Patrick Re: 108 Maybe not global, I was thinking on a much more localized scale (as in the cause of El Nino) that has wide effects (as in El Nino).
  11. 2004 Indian Ocean Tsunami Biggest in 600 Years turns out to be more evidence of tectonic upset.
  12. Mystery Wave Strikes Maine Harbor By Robert Roy Britt, LiveScience Managing Editor, 04 November 2008: "A series of large, unexpected tsunami-like waves as high as 12 feet struck Maine's Boothbay Harbor on Oct. 28, and there's still no explanation for what caused them."
  13. "Mystery Wave Strikes Maine Harbor" - interesting, yes. Likely related to climate change, or a multidecadal scale geological variance - the later seems unlikely, the former could be true in the sense that this may happen more often due to storm waves or whatever, but considering the (apparently) sparse number of such events, it's hard to find a trend, so unless this kind of thing could be expected as a result of something else, there isn't much to go on. "2004 Indian Ocean Tsunami Biggest in 600 Years" - "turns out to be more evidence of tectonic upset." - it was a tectonic upset, but not the kind for which a correlation to multidecadal climate trends would be expected. On the Arctic Oscillation - "Synchronized Chaos: Mechanisms For Major Climate Shifts" - I will have to read the paper referenced by the article. I suspect though that more is understood about how CO2 would affect climate than is about these kinds of things. The other two: they suggested global warming could be behind the trend in the AO, or at least some portion of it. Of course there is internal variability, and some unforced variation in AO will occur. (?) AO itself doesn't seem to cause much of a global average temperature change (? - if the change in temperature at midlatitudes is balanced by that in the polar region).
  14. More on Tectonic activity and poor instruments: "On May 12, 2008, at 2:28 p.m., China's Szechwan province changed forever. In the space of 90 seconds, an earthquake equivalent to 1,200 H-bombs pulverized the earth's crust for more than 280 kilometers. Entire cities disappeared and eight million homes were swallowed up. This resulted in 70,000 deaths and 20,000 missing." "According to ShaoCheng this tragedy could have been avoided. "There hasn't been one earthquake in Szechwan province for 300 years. Chinese authorities thought the fault was dead," he says. The problem is that China relied on GPS data, which showed movements of 2 mm per year in certain areas when in reality the shifts were much bigger. "GPS is high-tech, but do we really know how to interpret its data?," he questions." Ref: Can China's Future Earthquakes Be Predicted? ScienceDaily (Nov. 24, 2008)
  15. This article Prehistoric Climate Can Help Forecast Future Changes ScienceDaily (Nov. 25, 2008, includes an interesting graphic. The "hot spot" anomalies in ocean temperatures are all very geologically active areas of volcanism/plate tectonics. While the article itself is worth reading, it's the illustration that stands out.
  16. John Cook said: “There are two skeptic approachs to volcanoes: high volcanic activity causes global warming and/or low volcanic activity causes global warming” - I say: “two skeptic approachs to volcanoes”, don’t excluded… „On the contrary, relatively frequent volcanic activity in the late 20th century may have masked some of the warming caused by CO2.” - I think - it’s not “all” right… 1.In IV report IPCC, chapter 2, p. 194, is Fig. 2.18 - distinctly differ from John’s Fig whit volcanic - optical depth… 2. In this IV report on p. 195-6 is writing about “chemical destruction of stratospheric ozone”. Here is, in references, one interesting position: Tabazadeh at al, 2002… I remind You, what Tabazadeh was said then - in 2002 y: "Both the 1982 El Chichon and 1991 Mt. Pinatubo eruptions were sulfur-rich [not only S, but else Cl2 ,B(OH)3,NH3,CH4, Cl, F by metals compounds] , producing volcanic clouds that lasted a number of years in the stratosphere," "A 'volcanic ozone hole' is likely to occur over the Arctic within the next 30 years, [!!!]" “Between about 15 and 25 kilometers (9 to 16 miles) in altitude, volcanic Arctic clouds could increase springtime ozone loss over the Arctic by as much as 70 percent, according to Drdla” (http://www.spaceflightnow.com/news/n0203/05volcano/ and http://www.gsfc.nasa.gov/topstory/2002/20020304volcano.html) The annually production anthropogenic CFC = 750,000 T pure Cl, = one week by Mount Erebus productions…, at the all a World volcanoes, have a annually production 36,000,000 T Cl… Results about It , is visible here http://www.esrl.noaa.gov/gmd/dv/spo_oz/SP_Dobson_Oct15-31_2007_mod1.gif, and of stratosphere temperature in: http://www.atmosphere.mpg.de/media/archive/1385.jpg, Robert A. Ashworth in papers: CFC Destruction of Ozone - Major Cause of Recent Global Warming! (2008; http://omsriram.com/GlobalWarming.htm - all paper is very interesting) say: “The loss of ozone allowed more UV light to pass through the stratosphere at a sufficient rate to warm the lower troposphere plus 8-3/4" of the earth by 0.48 o C (1966 to 1998).” IPCC said: global anthropogenic GHG effects in this period = ~ 0,5 dg. C, Ashworth said: “anthropogenic emissions of chlorofluorocarbons”, it’s the reason it… …I say: volcanic S, Cl, F - emissions, dear Mrs. Ashworth… I propose else this image: http://www.leif.org/research/Erl70.png. It’s worth seeing.
  17. Arkadiusz Semczyszak - "The annually production anthropogenic CFC = 750,000 T pure Cl, = one week by Mount Erebus productions…, at the all a World volcanoes, have a annually production 36,000,000 T Cl" CFCs are generally very unreactive until they reach the stratosphere and are broken down by UV, releasing Cl, etc. Volcanic Cl is probably much more reactive, and more likely to be rained out before reaching the stratosphere. I don't have time to read those papers right now, but I'll just note that the stratospheric cooling associated with AGW, (and also polar stratospheric cooling associated with increasing AO, which may or may not be a seperate matter, depending...) will make polar ozone holes more likely to result from any given ozone-depleting emission. Ozone depletion itself, while warming the troposphere below, cools the stratosphere by reduced UV absorption there, and also lets more longwave radiation from the surface escape to space, reducing any tropospheric warming that would result.
  18. A few of the problems with this: http://omsriram.com/GlobalWarming.htm 1. (at least one of) the IPCC figures are incorrectly interpreted - tropospheric ozone is increasing, NOT decreasing - this is also an anthropogenic effect. 2. some temperature graphs are off. 3. CO2 graph is off (though not as far off as another one I've seen). 4. The evidence really does justify a conclusion that significant CO2 increases cause significant global (tropospheric and surface) warming.
  19. " “The loss of ozone allowed more UV light to pass through the stratosphere at a sufficient rate to warm the lower troposphere plus 8-3/4" of the earth by 0.48 o C (1966 to 1998).” " Now spread that heat out over the top 100 m of ocean and see what happens. ( 100 m * 70 % of area + 10/4 m** / (8.75 in* 2.54 cm/in + 10/4 m** (**water depth equivalent to atmospheric heat capacity)) = 72.5 m / 2.72225 m = 26.6 0.48 deg C / 26.6 = 0.018 deg C. But the quote refers to the lower troposphere, in which case the result is less; if the lower troposphere is the air below about the 500 mb level, for example, then I get 0.48 deg C/ 48.4 = 0.0099 deg C. )
  20. Patrick I do see what you are saying but is it in fact catastrophic or just minor warming? Click Here for a recent article at Live Science : Earth's Atmosphere "Breathes" More Rapidly Than Thought By Andrea Thompson, Senior Writer, 2008-12-16 "Earth’s atmosphere was known to "breathe" in a cycle lasting nearly a month. Now scientists say the planet takes a quick breath every few days."
  21. Concerning the breathing of the Atmosphere - (mostly the Magnetosphere) http://www.livescience.com/space/081216-agu-breathing-atmosphere.html If there is a significant impact on surface+tropospheric climate, it would have to be either 1. changes in magnetosphere, ionosphere, or sun itself directly causing changes in radiative forcing via a supposed change in albedo such as by cloud particle nuclei or clear air transmissivity changes ... (how much of that happens and is there any multidecadal trend?) 2. via interaction with the E-region dynamo, driving circulation changes in the ionosphere, which somehow changes circulation in lower layers, perhaps in the way the stratospheric conditions affect the EP flux from waves in the troposphere ... (how much EP flux is way up there and what does it do? ? ?) Because the ionosphere and magnetospere are extremely thin, just too optically thin (except at shortest wavelengths - UV, etc.) to have significant direct effect on the overall energy budget of the atmosphere by changes in infrared radiation.
  22. ...(And the amount of energy in those shortest wavelengths is a very small fraction of the total radiant energy flux up or down)
  23. Patrick My point from the very befinning is that the atmosphere does not play as large a role in temperature as the IPCC and the alarmists claim. Every new article I read only confirms that our models are wrong. They just figured out, after 30 years of AGW hype, that the NE part of the US (and eastern Canada) has not warmed and in fact has gotten colder while the west coast warmed. I have come to the conclusion that it's the west coast alarmists hot air that caused the warming effect in the first place. :)
  24. "They just figured out, after 30 years of AGW hype, that the NE part of the US (and eastern Canada) has not warmed and in fact has gotten colder while the west coast warmed." And the interior of the continent? And Europe? And Asia? And Africa? And South America? And Australia? And Antarctica? And the oceans? And the glaciers? The tropical mountain glaciers? And the forests, and the birds, and the plants?...
  25. Patrick You may recall that when we started talking about Bertha we took note that tropical storms had been forming farther east, meaning a change in air currents. Eastern Canada and the N.E. U,S, are not the only places on earth that have cooled while population centers warmed and it is from population centers that most data comes from. Why was this cooling ignored? South America, Antarctica and Africa have not experienced the same changes as Europe and PARTS of Asia. In fact, it has been noted that most warming has been on the western coasts of the Americas and Europe. If you check the ocean threads here you will see that overall the oceans have not warmed but there ate definate warm currents and hot spots. South Atlantic and Antarctic deep water is notably getting colder. Referring to this as "climate change" is quite accurate, but it is by no means "global warming".

Prev  1  2  3  4  5  6  7  8  9  10  Next

Post a Comment

Political, off-topic or ad hominem comments will be deleted. Comments Policy...

You need to be logged in to post a comment. Login via the left margin or if you're new, register here.

Link to this page


The Consensus Project Website

THE ESCALATOR

(free to republish)


© Copyright 2024 John Cook
Home | Translations | About Us | Privacy | Contact Us