


 Arguments


Mapped: The sensitivity of the world’s ecosystems to climate
Posted on 1 March 2016 by Guest Author
This is a re-post from Robert McSweeney at Carbon Brief
The Earth is covered by a huge variety of ecosystems, from the lush rainforests of the hot and humid tropics to the rugged tundra of the cold and windswept Arctic.
New research, published in Nature, maps how sensitive these different types of vegetation are to the ups and downs of the climate from one year to the next.
The map below illustrates the study’s new “vegetation sensitivity index”, which indicates to what extent plant growth is affected by fluctuations in the climate. Ecosystems that are most sensitive to climate variability are shaded red, while those with low sensitivity are shaded green.
You can see there are highly sensitive regions around the Gulf of Guinea in West Africa, along the mid-to-high latitudes of the northern hemisphere, in the tropical forests of South America, and along the eastern side of Australia.
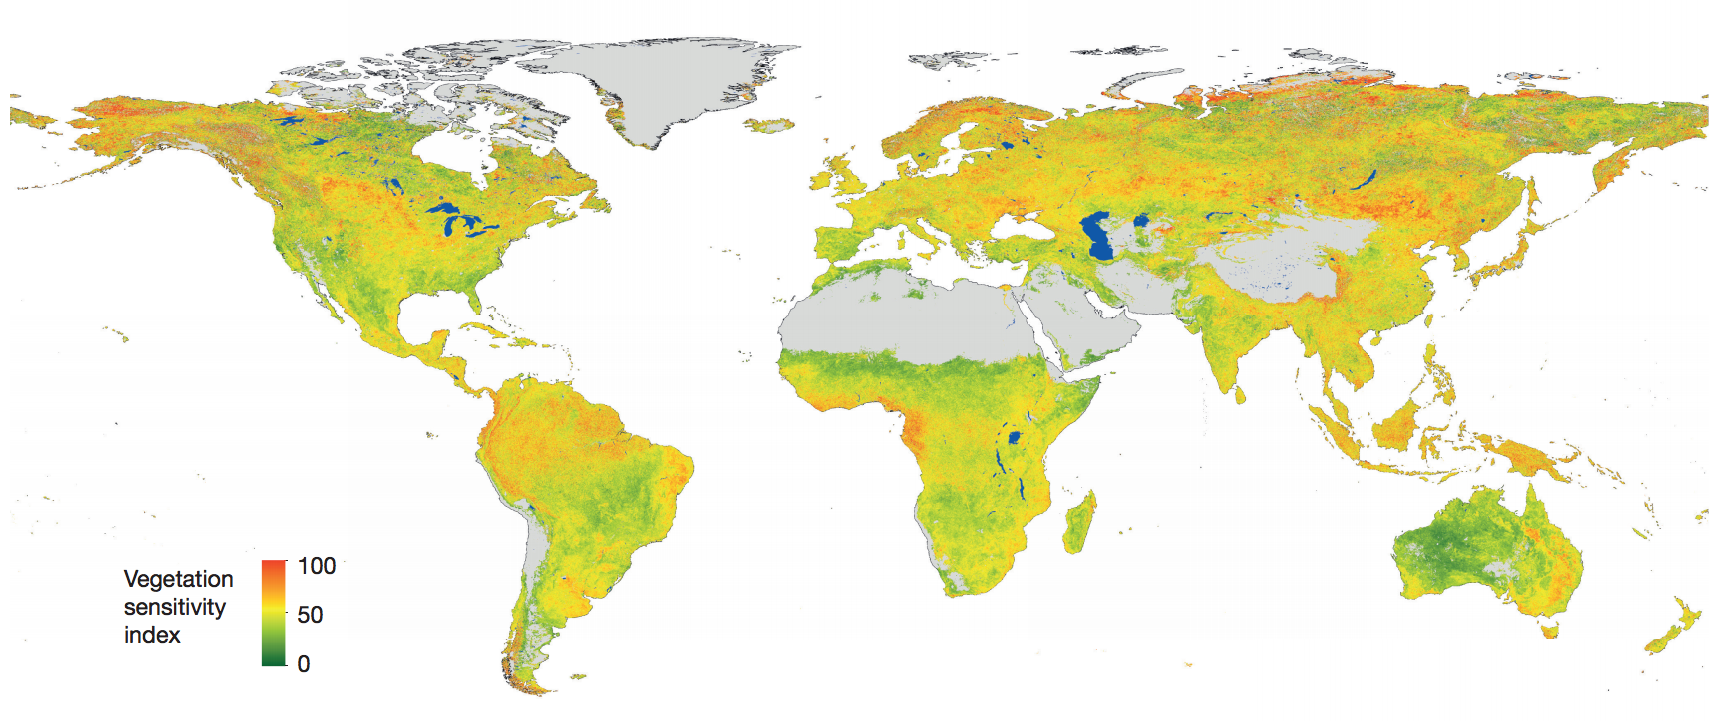
Sensitivity of vegetation productivity to variations in the climate during 2000-2013, for 5km grid squares across the Earth’s surface. Scores range from 0 (low sensitivity, green) to 100 (high sensitivity, red). Areas with dominant barren land or permanent ice are shaded grey. Inland seas and lakes are shaded blue. Source: Seddon et al. (2016).
Sensitivity
So, how do the researchers work out if an ecosystem is “sensitive” or not?
Plants need warmth, water and sunlight (as well as nutrients) in order to grow. Usingsatellite data for 2000-13, the researchers estimated how plant growth across the world has varied with fluctuations in temperature, water availability and cloud cover. Satellites measure changes in plant growth by the “greenness” of the vegetation.
Lead author Dr Alistair Seddon, a researcher at the University of Bergen, explains to Carbon Brief:
[An ecosystem] with a large variability in the climate variable – for example, lots of fluctuations around the average conditions – but a small variability in vegetation greenness would not be responding very much, so scores low sensitivity in our index. The opposite – low variability in climate and high variability in vegetation greenness – would score high on the index.
The map demonstrates how satellite data can be used to measure how ecosystems respond to the climate, says Prof Alfredo Huete, from the University of Technology Sydney, in an accompanying “news and views” article. This will help scientists understand what the future holds for the Earth’s vegetation under climate change, he writes:
Only through an understanding of vegetation’s responses to current climate variability can we improve predictions of the future consequences of such variability on our planet’s ecosystems and biodiversity, as well as on our own food security and welfare.
Climate variables
The researchers also worked out which of the three climate variables is most important for each ecosystem. Seddon explains:
[I]t depends on where you are in the world. A plant in the Arctic experiences much colder temperatures, and these colder temperatures can act as the main factor for limiting growth. In a dry shrubland in Australia, water would be more important.
For areas that are consistently warm and wet, such as tropical rainforests, plant growth depends heavily on fluctuations in cloud cover affecting the sunlight they receive, adds Seddon.
You can see this in a second map below. For example, the tropical forests in the Amazon, central Africa, and southeast Asia are most sensitive to cloudiness, so they are mostly shaded green. On the other hand, the vast prairie grasslands in the middle of North America are sensitive to water availability, and so they appear blue in the map. Areas that are very sensitive to more than one climate variable show a combination of colours, so purple areas, for example, are sensitive to both temperature (red) and water availability (blue).
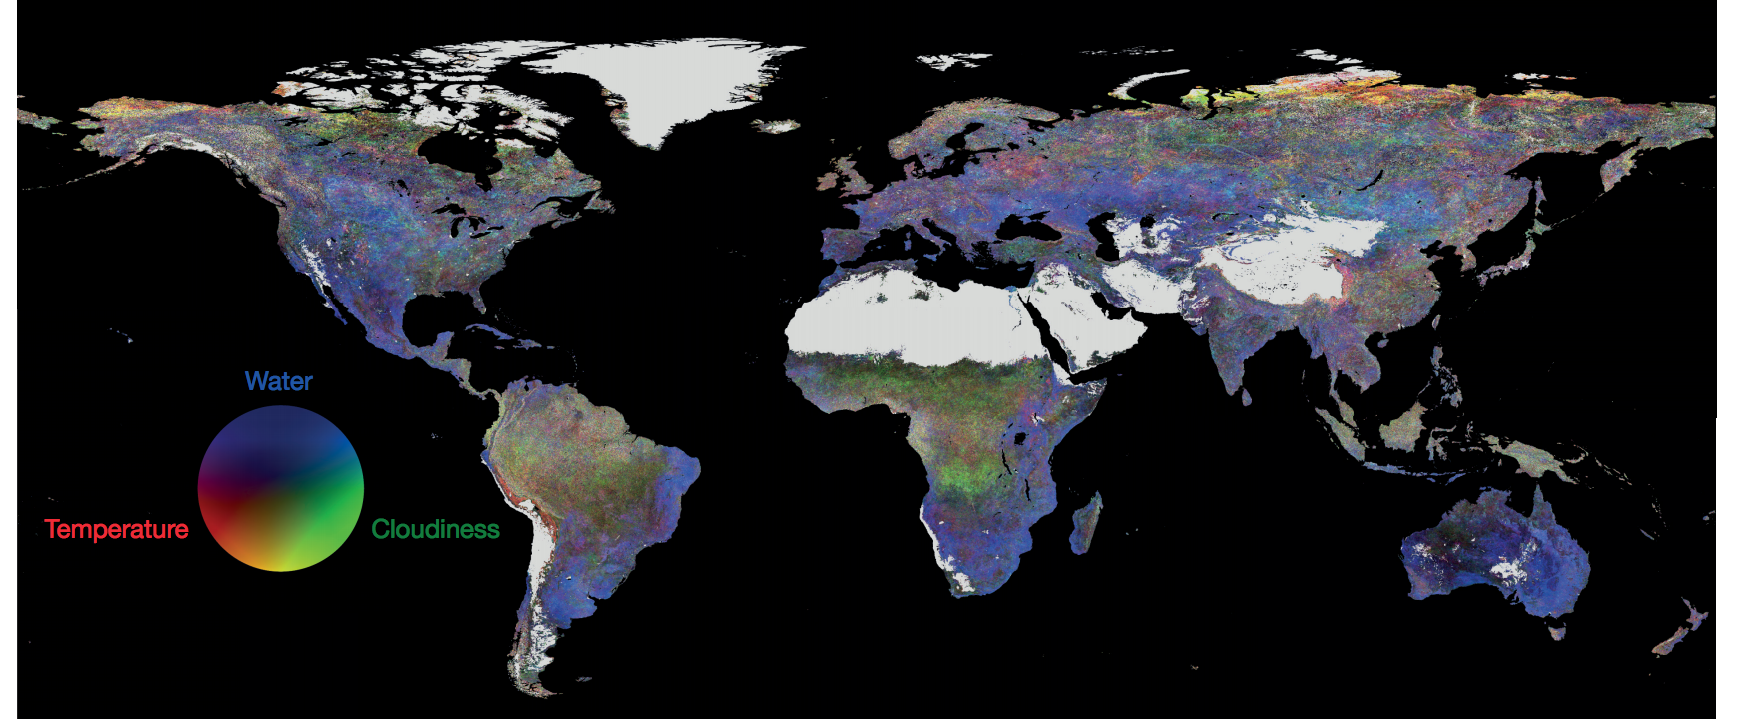
Contribution of three climate variables (temperature, red; water availability, blue; and cloudiness, green) to overall ecosystem sensitivity to climate. Data collected during 2000-2013, for 5km grid squares across the Earth’s surface. Areas with dominant barren land or permanent ice are shaded grey. Inland seas and lakes are shaded blue. Source: Seddon et al. (2016).


There is something a bit odd about the top map. It shows low to mid sensitivity of vegetation productivity in the area of Syria, even though they have had such a bad drought there, that many attribute at least part of the political chaos there to the displacement it caused of subsistence farmers and herders there. Am I missing something?
Hi Will,
As I understand it, this study doesn't measure drought per se, but the sensitivity of thhe local plants to climate. In the case of Syria, I think that the answer may be that although the ecosystem may only be medium-sensitive to climate, the system itself is also so marginal for producing any plant life (as seen in the background of the news photos) that beyond a threshold, a small amount climate change was enough to tip it over the edge. Of course, this doesn't mean that NOTHING would grow, only that farmers could no longer make a living from what they could grow. Here things get complex because the economic viability of farms is affected by variables other than local climate. The massive collapse of small "corn and beans" farms in Mexico was probably caused less by climate change and more by the sudden availablility of cheap imported food from the US driven by NAFTA. Then the force driving emmigration became not so much lack of food as the lack of any money to buy it.
Supplemental reading:
New research exposes urgent need to transform key agriculture regions across Africa by as early as 2025 by CIAT* Comunicaciones, Mar 7, 2016
*International Center for Tropical Agriculture