Climate Science Glossary

Term Lookup

Enter a term in the search box to find its definition.

Settings

Use the controls in the far right panel to increase or decrease the number of terms automatically displayed (or to completely turn that feature off).

Term Lookup

Settings


All IPCC definitions taken from Climate Change 2007: The Physical Science Basis. Working Group I Contribution to the Fourth Assessment Report of the Intergovernmental Panel on Climate Change, Annex I, Glossary, pp. 941-954. Cambridge University Press.

Home Arguments Software Resources Comments The Consensus Project Translations About Support

Bluesky Facebook LinkedIn Mastodon MeWe

Twitter YouTube RSS Posts RSS Comments Email Subscribe


Climate's changed before
It's the sun
It's not bad
There is no consensus
It's cooling
Models are unreliable
Temp record is unreliable
Animals and plants can adapt
It hasn't warmed since 1998
Antarctica is gaining ice
View All Arguments...


Username
Password
New? Register here
Forgot your password?

Latest Posts

Archives

Continued Lower Atmosphere Warming

Posted on 14 October 2011 by dana1981

We recently discussed Santer et al. (2011), which compared the observed trends in the temperature of the lower troposphere (TLT) with those predicted by climate models.  The paper also examined claims by John Christy in testimony to US Congress that TLT is warming at just one-third the rate predicted by climate models, and found that he had greatly exaggerated the model-data discrepancy.

Santer et al. also examined what models have to say about short-term trends, and concluded as follows:

"Because of the pronounced effect of interannual noise on decadal trends, a multi-model ensemble of anthropogenically-forced simulations displays many 10-year periods with little warming.  A single decade of observational TLT data is therefore inadequate for identifying a slowly evolving anthropogenic warming signal.  Our results show that temperature records of at least 17 years in length are required for identifying human effects on global-mean tropospheric temperature."

So there are two key findings here.  Firstly, even with man-made global warming taken into account, because of the short-term noise due to the internal variability in the climate system, climate models predict that there will be decades where natural cycles dampen the man-made warming trend. 

Secondly, in order to identify the human influence on global temperatures, we must examine at least 17 years' worth of data (unless we first filter out the natural noise).  This finding undermines the many "skeptic" claims that global warming stopped in 1995 or 1998 or 2001 or 2005, etc. etc.

Pielke's Criticism

Roger Pielke Sr. weighed in on Santer et al. (2011) on his blog, and he did concede the first key finding above:

"I agree with Santer et al that “[m]inimal warming over a single decade does not disprove the existence of a slowly-evolving anthropogenic warming signal.”

Unfortunately, Dr. Pielke seems to have neglected the second key finding above, as he proceeds to examine 13 years of TLT data.

"they did not recognize that the global average temperature trend in the lower troposphere has been nearly flat  as shown, for example, in the figure below from the RSS MSU data...There has been NO long-term trend since the large El Nino in 1998.  That’s 13 years."

So why examine 13 years' worth of data?  That seems like a rather arbitrary figure - it's larger than 10, but smaller than the 17 year timeframe which Santer et al. concluded is necessary to evaluate the human influence on global temperatures.  Dr. Pielke recently answered this question:

"I did not start in 1998 because it was the warmest in the record. I started after that when the MSU LT became ~flat."

However, part of the reason the TLT data is "~flat" over that period is that 1998 was an anomalously hot year.  As Dr. Pielke notes in the quote above, 1998 was a "large El Niño year."  In fact, not just a large El Niño; 1997-1998 saw one of the strongest El Niños on record.  And the TLT data are more sensitive to ENSO events than surface temperature data (Figure 1).

UAH vs RSS vs GISS

Figure 1: RSS (blue), UAH (green), and GISTEMP (red) 12-month running averages since 1979.

The El Niño peak in 1998 and La Niña trough in 2008 in particular are much more evident in the satellite data sets than in the surface temperature record.

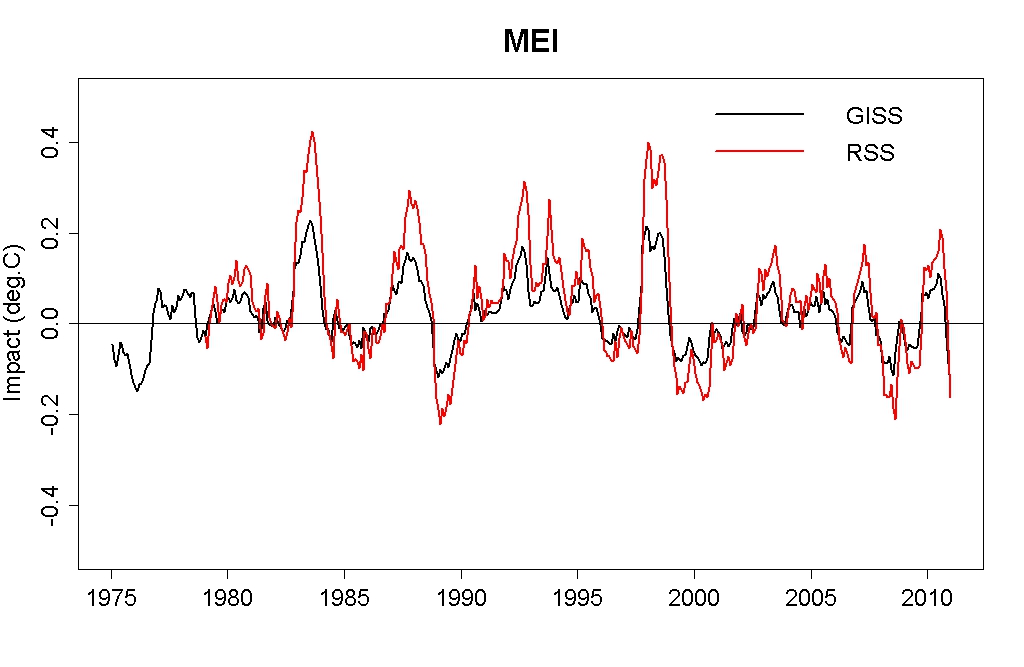
Tamino has also previously performed a multiple regression of temperature on various short-term effects, including the Multivariate ENSO Index (MEI), and confirms that TLT data are much more sensitive to ENSO than surface temperature data (Figure 2).


tamino MEI

Figure 2:  Impact of MEI on RSS TLT and NASA GISS surface temperature (Source: Open Mind)

In short, 1998 was an anomalously warm year due to the record strong El Niño that year, especially in the satellite TLT data.  Therefore, choosing 1998 as the starting year will result in minimizing the short-term temperature trend.

To further illustrate the point, if we choose a timeframe of 14 years of RSS TLT data, there is a positive trend.  If we choose 12 years, it's even more positive.  Dr. Pielke has said he chose the RSS data in his critique because it's "the same data that is used in the Santer et al study."  However, Santer et al. examined both UAH and RSS data.

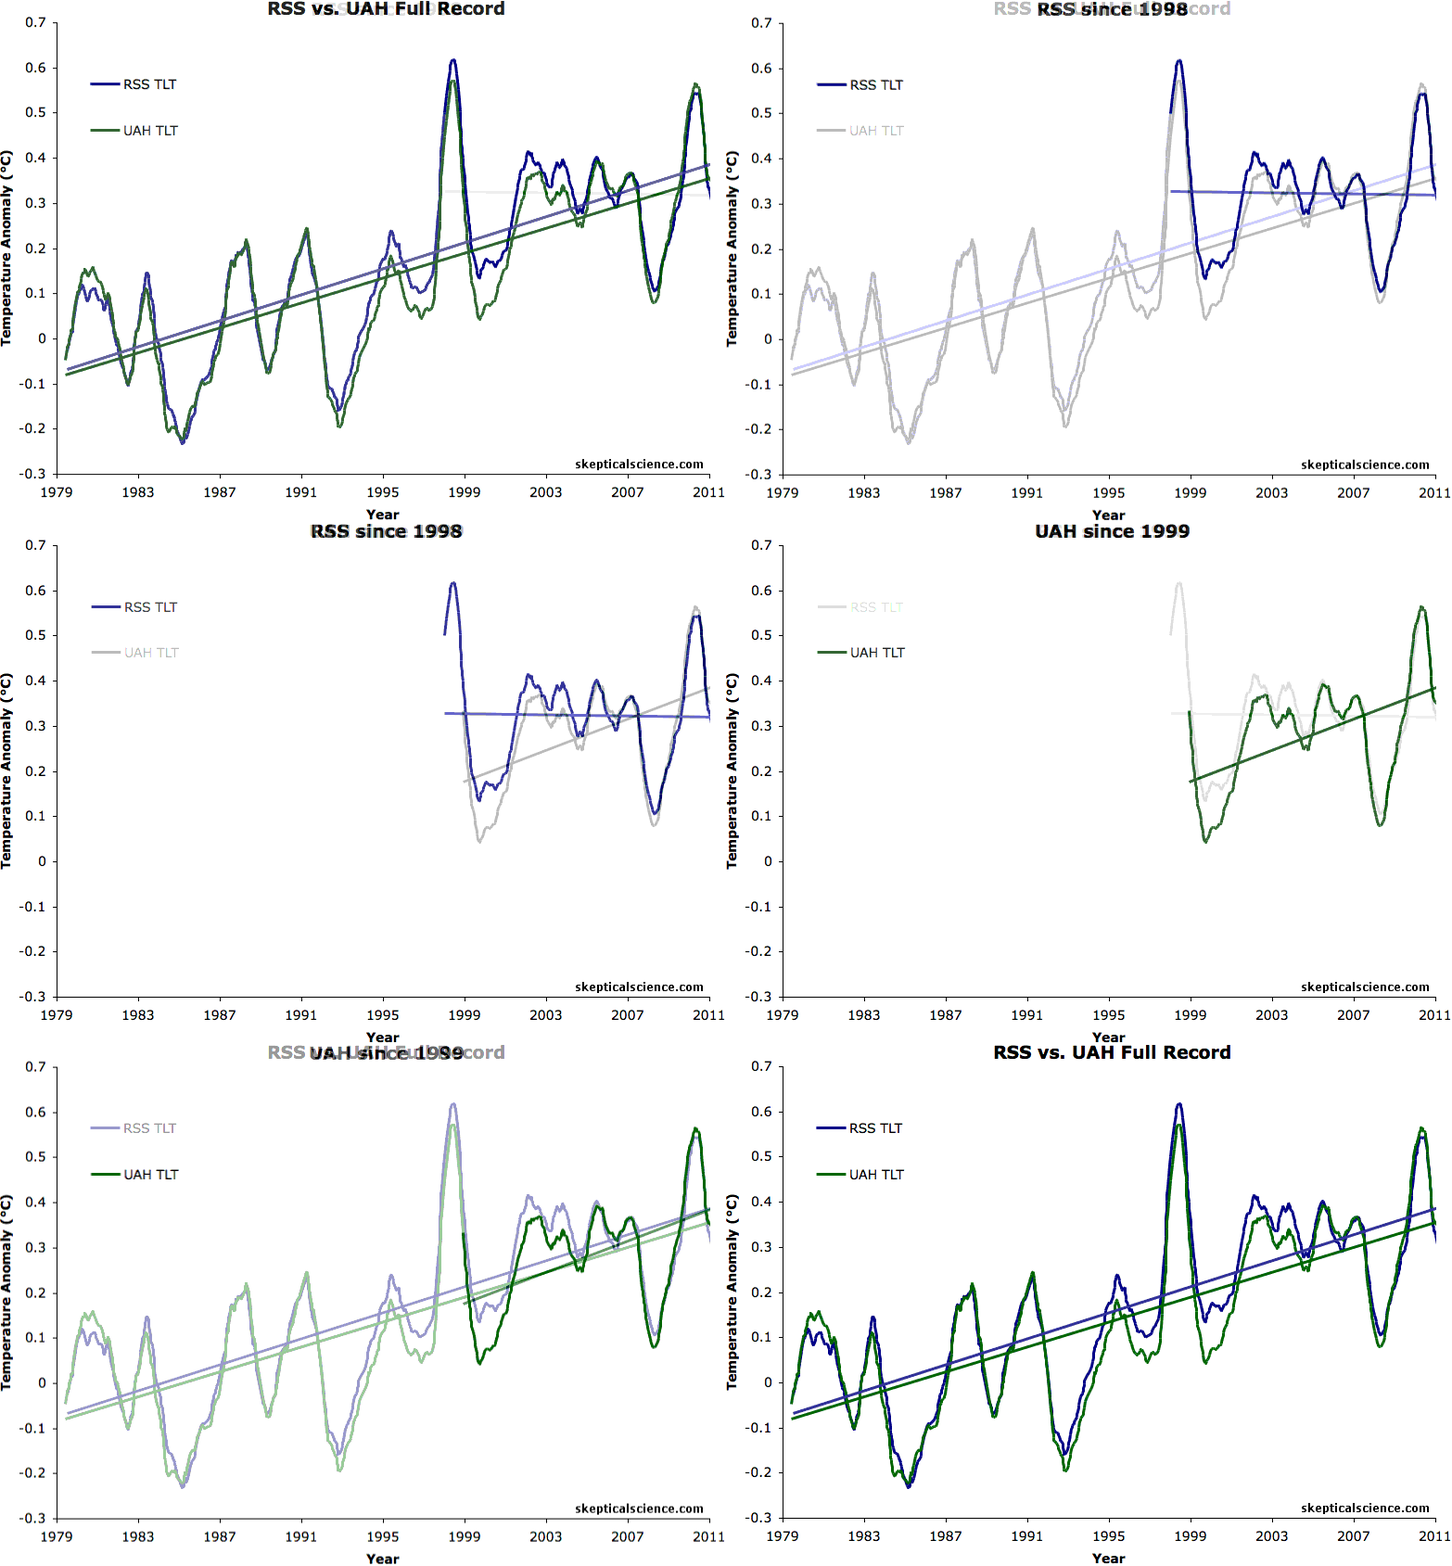
If we examine UAH data (which Dr. Pielke has said this is an "outstanding" data set) starting in 1998, even the 13-year TLT trend is positive.  The start data also makes a big difference in the short-term trend.  The UAH trend is 0.10°C per decade since 1997, 0.06°C per decade since 1998, and 0.18°C per decade since 1999. Note that changing the starting date by a single year from 1998 to 1999 triples the UAH TLT trend.

If we heed the findings of Santer et al. and examine at least 17 years worth of data, the trend over that period is positive in both UAH (0.14°C per decade) and RSS (0.07°C per decade).  Dr. Pielke subsequently criticized the application of a linear trend to this data:

"My view, is that focusing on a linear trend with respect to a actual nonlinear signal is a substantial oversimplication of how we should expect the climate sytstem to behave both naturally, and in response to the diversity of human climate forcings."

However, over such a short timescale, the forcings are not significantly non-linear, and thus calculating the linear trend is appropriate.  In fact, it's an approach that Dr. Pielke himself frequently implements (i.e. here and here and here and here).  When asked for evidence that the short-term forcing is significantly non-linear, Dr. Pielke responded that a linear trend does not explain all of the "ups and downs" in the data.  However, the ups and downs in the short-term are due to natural variability, and are the reason why Santer et al. concluded that we must examine at least 17 years worth of data to identify the human signal.  While the longer-term trend might not accurately be evaluated with a linear fit, in the short-term, it's a reasonable approximation.

Selective Vision

The animation below illustrates the problem with focusing on such short timespans.  The first frame shows the data Dr. Pielke has focused on - RSS data since 1998  (plus the linear trend) in blue.  The following frame shows what the data looks like if we instead choose UAH data since 1999 (in green).  Note that we are not advocating this choice, but simply showing what a large difference such a small change in start date can make.  The third frame shows the entire UAH and RSS record.

MSU cherries

Even Shorter Timeframes

Dr. Pielke has more recently suggested examining the TLT data since 2002:

"I suggest that the hypothesis be that

"The lower tropospheric global annual average temperature trend (TLT) from 2002 until now cannot distinguished from a zero trend."

...and the trends during this time period are different than the trends earlier in the time period. "

However, as Dikran noted in response, it's entirely possible that over such a short timeframe, short-term noise such as ENSO and solar cycles may have masked the continuing long-term global warming trend.  Thus testing whether the trend since 2002 can be distinguished from zero:

"is not a particularly interesting hypothesis for the simple reason that the statistical power of the test is very low because the timespan over which the trend is computed is too short."

The signal-to-noise ratio is even less from 2002 to Present than 1998 to Present.  Dr. Pielke is moving in the wrong direction, examining less data rather than more.

There are going to be short-term periods in which the noise dampens the underlying long-term signal, and periods when the noise amplifies it.  If we're going to examine such short periods of data, we at least must filter out the effects which cause short-term noise. 

Removing Exogeneous Factors

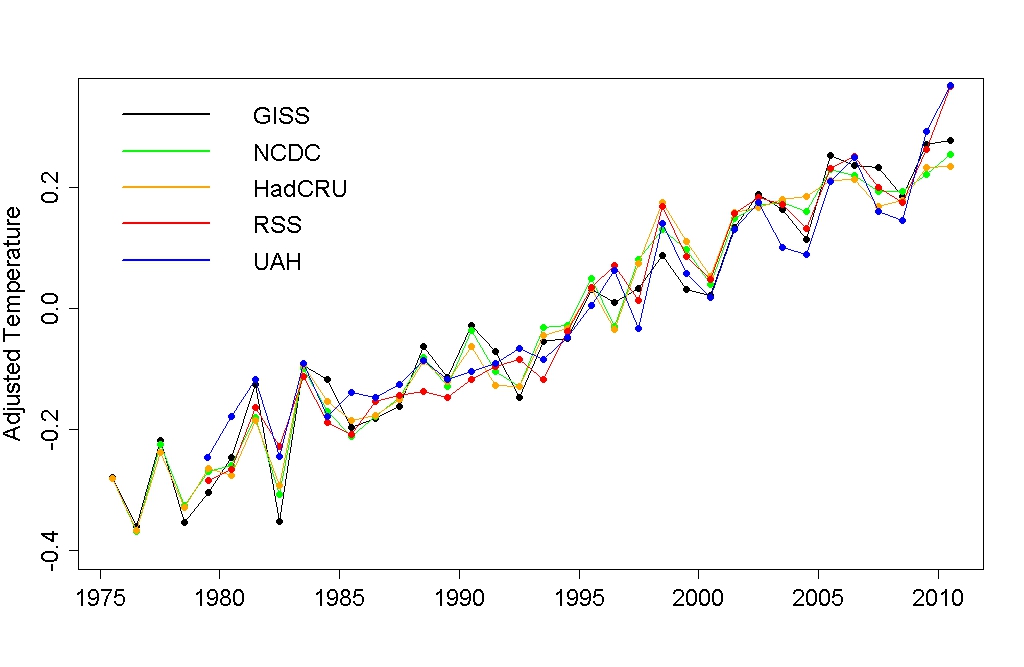
Tamino has attempted this analysis by removing a number of exogeneous factors (ENSO, volanic, solar).  He found that the long-term warming trend continues in both UAH and RSS, which have been temporarily dampened by those short-term effects over the past ~decade (Figure 4).

tamino analysis

Figure 4: TLT and surface temperature data sets with exogeneous factors removed by tamino

Summary

In his blog post, both the data set and start date Dr. Pielke chose minimized the short-term TLT trend.  Pielke was well aware of the strong El Niño in 1998, noting it in his post, and yet he chose this year as the start date of his analysis anyway.

It's also unclear why Dr. Pielke chose to make this 'no trend in 13 years' argument in a post commenting on Santer et al. (2011) to begin with, since the paper demonstrates that at least 17 years of data are necessary to evaluate the human influence on the TLT trend.  Dr. Pielke also didn't examine why the short-term TLT trend has slowed over the past decade, as was done in Kaufmann (2011), for example. 

The main take-home point here is that analysing short periods of data is fraught with challenges due to the short-term noise.  It's entirely expected that over periods on the order of a decade, there will be times of little warming in surface temperatures, as Santer et al. (2011) demonstrated.  We are currently in the midst of one of those periods.  Over the past decade, solar activity has been low, anthropogenic aerosol emissions have risen, and ENSO has been primarily in its negative phase.  Thus it's not unexpected that surface temperature warming has slowed, and when we account for these factors, we see that the underlying long-term warming trend continues.  As tamino noted when analysing all the main surface temperature and TLT data sets (emphasis added):

"None of the [most recent] 10-year trends is “statistically significant” but that’s only because the uncertainties are so large — 10 years isn’t long enough to determine the warming trend with sufficient precision. Note that for each data set, the full-sample (about 30 years) trend is within the confidence interval of the 10-year trend — so there’s no evidence, from any of the data sets, that the trend over the last decade is different from the modern global warming trend."

0 0

Printable Version  |  Link to this page

Comments

Prev  1  2  3  

Comments 101 to 140 out of 140:

  1. Dikran, I'll look into that, but it will take a while. The significance of a trend of N years will depend on the periods of natural cycles and quasi-cycles as compared to N. Those cycles can be determined purely empirically by examining a long data set or semi-empirically by examining the mechanics of cycles themselves (PDO, ENSO, etc) their effect on GAT.
    0 0
  2. Eric (skeptic) Fine, but you will need to perform a statistical hypothesis test to determine whether there actually is a cycle in the data where there is no physical theory that can explain the observed magnitude of the effect. You also need to show that the cyclic behaviour is not the result of a coincidence of non-cyclic changes in the observed forcings for which there exist phsyical theories that do explain the observed magnitude of the effect (for instance that changes in solar forcing explain much of the warming in the first half of the 20th century, according to the IPCC WG1 report). If you think cycles can be determined purely empirically then that is only true in the absence of physical explanations, and even then you need to be able to show there is statistically significant evidence for the existence of the cycles, and even then you need to acknowledge that it is only a correllation not a causal link.
    0 0
  3. Dikran, up thread you distinguished forcing changes from what you called "natural variations". I presumed that what you meant by "natural variations" was primarily the changes in ocean-atmosphere exchange that result in atmospheric temperature changes on a quasi-periodic basis. If I use that definition I would have to account for solar, aerosol and other forcing changes when I look at the long temperature series (subtract them out). Then I would analyze the periods of the remaining changes to determine the number of years that would indicate a statistically significant change independent of those natural variations. My claim would then be that such a statistically significant change was caused by a forcing change. Does that appear to be valid?
    0 0
  4. Eric (skeptic) If you are looking at a period that is relatively short compared to the characteristic timescale on which the forcings change (e.g. a couple of decades or less), then it is probably O.K. not to subtract out the effects of the relevant forcings. If you want to assert cycles on longer timescales then you need either to show there is a physical mechanism that can plausibly explain the magnitude of effect and/or control for the change in forcings.
    0 0
  5. Dikran, thanks. And sorry, that was Dana (#71), not you I was referring to.
    0 0
  6. Pielkesr. Just a few points that you might like to consider on your own threads, as you seem to have declined to continue here. First, I said:
    If Pielke Snr has the reference for the work that the planet has in fact not warmed since 1998 (or whenever) I would be most interested to read it.
    to which you replied:
    I have never said that. What I have reported on is the limited warming in the upper oceans in recent years (since 2004) which is clearly evident in http://oceans.pmel.noaa.gov/.
    The thing is, I was responding to your claim:
    However, it is trivial in my view (and does not need any statistical evaluation) to see that the warming has halted, with this being clearly seen in the RSS Figure 7 in http://www.ssmi.com/msu/msu_data_description.html#channels [My emboldened emphasis]
    a claim that was immediately preceded by the statement:
    First, I am NOT saying anything about the effect of the lack of warming in the global-annual average surface temperature since 2002 or 1999 (or whatever start year) on the long term trend. I agree it is too short of a record.
    which (together with the subsequent sentence) would seem to indicate, despite your protestations to the contrary, that you were commenting on surface temperature, and on intervals starting in 2002, or 1999 (or whenever...). Second point, by your own words you say:
    ...the global average temperature trend in the lower troposphere has been nearly flat as shown, for example, in the figure below from the RSS MSU data...There has been NO long-term trend since the large El Nino in 1998. That’s 13 years.
    You are again refering to a temperature record (and to a time period that commences prior to 2004), which is fine, but (to repeat) you say here:
    However, it is trivial in my view (and does not need any statistical evaluation) to see that the warming has halted, with this being clearly seen in the RSS Figure 7 in http://www.ssmi.com/msu/msu_data_description.html#channels.
    Repeatedly, you refer to atmospheric temperature records, but you then go on to make a claim about heat and how there has been no "warming" since 2002. As I, others, and even yourself have indicated on this thread, temperature and heat (and attendant changes thereof) are different beasts. A hiatus in temperature trajectory does not mean that there has been a similar pause in planetary warming. Again, I ask how one can use a statistically insignificant time interval in a temperature record to make a claim about planetary warming - a concept that relates to heat? You say:
    What I presume everyone will agree with is that from 2003 onward, the most appropriate diagnostic to monitor global warming is the ocean heat content changes. If we can agree on that (and since you use the bath tub analogy which involves heat in Joules), than this thread and the others would have been time well spent debating.
    I would agree that it is a part of a suite of parameters with which to monitor global warming, but as many others have pointed out recently here and elsewhere even OHC measurements have their pitfalls (a travesty, I say...!). And yet, you have made a claim that "warming has halted". So, again, upon what empirical basis do you make this claim? How do you know that "there are no more Joules in the climate system" after whatever the statistically-insignificant time period is to which you refer? Third point: how many 9 year intervals in the global surface temperature record show trends "different than the trend for the [23 year] time period [previous]"? What is the implication of the answer to the preceding question?
    0 0
  7. It apears that some people are having difficulty with short term trends. The recent trend (let's choose 10 years for simplicity) is not significantly different form zero. That is different than saying it is not significant. There have been other recent periods where similar trends have occurred (winter 1987-1997, 1977-1987, and pre-1980). There have also been 10-year periods with a statistically significant warming trend (1973 or 4 - 1983 or 4, and any 10-year period starting from 1990 - 1994). There was a 10-year period from the end of 1981 - 1991 which falls just short of significance. The answer is that the short term trend is statistically significant from other short term trends witnessed recently. The more appropriate question would be why are the short term trends different. Some here (on other threads) have alluded to the 11-year solar cycle s affecting the short-term temperature trends. This would seem plausible as the largest 10-year trends were observed ending on 12/83, 9/91, and 3/02. Somewhat corresponding with the sunspot maxima on 10/79, 8/90 and 12/01.
    0 0
  8. Dikran, Daniel, Dana, Tom C., and readers Dr. Pielke says, "I will be signing off with this thread here, but will have several questions for SkS in the next day or so on my weblog that I will invite you to discuss on SkS." Given that Dr. Pielke has continued to evade answering pertinent and reasonable questions put to him, his strawmen arguments, his shifting of goal posts, his propensity to misrepresent our position, his questioning the scientific and statistical understanding of the knowledgeable posters here, why on earth would we continue with this "discussion" or take more of our time to answer questions posed to us by Dr. Pielke? He has not offered us the same respect and courtesy, and quite frankly at this point I have no interest in engaging in what seems to be an endless faux debate and arguing in circles. With that all said, I am heartened that Dr. Pielke agrees that we need to reduce our GHG emissions, and I look forward to Dr. Pielke providing policy makers with unambiguous and crystal clear messaging on that aspect both on his blog and when appearing before government.
    0 0
  9. Bernard J@106, Thank you for taking the time (and it does take time to weed out the details and chronology) to very nicely demonstrate the goal post shifting and strawmen arguments that we have all had to deal with on this and other threads by Dr. Pielke. I find his behaviour and arguments about the science very unfortunate, and as a fellow scientist, very troubling and underwhelming.
    0 0
  10. Albatross. Such argument is "very troubling and underwhelming" indeed. It's the greasy pig version of discourse, and the very antithesis of real scientific discussion. I also agree with your preceding sentiment. If Pielke Snr consistently chooses to continually evade the fundamental points of this whole exchange, then I too will disengage from chasing his tail. It's been an interesting exercise neverthless, even though I only chipped in my $0.02 at the end. Still, I will walk away from this discussion with no shame. I wonder if Pielke Snr could genuinely do the same thing...
    0 0
  11. Albatross I am a big believer in the "golden rule" (do unto others as you would have them do unto you" (or words to that effect). As a scientists, if I were wrong on an important scientific issue and having difficulty understanding the problem, then I would be extremely grateful to someone who patiently carried on trying to explain my error however long it took, if that was what was required for me to see where I was going wrong. I'd be even more grateful to them for doing so had I not behaved as well as perhaps I should - we are all only too human. While Prof. Pielke responds to questions in a manner that allows alternative explainations of the statistical issues there is value in continuing. However it would help if direct answers were given to direct questions.
    0 0
  12. Dana Hicks wrote "The answer is that the short term trend is statistically significant from other short term trends witnessed recently." O.K., if you claim that it is statistically significant, then state the assumptions and give the calculation of the p-value that demonstrates the difference is statistically significant.
    0 0
  13. Eric, you might like to review the statistical analysis at tamino on this approach.
    0 0
  14. Eric, I seem to recall Tamino doing a post about empirically determining cyclic behaviour in a timeseries - it is not as easy as some think, and more obviously hard if the proposed cycle wavelength is a relatively large fraction of the dataset length. Can't find it now, but this and this may be interesting for looking at extracting periodic behaviour. Dikran's point about physical mechanisms is also very relevant. I came across the following chart at the end of another superb post of Tamino's: Dr Pielke and others may be interested in reading it. It shows "... trends over the most recent 10-year period. Here they are (plotted in blue), compared to the trend over the entire time span common to all data sets (plotted in red) [1979-end 2010 when posted]" None of the 10-year trends (to 2010) was significant, yet all the 30-year trends are not only significant, but agree closely, within error. I was still most disappointed that Dr Pielke failed to answer the direct questions about the surface temperature data. I'm also disappointed in his attempts to divert via suggesting that the heat content of the climate system can be determined on a yearly basis. That would be true if we were monitoring every possible heat sink on the planet to a high degree of accuracy, deep oceans included, but we are not (though this is improving). His chosen measure does not cover all locations where Joules go, and is thus no better than anyone else's measure of global warming, despite his protestations to the contrary. His focus on 0-700m surface ocean, avoiding the visible warming deeper in the ocean, is a cherry-pick, just like his focus on 2002 to present for the surface temperatures.
    0 0
  15. "Eric, I seem to recall Tamino doing a post about empirically determining cyclic behaviour in a timeseries. Can't find it now" Perhaps this one ?
    0 0
  16. Yep, thanks Papy, that's the one I was thinking of!
    0 0
  17. Scaddenp (#113), that's not quite the same problem. I'm looking for the statistical significance of trend changes based on their amplitude and length of time. If, for example, prior periods show longer "flattening" or whatever the 2002-present is called, then that lowers the statistical significance of the current flattening, it is really that simple, although calculating the actual significance is not. Skywatcher, your last link in #114 is more on target as it compares 10 year trends to 30 (the prior PCA is not relevant to the trend and error bars) but he doesn't fully explain why the 10 year trends are not statistically significant. It does appear that he is plotting two standard deviations of the 10 year (blue) and 30 series (red) correcting the std deviations by the autocorrelation of the 30 year series which seems reasonable. The link you were thinking of that Papy found is even better but needs a couple more steps. For one thing the Fourier transform only finds truly periodic signals but some other transform may find the quasiperiodic signals, perhaps wavelet transforms. Then that analysis has to be reconciled with the understanding of the real world mechanisms that cause the quasi-cycles.
    0 0
  18. Very close though - you are looking for changes in unaccounted variability. Remove the known causes of variation, then you can look for the significance of other natural variability. Seems Tamino's model could be used for that.
    0 0
  19. For your first point, how about the below graph? 10-year 'trends' as low as that between 2002 and present are not rare even in the past 30 years. A few are plotted below: Add to that the fact that we're presently above the long-term trend for UAH, and have been for most of the past decade, and you have some (non-significant) evidence that we're actually accelerating with respect to the long-term trend. This is supported by the increase in decadal average temperatures. Not only was the 2000s the hottest decade, it was hotter than you would have expected given the difference bewtween the 1970s and 1980s, and the 1980s to 1990s. With 2011's big La Nina not depressing temperatures all that much, is there any serious doubt that warming continues?
    0 0
  20. Yes scaddenp, pretty close. But I could even more easily detrend any series to get the same information I need (natural variations). The graph with various trends shown by skywatcher illustrates my point nicely. the more prior flattenings there are the less statistically significant the current one is. You could also combine the first two and show a longer flattening with similar slope to the present. The quantification still eludes me, but I would note that we are looking at a relatively small number of "independent" samples (the number of relatively non-overlapped 10+/- year trends in the data set depicted above), so not a lot of "rolls of the dice", and thus not a very meaty probability distribution. Also my hypothesis seems relatively weak, namely that 10 year flattenings are possible from natural variations (not well-defined).
    0 0
  21. The point is that it is still unscientific to look at the noise in the dataset and mistake noise variations for trends. We actually expect to see 'flat' episodes like the ones I've highlighted, even in the rising trend (e.g. Santer). We are a very long way from saying 'warming has halted' precisely because such short-term flat trends due to noise, exist and are common. We are now and have been above the long-term trend for most of the past decade, hardly indicating that warming has decelerated in the slightest. You can add that to analysis such as Tamino's, highlighted in the OP, where you can quantify the extent and magnitude of the drivers producing the 'noise' around the 'signal' of GHG warming. You can add that these factors are consistent with the magnitude of the drivers causing the noise (ENSO, volcanic, solar), and consistent with the expected sensitivity variations of the different temperature series (surface vs TLT etc), and you have a compelling story. That story is not of warming "halting", or anything remotely like it.
    0 0
  22. sky#121: "We actually expect to see 'flat' episodes like the ones I've highlighted, even in the rising trend" I don't know why this is such a difficult concept to communicate. Perhaps a generic example will help; such as the time series analysis is presented here. The data clearly have a rising overall trend with conspicuous flat spots. The discussion that follows is quite straightforward, although DM could offer a more informed opinion. Nowhere in the discussion is there any mention of the flat spots as being significant indicators of changes in trend.
    0 0
  23. Skywatcher, I agree, just need to define noise in your hypothesis: all forcings and natural variation other than GHG forcing. Muoncounter, the concept is simple but not quantifying the statistical significance of various combinations of X and Y in your picture. A negative trend in Y of roughly 2 or less for an X of less than 4 or so doesn't seem significant. A flat trend in Y for an X of 30 may not be significant (has the low sample size caveat).
    0 0
  24. Eric (skeptic) The noise is the natural variability, the unforced response of the climate. The signal is the forced response of the climate. At least that is the case if you are interested in looking at the response of the climate to a change in the forcings. However, if you are pursuing a strictly statistical approach, then the assumption is that the data can be resaonably modelled as a linear trend with additive autocorrelated noise (Tamino suggests an ARMA(1,1) noise model is appropriate). So statistically the estimate of the noise is the residuals of trend. If we actually could specify what was noise we would know the signal with no uncertainty. The problem is that we can't, so a statistical model is used. If it were always easy to decide what kind of model we should use, or which vraiables we need to control for or subtract of prior to analysis, there would be no need for statisticians (who spend several years of their life learning the basics). Perhaps it would be better if you were to state the hypothesis you want to test and state the dataset you intend to use and the time-period over which you want to perform the analysis, and perhaps it would be easier to provide some more concrete advice.
    0 0
  25. I think everyone should recognize the rather startling conclusion that I have discovered... there has been no appreciable warming whatsoever since 1980. None. In fact, the globe seems to have cooled by about 0.1˚C. To recognize this, since we all know that any one particular data set is subject to assumptions and errors, I have instead used all four major global mean temperature sources: HADCRUT, GISTEMP, UAH and RSS. I have used a different data set for a different time period (selected based on an arcane and intricate use of my eyecrometer that I don't have the space to go into here... I will discuss it in my soon to be published peer-reviewed paper, as well as the ever so informative and accurate press release that will announce its publication). Since the data sets do not share the same baseline, at the breaks I have "homogenized" the data by lining up the start of each new series with the old one. The result is rather startling. As I said. No warming at all since 1980! In fact, I see clear cooling! How can anyone argue with this? (Wow! Being skeptical is easy.)
    0 0
  26. [In case anyone missed the perhaps too subtle point, if you hand pick a short enough time series and the exact right data set(s), you can make the data say anything.]
    0 0
  27. Sphaerica you are a very naughty person indeed! ;o) "If you torture the data enough, nature will always confess." Ronald Coase (quoted from Coase, R. H. 1982. How should economists chose? American Enterprise Institute, Washington, D. C.)
    0 0
  28. Sphaerica: How long before your graph starts showing up in the usual places with the headline 'the new SkS temperature reconstruction shows no warming'?
    0 0
  29. 127, Dikran, 128, muoncounter, I don't make the numbers up, I merely bend them to my will. To paraphrase Humpty Dumpty:
    `And only one for birthday presents, you know. There’s glory 57 for you!’ ‘I don’t know what you mean by “glory 57”,’ Alice said. Humpty Dumpty smiled contemptuously. ‘Of course you don’t — till I tell you. I meant “there’s a nice knock-down argument for you the globe is not warming!”’ ‘But “glory 57” doesn’t mean “a nice knock-down argument the globe is not warming”,’ Alice objected. ‘When I use a word number,’ Humpty Dumpty said, in rather a scornful tone, ‘it means just what I choose it to mean — neither more nor less.’ ‘The question is,’ said Alice, ‘whether you can make words numbers mean so many different things.’ ‘The question is,’ said Humpty Dumpty, ‘which is to be master — that’s all.’
    0 0
  30. All I can say Sphaerica is: "Wow! This could revolutionize AGW science". That reminds me, whatever happened to Salby's "paper" that Judith Curry was fawning over? PS: You make an excellent point with that graph @ 125 though, well done.
    0 0
  31. Dr. Pielke continues to confuse me, saying @88
    "If, for example, there are no more Joules in the climate system after one year, the heating (in terms of an annual average) there is no accumulation of heat that time period"
    However, Dr. Pielke has also admitted that he was wrong to say 'no Joules' had accumulated in the climate system, and even when looking exclusively at the upper 700 meters of OHC. So why give an example of something which has not happened? It seems like Dr. Pielke is simultaneously arguing that global warming has and has not stopped. The latter argument is the correct one.
    0 0
  32. re: dana @131 If you take it as an hypothetical, then it seems harmless. But why would he choose that as his hypothetical? Whenever I read that comment of Dr. Pielke's, I keep tripping over the phrase "but it [is] certainly not "noise" as long as the measurements are robust". What does he mean by "robust"? [Typing in my best Church Lady voice] Could it be - Satan statistical significance? Going back to the observations/interpretations/conclusions distinction, "robust" is a conclusion. How does he know it is robust? Dr. Pielke keeps presenting interpretation as if it is a conclusion. [Note: apologies if anyone is offended by the reference to Satan - no reference to anyone in this discussion is intended. if you're not familiar with Saturday Night Live of years ago, the quote may not make sense.]
    0 0
    Response:

    [DB] Maybe this will remind them.

  33. Bob, I second muon -- take it over to WUWT under a different name, and I guarantee it'll be trumpeted in the US Congress in three days. Curry will undoubtedly give it another "wow".
    0 0
  34. The tail end of new the BEST temperature reconstruction: is not very friendly to the 'warming stopped in ____' crowd, nor is it supportive of Dr. Pielke's '2002 change in trend is significant' interpretation. Put in the perspective and detail of the BEST graphic, short term downtrends are a regular feature of the temperature record, as there are too many of these 'blips' to count. Despite the jagged appearance, the overall trend is up: since ~1970, ~1 degree in 40 years.
    0 0
  35. The BEST time series data are now available at Wood for Trees. That '2002 change in trend' looks even less robust with these data: The short line segment (mid 2001-mid 2008) appears parallel to the 40 year trend. The only way to make it look like a change in trend is to include the last 2 1/2 years; at that point the short linear fit is (still) just about meaningless. If anyone is counting, that 40 year trend is very close to 0.25 deg C/decade.
    0 0
  36. The BEST trend since 1978 is also 0.29°C per decade. We've got a post in the works on the subject. The BEST trend over that period is also identical to the NOAA land-only trend.
    0 0
  37. In a world where stupidity trumps parody, I might as well pre-empt the inevitable bastardisation of the WfT option for the BEST [sic] data... Et voilà! (-snip-)Richard Muller's data show that there has been no warming since 1970; only a series of stable temperature periods, until 2005, since which there has been precipitous cooling. (-snip-). You saw it first on Skeptical Science.
    0 0
    Moderator Response:

    [DB] Thanks for the pre-empt.  Apologies, but somewhere a line was crossed; too-personal commentary snipped.

  38. Bernard J#137: "a world where stupidity trumps parody," Nah, parody always wins. Or is at least more entertaining. The relevant cherrypick is the interval from 2002 forward. -- source A time period starting with an anomalous warm (2002) and ending on an anomalous cool (winter 2010) shows warming 'on hiatus'? Shazbot! Of course, for parody to be effective, there must be a point of irony: Here, the BEST data do not include the summers 2010 - 2011, which (if memory serves) were quite warm. The August worldwide land surface temperature was 0.84°C (1.51°F) above the 20th century average of 13.8°C (56.9°F)—the second warmest August on record, behind 1998.
    0 0
  39. Nah, parody always wins. Or is at least more entertaining. The relevant cherrypick is the interval from 2002 forward.
    And that is exactly what happened, to wit: Curry seemed to have jumped the shark whilst simultaneously riding a shark. Sad thing is, I don't think that it was parody... [Not sure how the double posting occurred - apologies.]
    0 0
  40. BernardJ#139: "Curry seemed to have jumped the shark whilst simultaneously riding a shark." Considering she co-authored some of the BEST papers, that is the pair of positions she's trying to occupy. Only a very high-level expert can have opinions in Two Places at Once, Without Being Anywhere at All. (Oddly enough, it was a different kind of climate control that featured prominently in that particular parody. Careful study of that literature (from 1969) reveals the guiding principle of these folks: 'the sun isn't setting, its the horizon that's moving up!' That is earth science as taught at at More Science High). But it is self-parody, as the BEST website FAQ advises under the question Has global warming stopped?: the decadal fluctuations are too large to allow us to make decisive conclusions about long term trends based on close examination of periods as short as 13 to 15 years.
    0 0
  41. Dana: Thumbs-up for spelling out that the acronym "TLT" means "Temperature of the Lower Troposphere" in the opening paragraph of your article. Thumbs down for not defining what the term "temperature of the lower troposphere" means. I, for one, do not know what the term actually means. Is TLT different from land and ocean temperature? Is it a combination of the two? If I do not understand what "temperature of the lower troposphere" really means, I suspect that many of the readers of this article and its comment thread are "also flying in the dark" so to be speak. If our mission is to explain the science to the average person, we need to avoid playing "inside baseball" with acronyms and scientific terms.
    0 0

Prev  1  2  3  

You need to be logged in to post a comment. Login via the left margin or if you're new, register here.


The Consensus Project Website

THE ESCALATOR

(free to republish)


© Copyright 2024 John Cook
Home | Translations | About Us | Privacy | Contact Us