Climate Science Glossary

Term Lookup

Enter a term in the search box to find its definition.

Settings

Use the controls in the far right panel to increase or decrease the number of terms automatically displayed (or to completely turn that feature off).

Term Lookup

Settings


All IPCC definitions taken from Climate Change 2007: The Physical Science Basis. Working Group I Contribution to the Fourth Assessment Report of the Intergovernmental Panel on Climate Change, Annex I, Glossary, pp. 941-954. Cambridge University Press.

Home Arguments Software Resources Comments The Consensus Project Translations About Support

Bluesky Facebook LinkedIn Mastodon MeWe

Twitter YouTube RSS Posts RSS Comments Email Subscribe


Climate's changed before
It's the sun
It's not bad
There is no consensus
It's cooling
Models are unreliable
Temp record is unreliable
Animals and plants can adapt
It hasn't warmed since 1998
Antarctica is gaining ice
View All Arguments...


Username
Password
New? Register here
Forgot your password?

Latest Posts

Archives

Misleading Daily Mail Article Pre-Bunked by Nuccitelli et al. (2012)

Posted on 17 October 2012 by dana1981

This post has also been re-published by The Guardian.

The British newspaper/tabloid The Dail Mail and its writer David Rose are notorious for publishing misleading (at best) climate-related articles, as we have discussed previously here, for example.  They have recently struck again, claiming that according to a "quietly released" Met Office report, global warming stopped 16 years ago (a myth which Skeptical Science debunks here and here).  This assertion is entirely fabricated, as the Met Office explained by publishing David Rose's inquiry and the Met Office's responses.

"Firstly, the Met Office has not issued a report on this issue. We can only assume the article is referring to the completion of work to update the HadCRUT4 global temperature dataset compiled by ourselves and the University of East Anglia’s Climate Research Unit.

We announced that this work was going on in March and it was finished this week. You can see the HadCRUT4 website here."

Rose's factually challenged article was predictably reproduced uncritically by the usual climate denial blogs and referenced by Fox News, perhaps in an attempt to distract from this year's record-breaking Arctic sea ice minimum.  However, virtually every point made in the article was factually incorrect, as Rose would have known if he were a Skeptical Science reader, because we recently pre-bunked his piece.

Rose Tries to Lead the Witness Down the Up Escalator

Rose attempted to elicit a statement from the Met Office by asking a question which would be described in court as "leading the witness":

"First, please confirm that they do indeed reveal no warming trend since 1997."

The Skeptical Science temperature trend calculator can be used to test this question.  The trend in the HadCRUT4 global surface temperature dataset since 1997 is 0.084 ± 0.152°C per decade (although we have not yet updated the HadCRUT4 data, the GISS and NCDC datasts show a similar warming trend since 1997).  While the trend is not statistically significant, the central value is positive, meaning the average surface temperature has most likely warmed over this period.

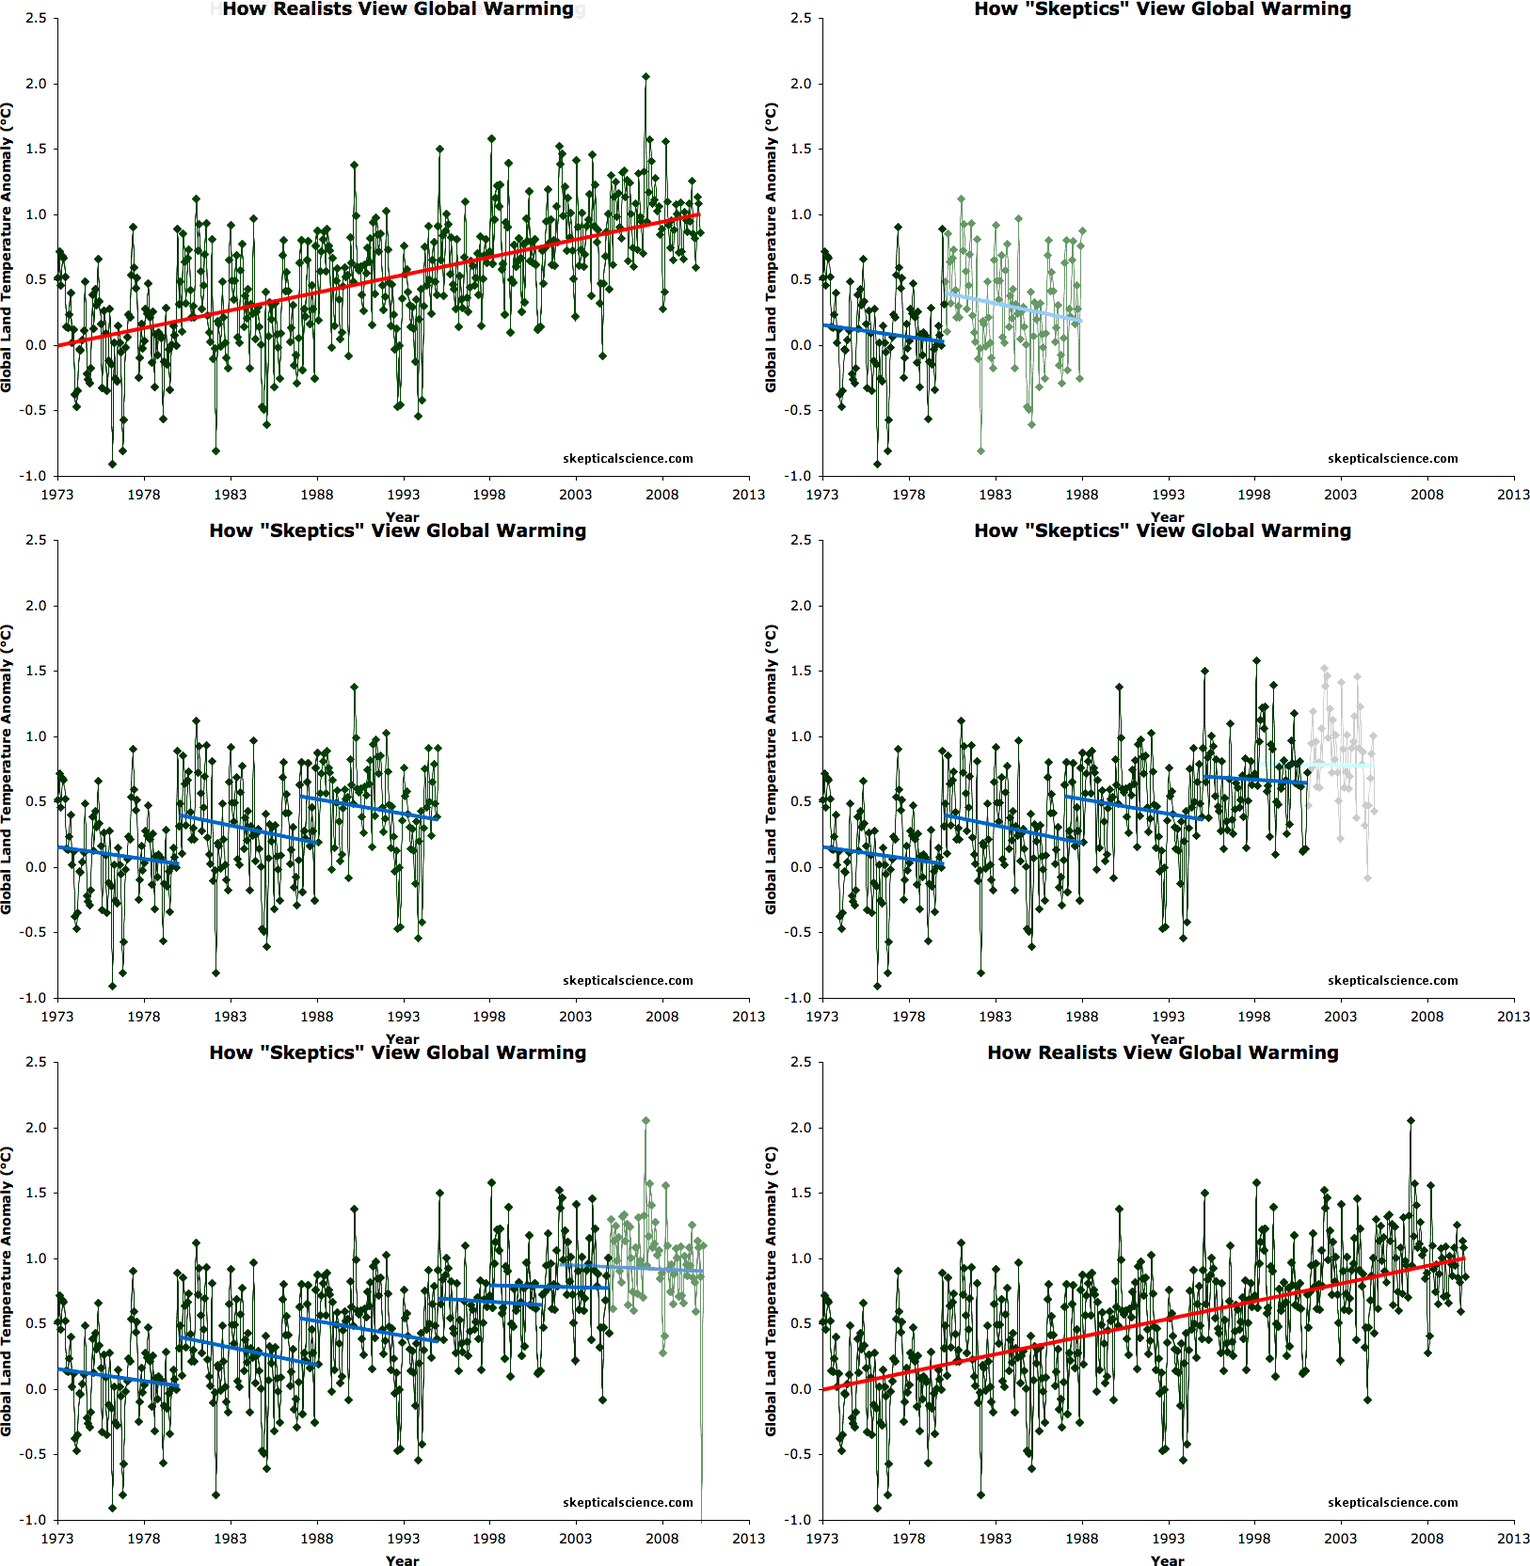
The Met Office also explained that Rose is essentially trying to go down the up escalator (Figure 1) by focusing on short-term noise while ignoring the long-term trend.

"Over the last 140 years global surface temperatures have risen by about 0.8ºC. However, within this record there have been several periods lasting a decade or more during which temperatures have risen very slowly or cooled. The current period of reduced warming is not unprecedented and 15 year long periods are not unusual."

skeptics v realists v3

Figure 1: BEST land-only surface temperature data (green) with linear trends applied to the timeframes 1973 to 1980, 1980 to 1988, 1988 to 1995, 1995 to 2001, 1998 to 2005, 2002 to 2010 (blue), and 1973 to 2010 (red).

Rose and Curry Ignore 90+% of Global Warming

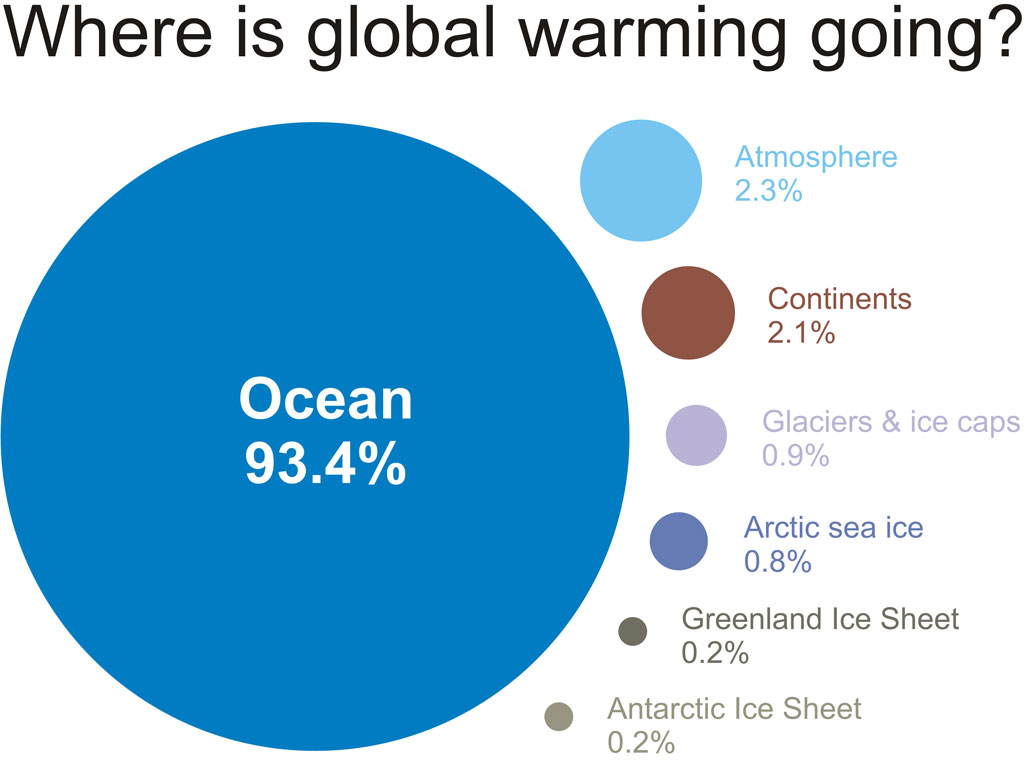
Perhaps most importantly, focusing on surface air temperatures misses more than 90% of the overall warming of the planet (Figure 2).

where is warming going

Figure 2: Components of  global warming for the period 1993 to 2003 calculated from IPCC AR4 5.2.2.3.

Rose quotes Georgia Tech climate scientist Judith Curry (whose claims we have previously examined here and here) as asserting,

"The new data confirms the existence of a pause in global warming"

However, this claim is simply incorrect.  Nuccitelli et al. (2012) considered the warming of the oceans (both shallow and deep), land, atmosphere, and ice, and showed that global warming has not slowed in recent years (Figure 3).
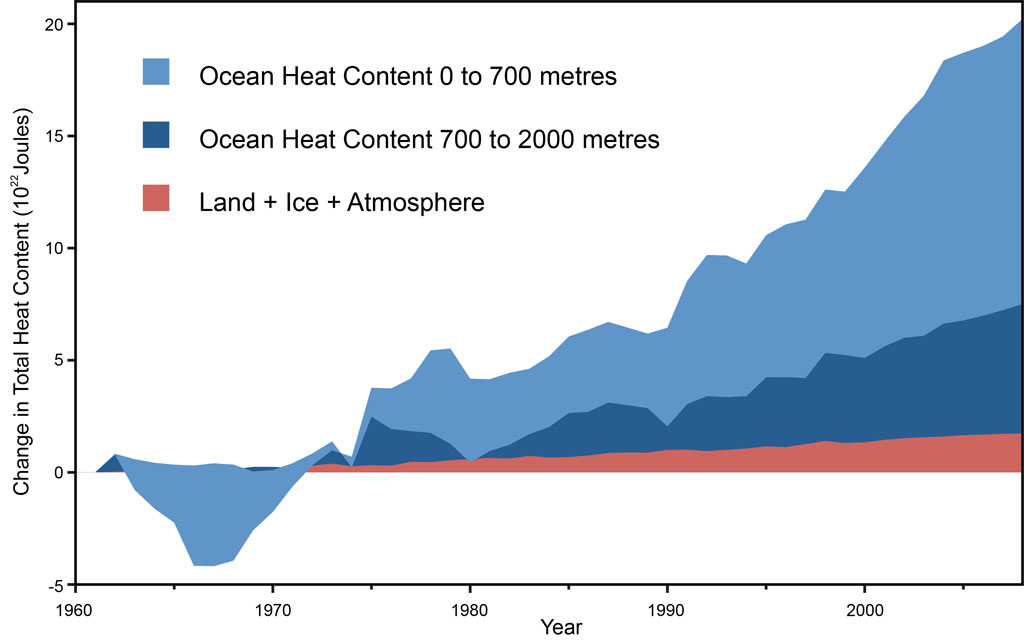
 

Fig 1Figure 3: Land, atmosphere, and ice heating (red), 0-700 meter OHC increase (light blue), 700-2,000 meter OHC increase (dark blue).  From Nuccitelli et al. (2012).

Were Rose and Curry Skeptical Science readers, they would have known several days prior to the publication of this article that the claim about global warming "pausing" in 1997 was pre-bunked by Nuccitelli et al., as Figure 3 clearly shows.

Curry Exaggerates Natural Variability

Rose also quotes Curry as saying,

"Natural variability has been shown over the past two decades to have a magnitude that dominates the greenhouse warming effect"

This statement is also incorrect.  There is always a point at which, as long as one only considers sufficiently short timeframes, a long-term signal will be smaller than the noise in the system, which appears to be Curry's argument here.  However, for global surface temperatures, that timeframe is less than the two decades Curry specified in this quote.

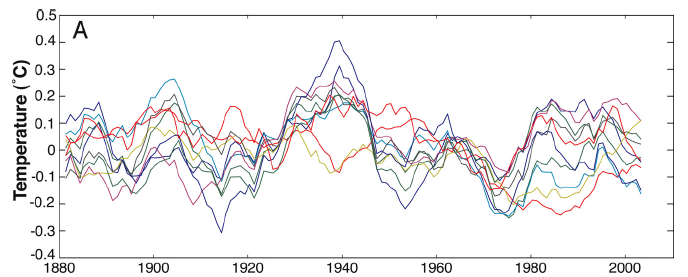
Even ignoring 90+% of global warming and only considering global surface temperatures, they have warmed 0.4°C over the past two decades, according to HadCRUT4.  Swanson et al. (2009) examined the role of natural variability on global surface temperatures and found that it rarely exceeds 0.2–0.3°C, and averages out to approximately zero over longer timeframes (Figure 4).

Swanson Tsonis variability

Figure 4: Estimation of the observed signature of internal variability in the observed 20th century global mean temperature in climate model simulations

Thus Curry is incorrect; even over a timeframe as short as the past two decades, the human-caused global surface warming signal has been larger than the natural variability of the global climate system.  And when we consider the warming of the planet as a whole (including the oceans), the warming signal is very clearly larger than the noise over this timeframe, as Figure 3 shows.

Rose Attacks Climate Models to Downplay the Climate Risk

Ultimately Rose elicits a quote from Curry to argue that climate models are exaggerating global warming:

"Professor Judith Curry...told The Mail on Sunday that it was clear that the computer models used to predict future warming were ‘deeply flawed’"

Rose and Curry are trying to argue that because global surface temperatures have not warmed as fast as the multi-model average in the IPCC report (0.2°C per decade), this somehow suggests the models are flawed.  However, the Met Office explained to Rose (prior to the publication of his article) why this notion is incorrect.

"The models exhibit large variations in the rate of warming from year to year and over a decade, owing to climate variations such as ENSO, the Atlantic Multi-Decadal Oscillation and Pacific Decadal Oscillation. So in that sense, such a period is not unexpected. It is not uncommon in the simulations for these periods to last up to 15 years, but longer periods are unlikely."

Over the past decade, aerosol emissions (which cause cooling by blocking sunlight) have risen, solar activity has been low, there has been a preponderance of La Niña events (which also cause short-term surface cooling), and heat has accumulated in the deep oceans.  Thus it is entirely unsurprising that these short-term effects all aligning in the cooling direction in recent years have offset much of the surface warming caused by human greenhouse gas emissions.

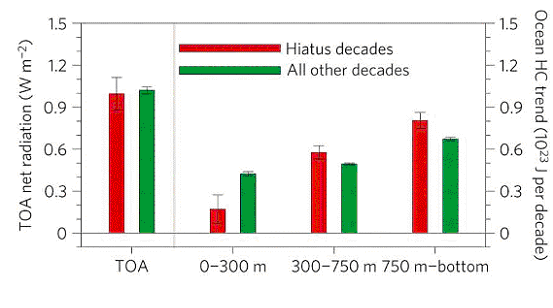
This result is in fact consistent with individual climate model runs.  Meehl et al. (2011) showed that during "Hiatus Decades," there is less warming of the surface air and shallow oceans, and more warming of the deeper oceans (Figure 5), precisely as we have observed over the past decade.

Meehl hiatus warming

Figure 5: Left: composite global linear trends for hiatus decades (red bars) and all other decades (green bars) for top of the atmosphere (TOA) net radiation (positive values denote net energy entering the system). Right: global ocean heat-content (HC) decadal trends (1023 Joules per decade) for the upper ocean (surface to 300 meters) and two deeper ocean layers (300 to 750 meters and 750 meters to the ocean floor), with error bars defined as +/- one standard error x1.86 to be consistent with a 5% significance level from a one-sided Student t-test.  From Meehl et al. (2011)

Rose Fails Economics 101

All of these misleading claims lead to Rose's ultimate argument in attacking carbon pricing and investments in green energy.

"And with the country committed by Act of Parliament to reducing CO2 by 80 per cent by 2050, a project that will cost hundreds of billions, the news that the world has got no warmer for the past 16 years comes as something of a shock...the evidence is beginning to suggest that it may be happening much slower than the catastrophists have claimed – a conclusion with enormous policy implications."

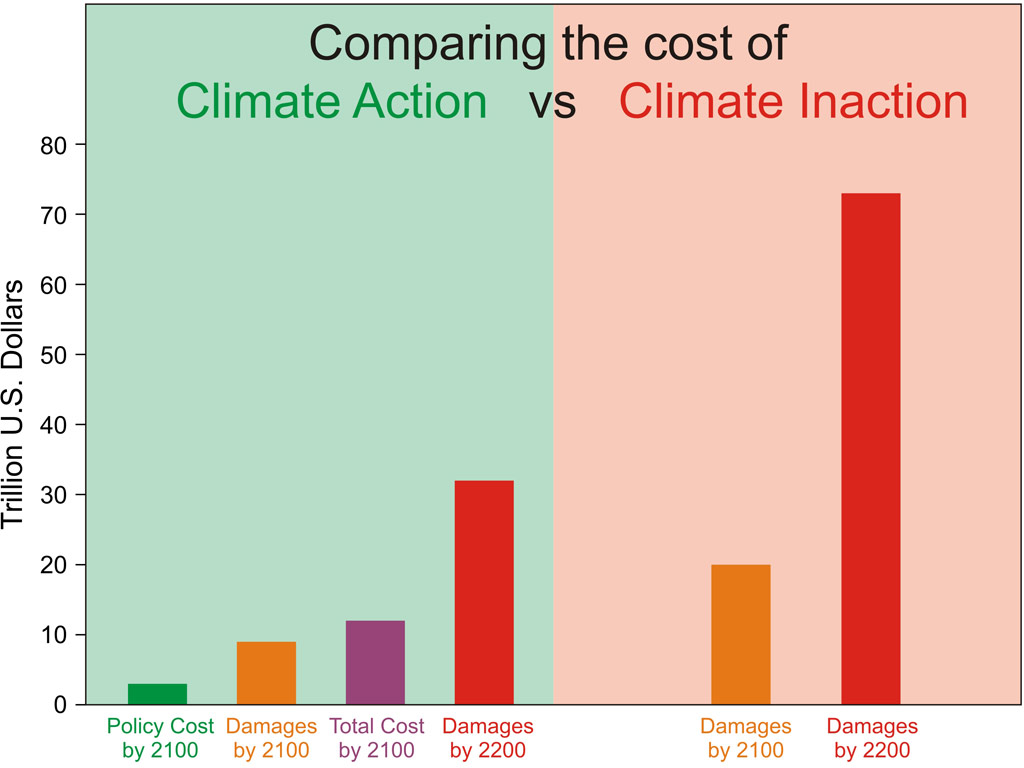
On the contrary, the Earth has warmed as much as expected, and economic research has consistently shown that putting a price on carbon emissions will result in a net benefit to the economy (Figure 6).  Pricing carbon emissions to account for the otherwise external costs of the damage they cause via climate change is 'Economics 101.'

action vs inaction costs

Figure 6: Approximate costs of climate action (green) and inaction (red) in 2100 and 2200. Sources: German Institute for Economic Research and Watkiss et al. 2005

Summary

To sum up, Rose and Curry were simply incorrect in virtually every assertion made in this Daily Mail article.

  • Global surface temperatures have most likely increased since 1997.
  • Focusing on short-term temperature changes confuses short-term noise and long-term signal.
  • Most global warming goes into heating the oceans, and as Nuccitelli et al. (2012) showed, global warming has not slowed.
  • Natural variability is much smaller than the long-term global warming signal, and smaller even than the global warming signal over the past two decades.
  • The slowed rate of global surface warming over the past decade is consistent with individual model runs, which show that these 'hiatus decades' are entirely expected.
  • Over the long-term, the Earth has warmed as much as expected.
  • Carbon pricing will result in a net benefit the economy as compared to doing nothing and trying to adapt to the consequences.

Also see debunkings of the Rose Daily Mail piece by Climate Progress, Carbon Brief, Potholer, and Media Matters.

0 0

Printable Version  |  Link to this page

Comments

Prev  1  2  

Comments 51 to 76 out of 76:

  1. Dana @37 and 38, This latest sad saga with Curry would be quite entertaining if this were not such a serious subject. If I were you I really would not be too concerned what someone who is wowed by Salby's misguided ideas or believes David Rose's misinformation articles to be "thought provoking". Perhaps I was too unclear earlier as to what is likely going on here. Curry and Rose have a symbiotic relationship. Rose promotes her and feeds her narcissism, she gives him the sound bites and credibility that he can used to mislead and misinform. I'm beginning to think Curry's indignance about being misrepresented by Rose is a ruse. Additionally, as Dikran Marsupial has accurately noted "Judith Curry demonstrates a fundamental lack of understanding about statistical hypothesis testing". That much is very evident when reading her posts. As for Curry trying to weave Trenberth's, Solomon's and Hansen's comments into her narrative. That is disingenuous on her part, because none of them assumes that the increase in global temperatures will be monotonic, and none of them assumes that periodic slow-downs or plateaus suggest that we are not heading for much discomfort and pain in the coming decades if we continue to increase greenhouse gas levels. What is more, using the Solomon quote is inappropriate because Solomon is talking about a shorter and different period than the period cherry-picked by Rose. Solomon was talking about the role of stratospheric water vapor on modulating global temperatures on a decadal scale, specifically their proposed role of cooling between 2000 and 2009, not 1997-2012. And as The Escalator shows one can easily find short-windows with cooling or no warming because of noise in the climate system. Finally, to my knowledge Hansen has not stated that there has been a significant slowdown. And in that quote Curry provides he does not do so either. In fact, Hansen et al. (2010) challenged Solomon's claim of a slowdown: "On the contrary, we conclude that there has been no reduction in the global warming trend of 0.15 C-0.20 c per decade that began in the late 1970s" If anyone doubts that Hansen is concerned they really should watch this incredible talk that Hansen gave at Ted recently. Curry is playing rhetorical games and misrepresenting her peers' positions by not providing the full context of their positions. That she is doing so is shameful and unprofessional.
    0 0
  2. Further to my above comment, ironically the article that Curry posts (apparently journal articles are not up to snuff for her to use as support for her claims, instead she is relying on a he-said-she-said reported in the media) to try justify her claim of the "pause", includes a statement that calls out the 1997-1998 El Nino start date (the same one used by Rose) as a cherry pick: "Researchers have long argued that using 1998 as a starting point was, then, unfair. "Climate scientists were right that it was a cherry-picked observation, starting with an El Niño and ending with a La Niña," said Robert Kaufmann, a geographer at Boston University who recently studied the hiatus period.." Ultimately what we have is a global radiation imbalance of about 0.6 Wm-2, and so long as there is an imbalance, the climate system will continue to accumulate energy and warm, not always at the same pace, but physics dictates that on time-scales of 20-30 years it must warm. It is not clear to me that Lean acknowledged the "pause" either. In the quote provided by Curry, Lean is instead speaking to the role of the sun in modulating global temperatures. The author claims that Lean attributes the "hiatus" to the sun, but nowhere does Lean explicitly state that. Also, there is a problem with that reasoning, because there was a solar maximum in 2002-2003, so if the sun were the culprit, one could only attribute a slowdown in temperatures after 2003, not since the 97-98 El Nino. Importantly, the warmest year on record, 2010, was observed when the sun was experiencing an unusually prolonged solar minimum. As per usual the "skeptics" (including Curry it seems) want to everyone to focus on the noise and ignore the long-term and much more important big picture.
    0 0
  3. If I might repost this comment I left on the Met office blog? While responding to one of the "climate has always varied and natural variability swamps the CO2 signal so AGW is insignificant" types, I came up with an analogy I haven't seen before which I think might be worth passing on for others to use when trying to communicate the subtleties of the sophistry being used to fool a too credulous public. I already know the analogy isn't exact, but it does have power to communicate an idea... ______________________________________________ “But the climate is always changing” Of course it is! Within limits. So what? Climate changes, and has changed, due to natural forcings and cyclic variabilities. That clearly demonstrates that it reacts to forcings. Sticking a load of buried then re-oxidised carbon back up there is imposing a long lasting forcing on the planet that steadily forces the climate to change. The physics shows that the C02 forcing is much larger than the orbital Milankovitch forcings that send Earth into and out of ice ages over millennia. I see several others have come on here and pulled the old “natural variability swamps any CO2 signal”. Did you all miss the analogy above between waves on a beach and the tide coming in? How hard was that to understand? Another analogy I just made up would be a fat person eating, in aggregate, just 200 calories a day more than their body burns averaged over 20 years. Over 20 years plus they are going to get to be a morbidly obese 600 pounds! How would you all regard the intelligence of someone watching them who said that the person sometimes binged on 5000 calories a day for weeks, then went on a crash diet for weeks and their weight varied by 50 pounds cyclically but that the steady average one ounce a day weight gain from those unburnt 200 calories is totally “swamped” by their natural cyclic variability, so therefore is unimportant? I don’t think that is very smart. Do all you “natural variability swamps the CO2 signal” types agree now? Small cumulative dietary forcings add up to one obscenely fat individual over time. Climate forcings in the SAME direction mean steadily accumulating heat. Binges and diets give a wide CYCLIC variability of weight month to month. Just as natural oscillating climate variations give a wide variety of temperatures over decadal periods. So what? A fatty in denial of reality could easily pick and choose start and finish points to draw trend lines on the graph of their weight to fool themselves into thinking they were losing weight or stable – that they were doing fine – but they would be deluded…
    0 0
  4. Dana, his book is very serial. All I have seen so far is hints of solar charging, but nothing quantitative and I have not gotten to an explanation of secular warming while answering Rob's question.
    0 0
  5. Excellent post on the same topic (includes ref to Nuccitelli et al 2012): http://www.wunderground.com/blog/RickyRood/comment.html?entrynum=239
    0 0
  6. hank_ wrote: "What on earth is a 'fake skeptic'??" Technically, the term 'skeptic' has long been misapplied to the point that 'person who questions' is now common usage regardless of the validity of the 'questions'. However, the original meaning was more along the lines, 'person who questions facts and assumptions to determine the truth'. Thus, people who uncritically accept complete nonsense (e.g. 'global warming has stopped') are not skeptics under the original meaning of the term and when they seek to apply that original, laudatory, meaning to themselves they are being 'fake skeptics'. They are not questioning the facts, but rather latching on to any easily dis-proven lie with which they can shield themselves from the facts. That the term 'skeptic' has been misappropriated by kooks for so long that it now could be taken to mean, 'person who irrationally disputes without factual foundation' isn't relevant as that clearly isn't the meaning the self-styled 'skeptics' are going for.
    0 0
  7. Another reason to stop our atmospheric levels getting towards 1000ppm. Elevated Indoor Carbon Dioxide Impairs Decision-Making Performance
    0 0
  8. Well Nick, that one is certainly on the bizarre side. In light of the tabling of another massive omnibus budget bill that may(not sure yet) involve further cuts to environmental monitoring; I wonder if extra CO2 is being circulated into the ventilation of Canada's House of Commons?
    0 0
  9. Potholer does another excellent take-down.
    0 0
  10. FYI The links to the graphics in The Guardian version of the article are broken.
    0 0
  11. He's off again... http://www.dailymail.co.uk/news/article-2220722/Global-warming-The-Mail-Sunday-answers-world-warming-not.html This time, it's not "Embarrassingly stupid tabloid hack detects no warming for 16 years", it's up to the readers of the Mail to make up their own minds. To aid them to do this, Rose then tells them what to think.
    0 0
  12. idunno I have just discovered that gem, live link: The really inconvenient truths about global warming. Last week we explosively revealed a 16-year 'pause' in rising temperatures - triggering a bitter debate. You decide what the real facts are... Don't look there for any facts as Rose has probably misquoted again. Why would the Mail use an ITN Production of a NASA originated video of warming since 1884 when one could just look directly at the NASA version? Oh I did compare them, and just like Pat Michaels recent effort the ITN-Mail have erased the Arctic and the Antarctic too. See the NASA version here NASA Finds 2011 Ninth Warmest Year on Record. Does Rose and the Mail think that 2012 will show a cooling? Another point of deception is that the name of the originator of that cartoon graphic, which Rose describes as a graph, in the first such article 'Ben Weller' has vanished in this new reproduction although they have made it look as if they have reproduced from original.
    0 0
  13. Rose and Curry haven't said much new, they've mostly doubled-down on their previous misunderstandings and misinformation. I have however drafted up another blog post debunking their latest effort. Look for it sometime this week.
    0 0
  14. Plotting decadal averages for GISS-LOTI, starting with the most recent decade and moving backwards, yields the following graph (http://imageshack.us/photo/my-images/845/gisslotiseptember2012.jpg/ ). In the decadal plot, it is difficult to see any evidence of global warming slowing.
    0 0
  15. @ Cornelius Concerning the UKIP policy document, The graph they reproduce showing the various warm and cold periods since the last ice age ends at 0BP, which is 1950, so it misses out the last 62 years of warming and thus gives the impression that the preceding warm periods were warmer than today.
    0 0
  16. Having just ran the HadCru3 numbers for the past 15 years (December 1997 through November 2012), it is correct to state that these numbers show a mild cooling over the last 15 years. At -0.007 C/decade, the cooling is statistically insignificant. However, it is there according to their numbers. Since I downloaded the text files and checked it myself, you are free to do so and see if I am full of it or not.
    0 0
    Moderator Response:

    [DB] "the cooling is statistically insignificant"

    Then it is indistinguishable from zero. And thus you confirm that "It's Not Cooling".

    Please cease to create something where nothing exists. You essentially replicate the comment you made earlier, here. This type of behavior on your part constitutes sloganeering (repeating memes already disproved) and makes your comments subject to moderation. Please familiarize yourself thoroughly with this site's Comments Policy before posting further comments.

  17. Mod- You are OK using a number that is statistically insignificant as the basis for claiming warming elsewhere. I am being honest about the numbers. On an entry that claims to debunk 15 years with a lack of warming, what would be more relevant that using the relevant data to show what the cited numbers actually indicate? I want to show the best science, not a 'version' of it. If the numbers showed a 0.25 C/decade trend, that would also be worth mentioning, but that's not what the numbers show.
    0 0
    Moderator Response:

    [DB] The point you miss is that the trend which IS statistically significant is the overall warming trend, which continues unabated in the overall Earth system (land/ocean/cryosphere/energy imbalance at the TOA) to this day. Until a change that is statistically significant occurs that shows that the warming trend is no longer occurring.

    In the meantime, the Earth's climate has absorbed 1.5 billion Hiroshima bombs-worth of energy over the past 16 years, all due to that energy imbalance at the TOA that we have caused. Perhaps gaining a more nuanced understanding of the science would be preferable to running off at tangents to the established science?

  18. 67, Jack, If you want to use the best science, then why do you start with an anomalously high El Niño and finish with a period of two consecutive La Niñas? The escalator is going up.
    0 0
  19. Interesting Jack, but I have some questions: What do the numbers show starting from 1997, or 1999,or 2000, or 1996? Is it significantly different from what they show starting in 1998? If it is, and the other 4 different starting dates give results that are close, shouldn't these results be considered instead of the 1998 result? Are there other 15 years periods in the record that show cooling "trends"? Why pick 1998 as a starting date?
    0 0
  20. Jack, tests of statistical significance are a useful sanity check in science; the basic idea is that you should not make a claim based on a particular set of observations unless the evidence is statistically significant. I'm sure we would all agree on that. However The claim that global warming is occurring is not based solely on the observed trend in global mean surface temperature, there are many other lines of evidence, such as ocean heat content and others, and a good deal of basic physics. If the only evidence we had of global warming or the greenhouse effect were the GMST trend over the last fifteen years, you would have a point. But it isn't, so your conclusion is based on a misunderstanding of the science. A lack of a statistically significant trend does not necessarily mean it isn't warming. I'd be happy to discuss this with your further.
    0 0
  21. Most global warming goes into heating the oceans
    However * greenhouse warming works by warming CO2 in the atmosphere * the atmosphere stopped warming 16 years ago Therefore, warming of the oceans over this period cannot be due to CO2/atmospheric warming. It must be something else - but what ?
    0 0
  22. Punksta @71 - everything you said after "However" is wrong.
    0 0
  23. Dana1982, Let start with the first point. So you don't think greenhouse warming is down to CO2. What then?
    0 0
  24. Punksta - Although there is a small constant contribution by geothermal heat emanating from deep within the Earth, the oceans are warmed by shortwave radiation (sunlight) entering the surface ocean. Heat flows from the (typically) warmer ocean to the cooler atmosphere above. The rate of this heat loss is determined by the thermal gradient in the thin cool-skin layer at the sea surface. Increased concentrations of greenhouse gases (predominately carbon dioxide) direct more longwave radiation (heat) back toward the ocean surface and thereby lower the thermal gradient in the cool-skin layer. This reduces the rate of heat loss from the ocean and, over time, they get warmer. See this SkS post: How Increasing Carbon Dioxide Heats The Ocean.
    0 0
  25. Rob, Yes, heat typically flows from the ocean to the atmosphere. And the rate of this is determined by the thermal gradient between them. Which is determined by the temperature of the atmosphere, and which would be slowed by a warmer atmosphere warmed by longwave absorption by GHGs. But equally, if the atmosphere is not warming, it (and hence CO2) cannot be the cause of ocean warming. And whatever the impact of back-radiation (now dismissed not just by skeptics but also many alarmists), it cannot occur in the absence of atmospheric warming.
    0 0
  26. Punksta @ 75, given your understanding of physics, you should find this question a no-brainer: assuming CO2 is not responsible, what physical process is causing the oceans to warm at just the rate predicted by AGW theory? I would be delighted to have solid evidence that increasing the concentration of CO2 in the atmosphere is not, in fact, warming the planet.
    0 0
  27. But equally, if the atmosphere is not warming, it (and hence CO2) cannot be the cause of ocean warming.
    In exactly the same way that a kettle on the stove will never boil if you fail to keep turning the knob higher and higher, or a car will stop gaining speed as soon as you stop pushing the accelerator lower and lower. Because as we all know, inertia doesn't exist and everything reacts instantly to any imbalance so there is never any "catching up" to do. This is, of course, ignoring the fact that there's no statistically-significant indication that warming has slowed at all...
    0 0
  28. Punksta, are you now claiming that back radiation doesn't exist? Wow. Got anything to back that up? Here's an explanation of back radiation and details of how to see it for yourself by one of the "skeptics" favourite scientists, Roy Spencer. A more in-depth explanation is provided by The Science of Doom. Regarding your misunderstanding that that fact that warming has not reached statistical significance in the last 16 years means that there has been no warming in that time, have a look at the graphs in this post by Tamino. The trend from 1980 to 1997 is lower than the trend from 1997 to 2012. It just hasn't reached the point where we can say we are 95% sure that it isn't by chance. When we are over that 95% confidence level the deniers will simply pick a shorter period after that time. Previously the date chosen by AGW deniers was 1995, but when warming since then reached statistical significance (95% confidence) they moved the date to 1998. In a few years the meme will be that there has been no warming since 2004, or some such date.
    0 0
  29. Doug H You avoid my point - IF (1) greenhouse warming happens by absorption of heat by CO2, and the consequent warming of the atmosphere, which slows cooling of the oceans into the atmosphere (2) there is no significant warming of the atmosphere for some period THEN greenhouse warming cannot be behind any ocean warming that may occur in that period. I have no suggestions as to what other forces may be dominant. Furthermore ocean temperatures readings are nowhere near as robust as surface ones, so any supposed match-up to expected AGW warming is equally open to question.
    0 0
  30. JasonB, ou dispute that if the atmosphere is not warming, it (and hence CO2) cannot be the cause of ocean warming So even if the atmosphere continues indefinitely with the the current non-warming pattern, never significantly warming ever again, the oceans will continue warming in line with CO2 ?
    0 0
  31. JasonB, ou dispute that if the atmosphere is not warming, it (and hence CO2) cannot be the cause of ocean warming
    Well, obviously I dispute that, that was the whole point of the examples I gave. The car doesn't stop accelerating as soon as the pedal stops moving, and the kettle doesn't stop warming as soon as you stop turning the knob into the new position. They aren't in equilibrium instantaneously.
    So even if the atmosphere continues indefinitely with the the current non-warming pattern, never significantly warming ever again, the oceans will continue warming in line with CO2 ?
    Non-sequitur. Your claim is that the oceans cannot continue to warm until now because of AGW if the atmosphere hasn't warmed for 16 years. 16 years is not "indefinitely". And the atmosphere has continued to warm during those last 16 years anyway, so the point is moot. GISTEMP says 0.113° per decade. The 16 years prior were only 0.081. What on earth made you think the atmosphere had stopped warming?
    0 0
  32. Punksta - On the upper left hand side of the SkS homepage is the trend calculator. Use any of the global surface temperature datasets - they all show warming over the last 16 years. This is at odds with your claim. Indeed, the ocean heat uptake in the upper 2000 metres of ocean shown in Nuccitelli (2012)increased dramatically between 2000-2004 which negates your strawman argument of global surface air temperature and ocean heat content being closely coupled over such short time frames. Greenhouse gases exert a long-lived and persistent forcing of the ocean cool-skin layer, which is why there is a strong relationship between global temperature and atmospheric carbon dioxide in the ice core records, but they operate in tandem with other processes, such as the El Nino-Southern Oscillation (ENSO) which create short-term fluctuations in global temperature and act to disguise this persistent forcing when viewed over short intervals. This slower rate of warming of the global surface temperature, even if we don't allow for the possibility of human pollution aerosol-induced attenuation, isn't exactly a surprise, climate model simulations show periods of a decade or more where there is little or no warming, even in the presence of a strong global energy imbalance (i.e global warming scenario). Which bring us to the key issue - the Earth is currently in energy imbalance. The warming of the ocean, the major heat reservoir on Earth, shows us as much. The planet will continue to warm for decades until it is able to shed the excess energy and come back into equilibrium. To claim that the Earth is cooling, or about to demonstrates a poor understanding of the enhanced (increased) Greenhouse Effect. Also, note the comments policy. Repetition of an unsubstantiated claim, or myth in your case, constitutes sloganeering and will run the risk of deletion. We expect commenters to back up claims with references to peer-reviewed literature, or bonafide global datasets.
    0 0
  33. Rob, I am not claiming the earth or oceans are cooling. I am merely saying, pretty much in line with conventional wisdom on the topic, that since AGW happens by means of warming of CO2, and hence of the atmosphere, that ongoing atmospheric warming is a precondition of ongoing ocean warming.
    0 0
  34. Punksta, The problem with what you are saying is that: a) The warming of the atmosphere needn't be "ongoing" for the ocean to keep warming over the last 16 years, merely that the ocean has not yet caught up, in exactly the same way that the car continues to accelerate until it has reached the speed it will eventually reach based on the final accelerator position, and the kettle continues to warm until it has reached the temperature it will eventually reach based on the final knob position. You have not shown any research that would suggest the time it takes for the world's oceans to reach equilibrium is only 16 years. b) The atmosphere has continued to warm anyway. You appear to be mistaking a lack of statistically significant warming for a lack of warming, which is something else entirely. There will always be a period of time that can be quoted that the warming is not statistically significant over. The lack of statistical significance is entirely due to the shortness of the period of time, not due to the lack of a trend. Think about this for a second: The GISTEMP warming from 1980 to 1996 was 0.081° ± 0.149° per decade — not statistically significant. The warming from 1996 to now was 0.113° ± 0.122° per decade — also not statistically significant. But the warming from 1980 to now was 0.153° ± 0.049° per decade — very statistically significant. How can that be? Here's a clue — the English phrase "statistically insignificant" does not mean the same thing as the statistical phrase "not statistically significant". So, the premise of your argument is false, and the argument itself would be incorrect even if the premise was true due to your failure to take into account inertia.
    0 0
  35. RobP said: On the upper left hand side of the SkS homepage is the trend calculator. One simple experiment (with regard to this topic) is to use the trend calculator to do the following: 1. Determine the trend and uncertainty for the period 1996-2012 2. Determine the trend and uncertainty for the period 1980-1996 3. Determine the trend and uncertainty for the period 1980-2012 And then ask yourself: is the trend for 1. greater than or less than 2. ? Is the uncertainty in 1. greater than or less than 2. ? Are either of the results in 1. and 2. statistically significant ? Is the result from 3. a summation of 1. and 2. or is it different, is it statistically significant ? You might then come to your own view about whether there really has been a "pause" (whilst gazing at figure 1!) Caveat: I tried this with about 4 of the various datasets. They all showed similar results but I didn't try them all.
    0 0
  36. punksta Consider an atmoshere and ocean in thermal equilibrium, so that the amount of heat radiated/conducted from the oceans is precisely balanced by the amount of heat recieved by the ocean from solar radiation, back-radiation from the atmopshere and by conduction from the atmosphere. No suppose an upwelling cold current replaces relatively warm water across a large fraction of the tropical Pacific. Clearly the ocean will now be radiating less IR as part of the surface is colder than before, but the incoming solar radiation is the same, so the oceans will begin to warm up. However, as part of the ocean surface is now cooler than before, the atmosphere will beging to cool a little in response. Now of course the energy transferred between the atmosphere and oceans will change a little (for instance there will be a little less back-radiation from the slightly cooler atmosphere). However the heat capacity of the atmosphere is small compared to the oceans, so I suspect the difference has relatively little effect. Now I am no physicist, but it seems fairly obvious that it isn't a given that ongoing atmospheric warming is a precondition to ocean warming. P.S. it is called "La Nina".
    0 0
  37. Sorry, Cross posted with JasonB - seems we had the same idea !
    0 0
  38. Punk @73 - your first point isn't wrong because CO2 isn't causing global warming (it is), it's wrong because the greenhouse effect doesn't work by "warming CO2 in the atmosphere". That's not an accurate description of the greenhouse effect.
    0 0
  39. Punksta, you're treating '16 years without statistically significant warming' as if it means there has been little or no warming. It doesn't. It means the time period chosen was too short to prove statistical significance. You acknowledge that the 30 years prior to that showed warming... but there were numerous 16 year periods within that 30 year duration which did not show statistically significant warming. Thus, the current 16 year 'hiatus' as you call it could be part of an unchanged warming trend. Indeed, the past 30 years (including that 16 year 'hiatus') do show statistically significant warming. So do the past 20 years. Choosing a time period too short to establish a statistically significant trend and then arguing that it means anything is inherently nonsense. Show me a statistically significant 'cooling' trend and we'll talk. Chopping the ongoing warming trend to a duration short enough to avoid statistical significance is just flim-flammery.
    0 0

Prev  1  2  

You need to be logged in to post a comment. Login via the left margin or if you're new, register here.


The Consensus Project Website

THE ESCALATOR

(free to republish)


© Copyright 2024 John Cook
Home | Translations | About Us | Privacy | Contact Us