Climate Science Glossary

Term Lookup

Enter a term in the search box to find its definition.

Settings

Use the controls in the far right panel to increase or decrease the number of terms automatically displayed (or to completely turn that feature off).

Term Lookup

Settings


All IPCC definitions taken from Climate Change 2007: The Physical Science Basis. Working Group I Contribution to the Fourth Assessment Report of the Intergovernmental Panel on Climate Change, Annex I, Glossary, pp. 941-954. Cambridge University Press.

Home Arguments Software Resources Comments The Consensus Project Translations About Support

Bluesky Facebook LinkedIn Mastodon MeWe

Twitter YouTube RSS Posts RSS Comments Email Subscribe


Climate's changed before
It's the sun
It's not bad
There is no consensus
It's cooling
Models are unreliable
Temp record is unreliable
Animals and plants can adapt
It hasn't warmed since 1998
Antarctica is gaining ice
View All Arguments...


Username
Password
New? Register here
Forgot your password?

Latest Posts

Archives

Climate Cherry Pickers: Falling sea levels in 2010

Posted on 3 October 2010 by John Cook

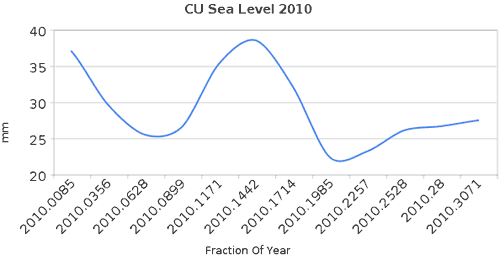
A proper understanding of climate requires we consider all the data, the full body of evidence. A common rhetorical technique used to portray a skewed picture is the technique of cherry picking. This involves choosing just the select pieces of data that paint a certain picture, even if the full body of evidence gives the completely opposite result. A vivid example of this is a recent post by Steve Goddard which casts doubt on the fact that we've experienced record hot temperatures over the last year, citing falling sea levels in 2010. This is based on the following graph showing satellite measurements of sea levels over 2010:
The satellite data comes from the University of Colorado - you can download the data directly. This data goes back to 1992. Here's what the full body of evidence looks like:
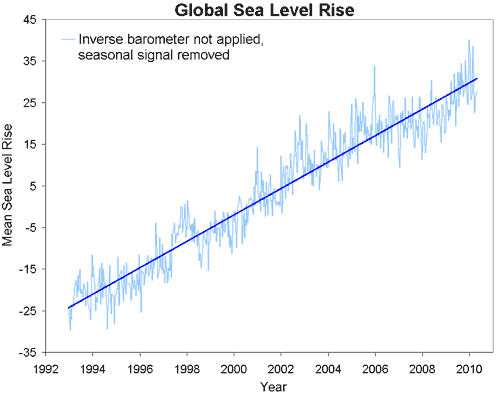
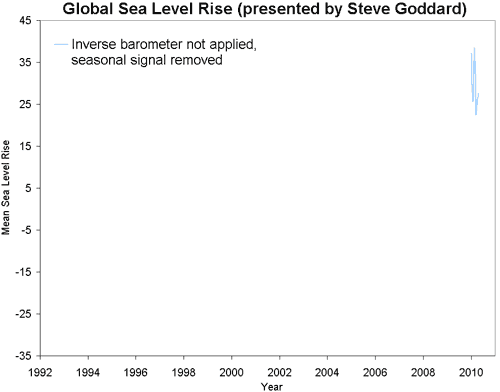
Early in 2010, global sea levels hit the highest levels on record. Realising this fact is not possible when the only data presented is the following:
Of course, there's a lot more that can be picked apart in Goddard's blog post (and readers are welcome to contribute to this process). There's no discussion of why sea levels might be dropping this year (I suspect it has something to do with the switch from El Nino conditions in early 2010 to La Nina conditions in the middle of the year). There is no exploration of what other factors besides air temperature contribute to glacier ice loss - Robert has explained the complexities of why glaciers loss mass here, here and here.

Instead all we are presented with is strong conclusions drawn from a very short piece of climate data. This is taken from a noisy signal showing many ups and downs throughout the long-term trend of sea level rise. A proper understanding of climate deserves much more than this.

0 0

Printable Version  |  Link to this page

Comments

Prev  1  2  

Comments 51 to 54 out of 54:

  1. @adlady Perhaps our understanding of ENSO really isn't as sound as you'd like to believe.
    0 0
  2. #50 kdkd at 21:05 PM on 7 October, 2010 It's very poor form to show data without properly attributing the source of the raw data You are right. It's the Sea Level Change page at the University of Colorado at Boulder site. You can also find the data file there. The method was simple least square fit for a parabola.
    0 0
  3. Re: Berényi Péter (49) I'm going to be kind & assume you are being fascetious with your comment. Otherwise, that was the looniest comment I've ever seen you make. Perhaps I missed a few, though. The Yooper
    0 0
  4. Re: TimTheToolMan (51)
    "Perhaps our understanding of ENSO really isn't as sound as you'd like to believe."
    You made some typo's. You spelled it O-U-R when you should have spelled it M-Y, and used Y-O-U-'-D instead of I-'-D. Here's a corrected version:
    "Perhaps my understanding of ENSO really isn't as sound as I'd like to believe."
    There, that's better. In all seriousness, now, what on Earth would lead you to make such a statement? The Yooper
    0 0
  5. Nice illustration of one of the main points of the post, there, BP. For the rest of "us," please note that BP's graph shows a little slice of the record in the longer graph above. BP's particularly fine place kick: Make a slanted (curved) point by truncating data, kick the ball right offsides by positing an absurd extrapolation.
    0 0
  6. BP @49 I find your conclusion confusing. Your graph, at best, only shows that the *rate* of rise is decreasing. It does not indicate that the trend is reversing and in decline.
    0 0
  7. pbjamm, if you naively project BP's quadratic trend forward in time, it would eventually level off and start decreasing. The fact that there's no justification for doing so is beside the point.
    0 0
  8. #53 Daniel Bailey at 21:37 PM on 7 October, 2010 I'm going to be kind & assume you are being fascetious with your comment. Thanks, you are right, I am. And while we are here you can ask kdkd to tell doug_bostrom it's very poor form to show data without properly attributing the source of the raw data. Anyway, I guess it's based on Church 2006, which is bogus. The reason I tell you this is because the Complete PSMSL Data Set can be downloaded, in either annual or monthly resolution and you can check it for yourself if the claimed acceleration exists or not as I have done for myself. However, if one is only interested in acceleration, the proper way to do it is to compute acceleration for the individual stations, and have a look at the distribution of these accelerations. Reconstruction of average rate is neither necessary nor desirable for this end. Sea level is expected to be more dynamic than vertical land motion, simply because both viscosity and heat capacity of crust and the underlying mantle is many orders of magnitude higher than that of seawater, heating is steady on this timescale while mass redistribution in solid earth is also slower. So the spurious acceleration signal added by vertical land motion is expected to be much smaller relative to acceleration term of sea level change than the same kind of noise in rates. Still, even the acceleration signal derived this way is rather noisy with a huge dispersion (relative to average). Therefore a non-zero "average" acceleration can't be genuine, it is indistinguishable from zero, even on a century time scale. On the other hand in the remote case reconstruction of Church & al. made sense after all, it is easy to see all their acceleration took place before 1930, after that date there is none. As almost all CO2 induced warming is supposed to happen after 1950 (because emissions before that time were tiny), it's kinda check-mate, isn't it?
    0 0
  9. Apologies for the lack of a citation and actually that was Church 2008, BP. Unless I'm misunderstanding you, the nut of your objection seems to come down to a hypothesis that, overall, continents are sinking below the waves, but you don't offer any details to support this remarkable claim.
    0 0
  10. TTTM - you claimed that the heat "could accumulate" in days if not hours. No it could not. Just because there is a lot of energy coming in does not mean it can accumulate that fast in the real physical world and reasons why are the important key issue in the OHC questions.
    0 0
  11. So you say but what proof/mechanism do you offer that energy gained over a day cannot be retained whereas the same energy can accumulate over months or years? And I say cannot in the same way you said could... Now is a good time to mention Plank's Law when dealing with the accumulation. You need to account for that.
    0 0
  12. To create the imbalance in energy in/energy out (where Planck's Law does the energy out), you have to have storage of energy within the planet that is not yet expressed as surface temperature. This is matter largely of thermal properties (though melting ice also contributes). Once surface temperatures increase of course then energy balance is restored and no further accumulation occurs.
    0 0
  13. Handwaving "thermal properties" may fool some but you've not answered the question.
    0 0
  14. TimTheToolMan at 07:36 AM "So you say but what proof/mechanism do you offer that energy gained over a day cannot be retained whereas the same energy can accumulate over months or years?" The oceans are the main reason, energy (LW&SW) will be absorbed during the day(LW reduces loses, SW "heats"), at relatively shallow depths, because the SW heats down through a shallow column of water, and "heat" is lost at the surface(through LW, evaporation, conduction), convection kicks in through the column that is absorbing shortwave and brings the energy to the surface, whilst mixing this area through turbulence, when the sun goes down. And "heating" stops, this surface layer will fall back to a stratified profile, due to the fact that its still loosing "heat" at the surface, but there is no "net" input of energy going below the surface. So looking at it "extremely simply", conduction is the means that energy is stored in the deeper ocean, and its not a very efficient mover of energy, and it would take a lot o time, to move energy down into the ocean this way, due to the way that the surface interacts with SW/LW, to keep moving energy to the surface... but the oceans have some 1300 times the thermal capacity of the atmosphere. P.S. it may have been asked... but why isnt the inverse barometer applied in the sea level graphs?
    0 0
  15. TTTM - I was thinking about heat capacity, conductivity etc. Irradiate a surface and it heats till temperature is such that blackbody radiation matches incoming radiation. You arent asking me to prove that? The storage of energy for a material before that temperature is reached depends it heat capacity. Straightforward for land, but for sea, convection, transport of heat by mass flow, etc. will also affect this (the nebulous thermal properties). Conduction also moves heat away from the irradiated surface so this also has be figured in.
    0 0
  16. Should also add, over longer time scales, conduction and mass transport can store heat deeper into the ocean. These processes are slow movers of heat however so surface just warms first, limiting how much you can store in a day.
    0 0
  17. Ahh, after having a bit o a better read o the comments, i see Goddard didnt apply inverse barometer, so apple n apples then...
    0 0
    Response: The data with the inverse barometer applied is a "better" signal - if you don't filter out the atmospheric pressure effects, you get a much noisier signal with lots more ups and downs (much better for cherry picking). In this case, Goddard opted for inverse barometer not applied so I thought rather than get bogged down in discussion of inverse barometers, I just plotted the same data he used.
  18. @ TimTheToolMan adelady asked you @40: "Where exactly will the heat to drive the next el Nino come from?" @43 you respond: "In answer to your question or rather to put it into perspective, the heat you speak of could accumulate in a matter of days if not hours." If this is so, then why does it not at all times? You say @47 that only a tiny portion accumulates per day. Please take the time to explain the mechanism at work here.
    0 0
  19. @Joe Blog I agree that accumulation of energy below the thermocline occurs primarily through conduction and my understanding is that the timeframes are measured in centuries. Accumulation of any energy can only occur with either an increase of energy input into the ocean such as might happen with a change in cloud cover or theoretically a decrease in energy lost from the ocean. This is the mechanism you hinted at with your suggestion increased LW radiation such as would happen with increased CO2, would decrease the LW radiation loss at the surface. But is this really the case? It might surprise most here that the science behind that assertion is at best weak and at worst non-existant. http://www.realclimate.org/index.php/archives/2006/09/why-greenhouse-gases-heat-the-ocean/ Explains the issue and you'll be hard pressed to find references to it elsewhere even though its the lynchpin behind AGW.
    0 0
  20. #69 TimTheToolMan at 21:11 PM on 8 October, 2010 I agree that accumulation of energy below the thermocline occurs primarily through conduction and my understanding is that the timeframes are measured in centuries. No, it is not he case. Thermal conductivity of water is 0.58 Wm-1K-1. To calculate power flux through a surface, one has to multiply it by temperature gradient perpendicular to that surface. Now, even at the thermocline temperature gradient seldom exceeds 0.04 Km-1 (1°C difference in 25 m). Therefore in this layer power flux by conduction is less than 25 mW/m2. However, as we go deeper, temperature gradient decreases rapidly; below 1000 m it is about 0.0007 Km-1, implying a downward power flux of 0.4 mW/m2 by conduction. On this rate it would take a million years to increase abyssal temperature by 1°C. A bit more than "centuries". On the other hand there is a geothermal heat flux from below at the bottom of oceans, some 100 mW/m2 on average, that is, hundreds of times more than heating by conduction from above. So conduction is absolutely negligible, except perhaps in the very vicinity of the thermocline, but even there it fails to be dominant. If there were no poleward mass transport above the thermocline at all, the conductive power flux at it would lower the thermocline by about 20 m in a century. However, there is one, so average depth of the thermocline is pretty stable. It is mass transport alone that is able to influence heat contents of deeper layers in oceans on these short timescales, both wind or tide driven turbulent mixing and thermohaline overturning due to density differences. But I don't think this transport could exceed geothermal heating rate by much.
    0 0
  21. kdkd #50 Looks like BP #49 has gob-smacked the Sea level debate again. Just 1.9mm/year - that's below my 2.1mm year from Jason, and near to the ice melt alone number of 2mm/year. Could this Sea level rise be 'flattening' kdkd?
    0 0
  22. #59 doug_bostrom at 03:12 AM on 8 October, 2010 the nut of your objection seems to come down to a hypothesis that, overall, continents are sinking below the waves, but you don't offer any details to support this remarkable claim. No, I was talking about neither rising nor sinking of continents (relative to the terrestrial center of gravity), just the temporal derivative of this motion, that is, its acceleration. But come to think of it, continents must be sinking, after all. Or let's be more accurate. Vertical motion averaged over the entire surface of solid Earth should be zero, provided volume of the planet does not change. However, tide gauges are not scattered just randomly over the surface, they are located along coastlines, per definitionem. Now, at the end of the last glaciation when the huge Laurentide and Fennoscandian ice sheets melted away, there was an almost step-like 120 bar pressure increase over marine basins, including continental shelfs. In other words at locations far from the previous ice sheets a pressure difference was built up between the interiors and margins of continents, therefore some isostatic rebound should have happened worldwide, with an opposite sign of course compared to sites close to previous ice sheets, but of smaller magnitude. Due to high viscosity of mantle stuff, it is likely not finished yet. Rate of vertical motion above land is not easy to measure, but average rate of sinking along coastilnes can easily be as large as 0.4 mm/yr (with a considerable dispersion). Just for a taste of the complexity of the issue see: Global and Planetary Change Volume 57, Issues 3-4, June 2007, Pages 396-406 doi:10.1016/j.gloplacha.2007.02.002 Geocentric sea-level trend estimates from GPS analyses at relevant tide gauges world-wide G. Wöppelmann, B. Martin Miguez, M.-N. Bouin and Z. Altamimi
    0 0
  23. Ok BP, I think I get it. In a nutshell, your hypothesis implies that because of cultural matters tide gauges are located mostly in places where isostatic adjustment is such that, taken together, the population of tide gauges produces a false impression of rising sea level. Is that about right?
    0 0
  24. By the way, BP, thanks for damping somewhat a reverberating misconception concerning how heat reaches the abyss. Understanding heat transport in the ocean is impossible without at least a glancing look at thermohaline circulation. Regarding geothermal flux, it helps to keep the numbers in context: Another neglected energy source is the geothermal heat flux through the sea floor. This trickle of heat, which is due to the slow cooling of the solid earth, is estimated to have a typical value of 50 mW m−2 (1 mW = 10−3 Watts) on abyssal plains and up to 200 mW m−2 on mid-ocean ridges [Sclater et al., 1980; Kadko and Baross, 1995; Stein et al., 1995; Murton et al., 1999]. Even these peak values are small compared to typical values of air-sea heat fluxes, which are of order 100 W m−2. Impact of Geothermal Heating on the Global Ocean Circulation (full text, pdf)
    0 0
  25. #75 was a case of hitting submit before typing. Please delete. From Peltier 2009, Closure of the budget of global sea level rise over the GRACE era: the importance and magnitudes of the required corrections for global glacial isostatic adjustment The net rate of sea level rise is therefore predicted to be: 2.54 mm/year +/- 0.52 mm/year or 2.32 mm/year +/- 0.31 mm/year Clearly both of these estimates are consistent with the net rate of global sea level rise of 2.5 mm/year that has been measured by the altimetric satellites over the GRACE era.
    0 0
  26. TTTM - now I am really at a loss. You are saying that increased downward LW would not cause more heating and cite the RC article as evidence? What do you see as the "issue to explain"?? BP - ocean mixing operates on 800-1000 year cycle. You claim geothermal heating exceeds mass heat transport. Can you substantiate that? (I'll try to find time to feed that into my thermal modelling next week).
    0 0
  27. I am saying the is no quantified science to verify the downward LW radiation due to increased CO2 has the capability to heat the oceans at the rate observed. Instead the assumption appears to be warming is observed and therefore must be attributable to CO2 If you disagree with this then find a paper that quantifies the effect described in the RC article.
    0 0
    Moderator Response: Well, if you're disagreeing with the basics of "GHG" warming, you'll need to shift to another thread. Suggestions:

    Empirical evidence that humans are causing global warming

    and in particular

    How do we know CO2 is causing warming?

    Spencer Weart's chapter "The Carbon Dioxide Greenhouse Effect" is an excellent source for becoming familiar with the theoretical case for C02's role in Earth's energy budget.
  28. Berényi Péter at 01:00 AM on 9 October, 2010 #69 TimTheToolMan at 21:11 PM on 8 October, 2010 Thats my bad, i was talking about surface interactions with solar and back radiation, as to why the oceans dont accumulate energy faster(as in a really sunny day), so by deep ocean i was talking 100s o meters, not thousands.
    0 0
  29. TTTM #77 I think the moderator answered your question (with faulty premises) there. You're implying that heat retained by CO2 should go to a different location than heat caused by water vapour, or by the sun alone, which is clearly an insane position. The different components of the greenhouse effect have been quantified, but once they're heat, that's it, it's all ultimately going to end up in the same place. No need for flashy scientific papers to demonstrate that, it's just basic physics.
    0 0
  30. You're way off the mark with that comment kdkd. The suggestion is that science simply hasn't worked out whether CO2 has the capability to warm the oceans at the rate expected because the actual mechanism is anything but a simplistic one. Most people dont even know there is an issue.
    0 0
  31. Might help to clarify "the rate observed," TTTM.
    0 0
  32. TTTM #80 Well you've certainly not managed to explain the issue (if it exists) with any coherence. It seems that you're suggesting there's some issue with the laws of physics as they're presently understood, but that could just be your poor quality explanation of "the issue". In any case, it's off topic for this thread, I suggest that if you want to follow it up, then take it to how do we know co2 is causing warming.
    0 0
  33. KL #71 "Looks like BP #49 has gob-smacked the Sea level debate again." Not realy. His analysis is pretty naive. here's a nice blog post on how to process sea level rise data.
    0 0
  34. @TTTM: As kdkd eloquently put it, heat is heat. It doesn't matter what percentage of that heat is from CO2 forcing, or water vapor, or if it comes straight from the sun. Heat from one source is not fundamentally different than heat from another source. I don't see why you can't "explain this easily." You should at least try.
    0 0
    Moderator Response: But not on this page. I just performed a mass swathe of deletions of comments below this one. This will continue until the discussion is taken to the appropriate place.
  35. TTTM #86: One year? Five years? I refer you to the article above and its explanation of the term 'cherry picking'. If you are truly basing conclusions on just two to six data points you're effectively making decisions based on random noise.
    0 0
  36. I've taken the response to one of TTTM's deleted comments (that was still in my RSS reader) over to the appropriate thread. Please redirect discussion of the role of CO2 over there.
    0 0
  37. #73 doug_bostrom at 03:26 AM on 9 October, 2010 because of cultural matters tide gauges are located mostly in places where isostatic adjustment is such It is hardly a cultural matter tide gauges happen to be located along seashores. It's also hardly surprising as you press down the perimeter of a flexible plate floating on a viscosous fluid it sinks a bit while its central region rises.
    0 0
  38. kdkd #83 BP's analysis is 'naive' - well what does a less 'naive' analysis reveal about the acceleration or deceleration of sea level rise??
    0 0
  39. KL #87 It's naive because it doesn't attempt to account for any reasons for the perceived deceleration (e.g. the recent solar minimum), or attempt to ascertain any improvements that a non-linear fit provides compared to a linear fit. Again, if you're going to try to make strong claims about this kind of thing, your eyeball isn't good enough, you've got to use something that's more objective.
    0 0
  40. KL and BP, It seems to be lost on both of you, but this thread is about Goddard cherry picking and misrepresenting the global SL data. Yet all I see by you are attempts to obfuscate and detract from that. I would like to know for the record, do you condone Goddard misleading people and cherry-picking. Is that acceptable to you? Anyhow, BP has failed to provide some stats on his regression. It is an academic exercise, b/c that polynomial fit is likely not to be valid much beyond the training window.... Also, please tell me that extrapolating that polynomial curve out to 2100 was a poor joke.
    0 0
  41. In 90 I should have said that: "For the quadratic fit the slope of the 95% PI envelope increases with time".
    0 0
  42. Albatross #90 That would tend to indicate that a linear fit is better, although I wouldn't mind looking at the residuals to confirm that :) Either way it looks like BP's analysis is bogus. Best bet is to save the graphs as png or gif files and follow the instructions here
    0 0
  43. OK, I really should not be trying to do this when I am fighting a bug. The reason for me saying that should be obvious from the above data.
    0 0
  44. John/moderator, please delete my posts 90 and 93 as they contain faulty information. Thanks. Sorry for the hassle.
    0 0
  45. Something has gone wrong with the comments here... My comment #91 referrs to a different comment #90 from Albatross. I guess when albatross gets back we can salvage some sense with the help of moderators and reconstruct something that makes sense. In the mean time, from memory it seems that Albatross' regression model shows that there's no reasonable justification to perform a quadriatic fit, and that a linear fit is better suited to the data set.
    0 0
  46. I'm surprised he used 12 data points when 2 would have been just as authoritative. Steve Goddard obviously has no pride; this is by no means his first foray into obviously bogus pseudo science.
    0 0
  47. Re: kdkd (94) See Albatross's comment currently at 93 above. The 2 comments were deleted by request. The 2 posts are still visible in the Deleted Comments bin. The Yooper
    0 0
  48. #89 Albatross at 10:04 AM on 10 October, 2010 extrapolating that polynomial curve out to 2100 was a poor joke It was. But it's not a poorer joke in any way than the conclusion of Church 2008. "In situ and satellite data indicate an increase in the rate of rise since 1870 and that the sea level is currently rising at a faster rate than at any time during the last 130 years. The sea level is projected to continue to rise at an increasing rate during the 21st century." The reality is that although there is a considerable interdecadal variability in the rate of sea level change, it has not accelerated in any meaningful way during the last century. So even if sea level is projected to continue to rise at an increasing rate, this projection is not based on empirical evidence, but something else. Whatever this something else may be, it is surely incompatible with the time tested scientific method. And while we are at it, "projection" itself as it is used here is not a traditional concept of natural sciences and as such, has an ill-defined meaning. Therefore it should never be used in scientific papers. One is either able to predict what would happen or not. In the latter case it is a perfectly legitimate and acceptable scientific position to express it as we do not know. On century scale linearity and interdecadal variability of sea level change see: GEOPHYSICAL RESEARCH LETTERS, VOL. 34, L01602, 2007 doi:10.1029/2006GL028492 On the decadal rates of sea level change during the twentieth century S. J. Holgate "Based on a selection of nine long, high quality tide gauge records, the mean rate of sea level rise over the period 1904-2003 was found to be 1.74 ± 0.16 mm/yr after correction for GIA using the ICE-4G model and for inverse barometer effects using HadSLP2. The mean rate of rise was greater in the first half of this period than the latter half, though the difference in rates was not found to be significant." "it is found that the high decadal rates of change in global mean sea level observed during the last 20 years of the record were not particularly unusual in the longer term context" "The highest decadal rate of rise occurred in the decade centred on 1980 (5.31 mm/yr) with the lowest rate of rise occurring in the decade centred on 1964 (-1.49 mm/yr)." Departure from a linear trend may not be significant, but it is not accelerating either.
    0 0
  49. Excellent, looks as though there's broad agreement that sea level is increasing. Except... BP, my point about tide gauges is rooted in the observation that the gauge network has been heavily skewed in density toward stations located in upper latitudes of the NH, for cultural reasons. Whatever conclusions may be drawn from tide gauges as a statistical population need to account for this. You say that sea level rise is not accelerating, but does your assertion take into account the density distribution of the gauge network? I think we can dismiss the "all continents are sinking" concept, unless we can posit some enormous addition of mass occurring simultaneously on all continents. Strictly speaking, as we're not speaking of falling sea level but rather accelerating increase of sea level, probably further exploration of this ought to take place at the conveniently named How much will sea levels rise in the 21st Century?
    0 0
  50. kdkd@91, Sorry for the confusion. That is entirely my fault kdkd. I messed up when I was calculating the regression models and requested that the moderator remove the erroneous information. Time is an issue-- having to look after the little ones today. But I promise to get back to you ASAP. In the meantime, I have plotted the residuals and I cannot see anything that justifies using a quadratic model versus a linear model.
    0 0

Prev  1  2  

You need to be logged in to post a comment. Login via the left margin or if you're new, register here.


The Consensus Project Website

THE ESCALATOR

(free to republish)


© Copyright 2024 John Cook
Home | Translations | About Us | Privacy | Contact Us