Prediction: New Surface Temperature Record in 2013
Posted on 13 March 2012 by dana1981
2005 and 2010 are statistically tied as the hottest years in the surface temperature record (according to NASA GISS and NOAA NCDC, and likely according to HadCRUT4, once the update is released). 2011 was a relatively cool year due to the cooling influence of a strong La Niña event. In fact, 2011 was impacted by the 5th-largest La Niña influence of any given year since 1950, and the largest since 1974. Nevertheless, it was the 10th-hottest year on record, and the hottest La Niña year on record (Figure 1).
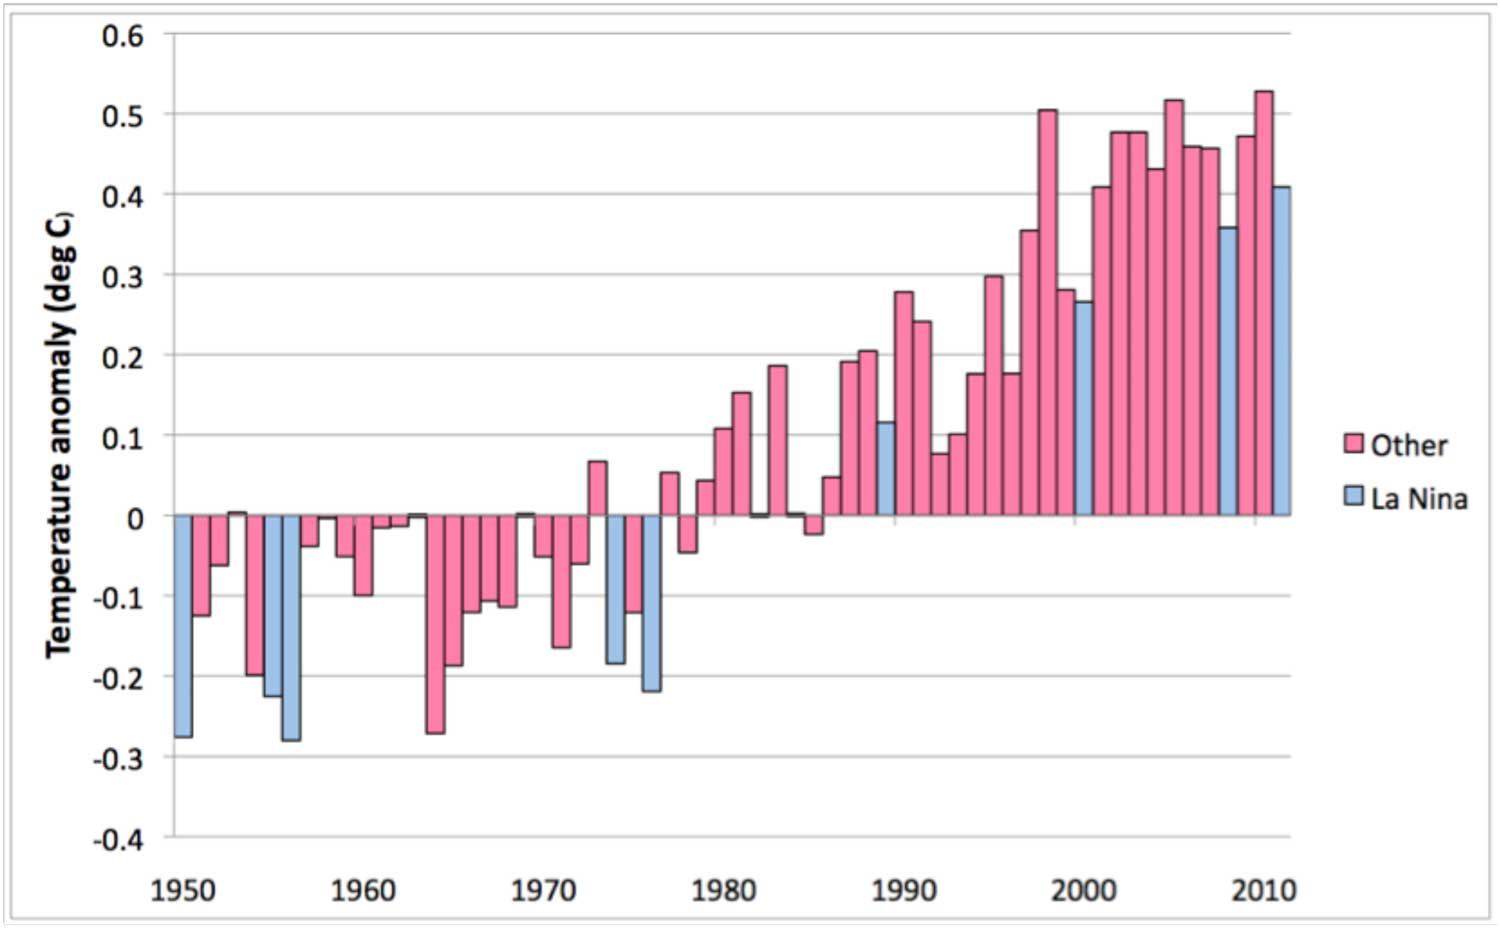
Figure 1: Average of NOAA, GISS, and HadCRUT annual global surface temperature anomalies. Blue bars indicate years influenced by La Niña events. 2011 is the warmest La Niña-influenced year on record (Source: WMO)
Predicting Near-Term Temperatures
It's an interesting, although inherently difficult exercise to predict how short-term temperatures will change, because short-term temperature influences like solar and volcanic activity and the El Niño Southern Oscillation (ENSO) are each rather unpredictable themselves. Nevertheless, scientists are getting better at predicting future total solar irradiance (TSI) and ENSO changes, which are two of the largest natural short-term surface temperature influences.
Foster & Rahmstorf (2011) (FR11) utilized a statistical multiple linear regression approach to estimate the influence of these three natural factors on global surface temperatures. We can thus use their results and predictions of future TSI and ENSO changes to estimate how surface tempertures will change in the near future.
For example, the Multivariate ENSO Index (MEI) has a 2 to 4 month lag before its changes are reflected in global surface temperatures, and multiplying the MEI value by approximately 0.075 provides an estimate of its influence on global surface temperatures, according to FR11. Changes in TSI or sunspot number have a 1 month lag, and multiplying a change in TSI by roughly 0.07 provides an estimate of its surface temperature influence. And of course we expect CO2 to be causing approximately 0.02°C surface warming per year.
We can then compare these influences in recent years (starting in 2000), compared to actual observed temperature changes (Table 1). The predictions for each year in Table 1 apply the temperature influences to the observed temperature (from NASA GISS) from the previous year.
Table 1: Temperature Influences (°C) and Predicted vs. Observed Temps
| Year |
ENSO | TSI | CO2 |
Predicted T | Observed T |
| 2000 | -0.055 | 0.035 | -- | -- | 0.35 |
| 2001 | -0.020 | 0.038 | 0.02 | 0.41 | 0.48 |
| 2002 | 0.015 | 0.012 | 0.04 | 0.51 | 0.56 |
| 2003 | 0.047 | -0.003 | 0.06 | 0.60 | 0.55 |
| 2004 | 0.027 | -0.033 | 0.08 | 0.52 |
0.48 |
| 2005 | 0.044 | -0.049 | 0.10 | 0.50 | 0.62 |
| 2006 | -0.008 | -0.063 | 0.12 | 0.57 |
0.55 |
| 2007 | 0.028 | -0.070 | 0.14 | 0.58 | 0.58 |
| 2008 | -0.064 | -0.070 | 0.16 | 0.51 |
0.44 |
| 2009 | -0.003 | -0.070 | 0.18 | 0.52 | 0.57 |
| 2010 | 0.036 | -0.060 | 0.20 | 0.64 | 0.63 |
| 2011 | -0.092 | -0.056 | 0.22 | 0.53 |
0.51 |
So this model does reasonably well, usually predicting the year-to-year GISS surface temperature anomaly within 0.07°C, though it tends to underestimate large changes. We can then apply it to predict the anomalies for 2012 and 2013, given TSI and ENSO predictions. TSI is expected to peak around 2013, though as a relatively weak solar cycle. ENSO is expected to enter neutral conditions in the next couple of months, and then transition into a moderate El Niño cycle through the end of 2012. ENSO predictions don't extend into 2013, so we'll take a guess that the El Niño cycle will phase out, and 2013 will average a weak positive ENSO temperature influence (Figure 2).
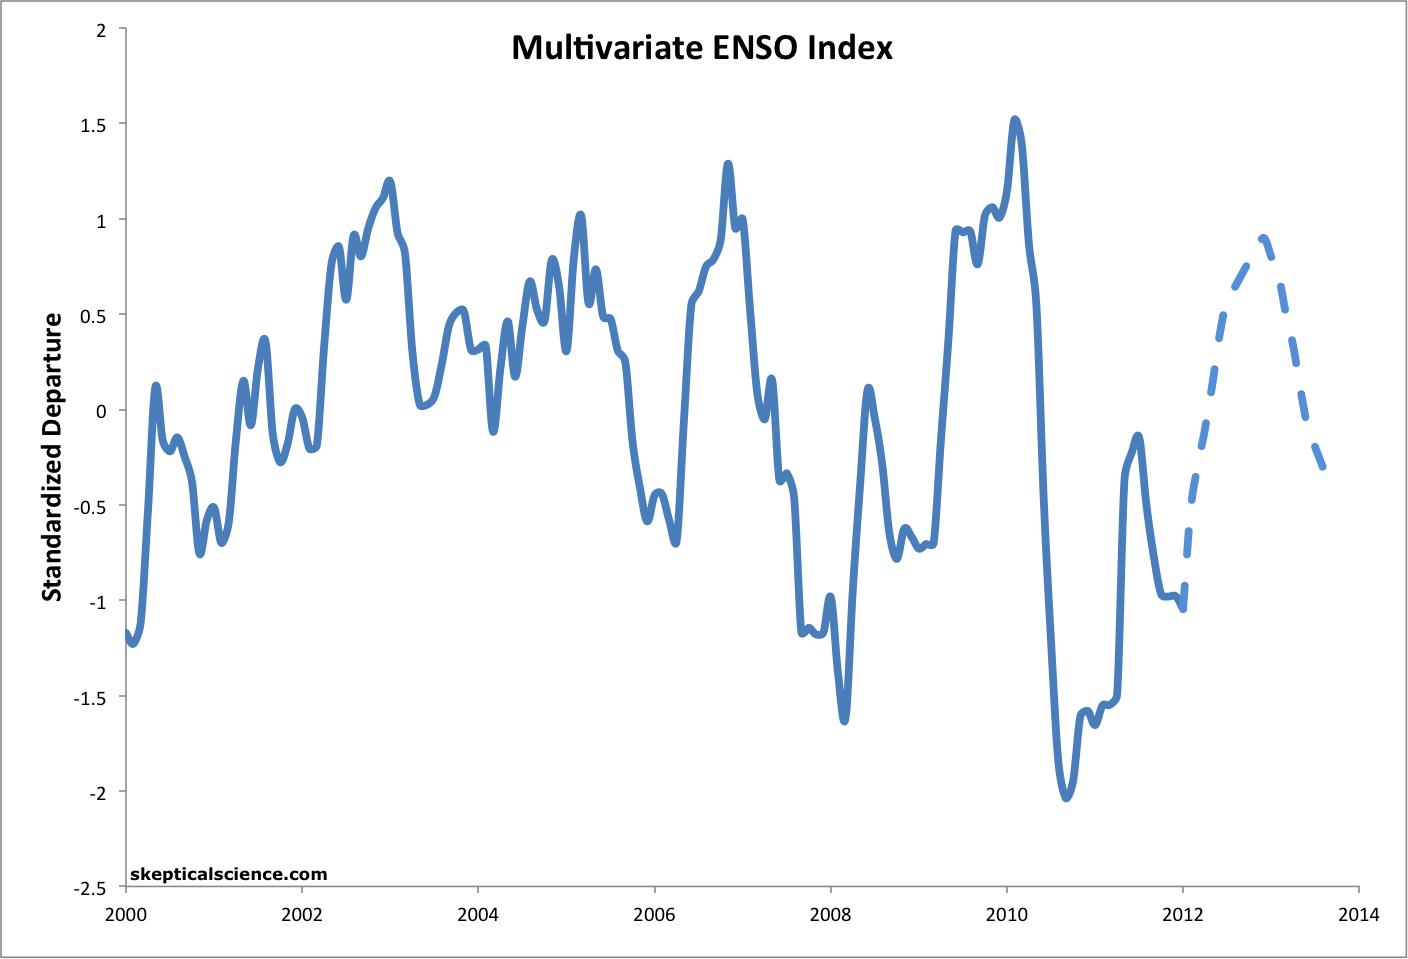
Figure 2: MEI observed (solid, NOAA) and predicted (dashed, NOAA through 2012, guesstimate thereafter).
The resulting predictions are shown in Table 2.
Table 2: Temperature Influences (°C) and Predicted GISS Anomalies
| Year |
ENSO |
TSI | CO2 |
Temp Anomaly |
| 2010 | 0.036 | -0.060 | -- | 0.63 |
| 2011 | -0.092 | -0.056 | 0.02 | 0.51 |
| 2012 | -0.024 | -0.015 | 0.04 | 0.65 |
| 2013 | 0.030 | 0.025 | 0.06 | 0.76 |
As Table 1 shows, 2012 may break the temperature record, though the prediction is well within the margin of error. Thus if the El Niño doesn't form as soon or as strong as expected, or if solar cycle 24 stalls, or if one of the factors not included in this simple analysis (such as aerosols or clouds or other ocean cycles) acts in the cooling direction, 2012 will probably not break the record.
However, all three of the major temperature influences will be in the warming direction in 2012 as compared to 2011, assuming the El Niño develops as predicted. All three may also be in the warming direction in 2013 as compared to 2012, again with ENSO being the main question mark. Thus it appears quite likely that 2013 will break the surface temperature record, and quite possibly by a large margin, with a solar cycle peak and possible El Niño year. There is also a reasonable chance that both 2012 and 2013 will break the surface temperature record.
These predictions are of course nullified if there is a significant volcanic eruption in either 2012 or 2013, as they operate under the assumption that the volcanic influence will be roughly zero. They also do not consider the human aerosol influence. With China's economy growing, but the nation becoming more and more conscious of both air quality and global warming concerns, human aerosol emissions changes are very difficult to predict.
Summary
This exercise provides a very rough estimate for 2012 and 2013 annual average surface temperatures, with a number of caveats. If solar cycle 24 continues to develop as expected, and and if an El Niño cycle develops as expected, and if there are no major volcanoes or other major changes in aerosol emissions, then this method projects a possible annual temperature record in 2012, and a likely record in 2013. In fact, because we can be confident that 2013 will be at or near a solar cycle peak, and we know the CO2-caused warming will continue upwards, 2013 will probably break the surface temperature record even if it's a moderate La Niña year (again, assuming there are no volcanic eruptions or other significant unaccounted-for effects).
Note that Arthur Smith has done a similar analysis with very similar results, predicting a possible record in 2012 (also 0.65°C) and a likely record in 2013 (at 0.73°C without considering the ENSO influence).
Also note that this is my [Dana Nuccitelli - dana1981] personal prediction and is not representative of Skeptical Science as a whole. So, what's your prediction?

Arguments


Here's my prediction: 0.61 (2012) and 0.70 (2013).
Why? I'm betting on my own rerun of F&R's calculation with a response function to spread the effect of the exogenous factors over a longer period, and a ramp function from 2000 to simulate increase aerosol emissions. However, the fit on my model is poorer than Tamino's, and the p-value on the ramp function is only 18%, so I can't really claim any evidential support.
It's also a coward's bet given that I am on the conservative side for both years, and even if I were to get it right the error bounds are sufficiently large that it wouldn't actually offer any support for my model.
It will be interesting to whether any 'skeptics' respond.
I have notice before that the Foster and Rhamstorf regression does not capture the full influence of ENSO, leaving a residual ENSO correlated signal after the regression. Therefore, allowing or this I would adjust the 2013 prediction up slightly, to 0.74 C.
I notice that Dana's method has had errors of 0.07 C twice in a decade. Based on that, I doubt the accuracy of projection is much better than +/- 0.1 C. It would be significantly worse as a prediction because of the error in predicting ENSO and volcanic eruptions. I notice that both Dana and Kevin C mention the margin of error, but so far as I can see, they do not specify it. I would be interested in their specification of the margin of error on condition that their are no major tropical eruptions and that there is a moderate El Nino in 2013.
Given that 2013 is the next sunspot maximum, I'm sure that the deniers will attribute record warmth to the sun if these predictions come through. If the temperature for a few years afterwards hover around 0.6-0.7C, we will have a new round of "look, it's stabilized".
Here's some brainstorming for your missing ENSO signal though:
1. See if the ENSO fit can be improved by doing the F&R correction as now, and then looking at the lagged correlation between the MEI and the residuals to look for any residual ENSO signal at differrent lags.
2. Try and handle non-linearity by adding a term which is quadratic or cubic in MEI.
The latter is pretty easy. I might try that.
I think you mislaid your decimal. Dana would only be .003C off with his rounding. That would not affect his 2012 projection and would only lower 2013 by .006C.
Hansen had a prediction similar to this 5 or 6 years ago where he said he expected a new record within three years. The next two years were La Nina years, but the third set a new record.
I like Dana's method. We will have to see what El Nino does in the next 18 months. It is surprising that 2012 comes out so warn after the relatively cool January.
3rd and 4th powers are less significant still.
However, given the way Dana sets his prediction up in Table 2, the difference is 0.003 C in 2011, 0.006 C in 2012, and 0.009 C in 2013. That would suggest my predictions should be:
2012: 0.64 C (having rounded down)
2013: 0.76 C (- 0.01 C for the lower anthropogenic increase, plus 0.01 C for the expected understatement of the effect of the El Nino).
It's all just a rough estimate, and +/- 0.1°C looks to be a good estimate of the margin of error, which again suggests a very good chance that 2013 will break the record. Like Kevin, I'm skeptical that 2012 will break it, but we'll see. It mainly depends on that El Nino.
I am less skeptical that 2012 will break the record. My gut suggests that 2012 is more likely to be in the upper half of the uncertainty range, and 2013 in the lower half. But guts are notoriously bad predictors, so I'll stick with my tweaks on your prediction (for stated reasons).
Coincidentally, I made almost the exact same bet on a record in the next few years at Zerohedge.com, I did qualify with the caveat that there be no major volcanic eruptions...
Anyway, I would like to thank the authors of this blog for my making my defense of AGW so much easier...
If you would like to have real fun, try hanging out at an unmoderated financial website dominated by right wing libertarian types... Believe it or not, I feel that is the real frontline in the AGW debate...And the debate is not for the feint of heart...Over time there is a growing minority, even at such sites that knows AGW is real, but are actually afraid of voicing their opinions for fear of ridicule...
The recent FR2011 and Hansen papers are exactly what is needed in this debate... They are clear irrefutable evidence that the climate is changing and my two biggest clubs in the battle against ideologically driven denial...
Don't laugh, it is a war out there....
PS My background: Ph.D. physics, 20 years in academia followed by 5 years on Wall St....now semi-retired...
Coincidentally, there's also a very good chance that 2012 will be the hottest La Nina-influenced year on record, though it might not technically qualify as a La Nina year per the WMO criteria in Figure 1. What would really be interesting would be if there is an overall negative ENSO influence on the 2012 temperature anomaly, and yet it still ties or breaks the record, as will be the case if my prediction is correct.
Do we have any evidence that China's aerosol emissions would be decreasing any time soon? Sulphur emissions from ocean-going ships are expected to decrease 2020 or 2025. We'll surely make some impressive new records when aerosol emissions really start decreasing.
If the ENSO was in a cool phase last year, then it should peak, assuming a 5 period, toward the end of 2013 or 2014. 2014 would coincide with my guess of max effect for TSI; so, I pick 2014 as the next year we are likely to see a larger than average temp increase.
'Course, next peak and next record are different measures, and aerosols, volcanic or industrial, could easily nix all that. Then again, declining summer sea ice could albedo-push it up.
My two cents, probably worth every penny.
I suspect that continued summertime Arctic sea ice loss will have an increasing contribution towards increasing global temperatures. Some projections of sea ice coverage suggest extreme reductions in the next few summers. More energy will go to increasing surface temperatures and less to melting sea ice. (My gut pessimism on Arctic sea ice, however, is proven to be unreliable.)
Interesting post. You are probably aware that the UK Met Office also issues a forecast for the global annual mean temperature, here is the link for those who are not familiar with their forecast. They are predicting that 2012 will be warmer than 2011, but not be as warm as 2010 was.
I'll be bold and also make a prediction for 2012 using a simple analogue approach. Like others my assumption is that there will not be a major eruption the tropics loading the atmosphere with aerosols, and that neutral to weak El Nino conditions will dominate for the remainder of the year. Most current products are not predicting a moderate or strong El Nino at this time.
Using the GISTEMP global surface temperature product my guess estimate for global surface air temperature anomaly for 2012 is +0.57 to +0.61 C, with a best guess estimate (very unscientific I know) of +0.59 C. IMHO, Dana's estimate of +0.65 C is at the very upper end of the possible range.
So I very much doubt that 2012 will break the existing record (2013 is definitely a candidate though), but note that 2012 could be the first La NIna year which breaks the anomaly of +0.57 C set in 1998 following a super El Nino. If 2012 ties or breaks the anomaly set in 1998, that in its own right will be highly significant and disturbing landmark.
So it could be an interesting year.
I think we'll see a shorter than usual solar cycle. Currently, cycle 24 is progressing in start-stops, sort of like a car when you push the pedal to the floor, it accelerates then the cylinders skip and you stall. I predict this will continue throughout 2012 with a weak peak end of 2012/start of 2013. Flux is also indicating a weak cycle and early peak.
Anyways, with that in mind I think TSI will not rise, but stay the same. With a weak sun this year, the trade winds will kick in over the Pacific (warm Atlantic, cool Pacific). If a La Nina develops as a result, it'll be pretty weak, weaker than the last.
Overall with those points in mind I'm going to predict 'steady as she goes' with pretty much stable temps across the two years. After that it's anyone's guess. With predictions of a solar minimum (grand or not is yet to be known) we may see some slight cooling after 2013 for a couple of years. After 2015........ *shrug*
If I had to put figures on it, let's go with 0.53C for 2012 and 0.55C for 2013.
I think SOI may still be a bit too high to indicate a moderate El Nino. If one does develop I think it'd be pretty weak. Personally I think we'll see a weaker La Nina than this last one, in the neutral zone, but still negative. I also think a weaker TSI and weaker solar magnetic flux will result in cloudier skies, which would only add to any dampening.
Hence why I predict 'stead as she goes'. Spose it's not technically flat, but only rising due to AGW and solar peak (weak as it will be).
That's not very "skeptical" of you! So, you position is that GHGs do have an effect but go with mysterious GCR effect to reduce the rise. Well actually observing a link between a weak solar magnetic flux and cloudiness would change climate science. We shall see.
Hathaway's revised forecast
But like many of the recent redacts and retracts, Solar Cycle may have a Cycle 23 punch in it - not never, just late.
Spotless quiet days:
Current Stretch: 0 days
2012 total: 0 days (0%)
2011 total: 2 days (<1%)
2010 total: 51 days (14%)
2009 total: 260 days (71%)
(Source http://www.spaceweather.com/)
And the sunspot activity is rising, not sputtering along - March is already beating Hathaways max 2 years ahead of his 'peak':
Sunspot Activity Bar Chart
Some volcanic activity would actually be a bit more good luck (put Tom Hanks and Meg Ryan under house arrest for the duration).
The GHG concentration is primed for a combination with Cycle 24 and an El Nino - not only is warming back on, but the shallow ocean temp trend pushes up, and there's a lottery with the winning region getting a scorch. China hasn't been mauled yet ... they're due.
Whattaworld - hoping for a volcanic surge and a La Nina ...
My guesses as to what they'll say:
1) It was all ENSO and Solar
2) Continued recovery from the Little Ice Age
3) Reduced cosmic rays caused less clouds
4) The uncertainty monster had a fever
5) Urban heat island effects
6) Residual effects from the 1998 super El Niño
7) Mars is warming too
8) Can we talk about "Climategate" instead?
9) Who cares? Plants love it!
10) Isn't Monckton an awesome debater!
Finally, while over the long-term, there is little doubt as too the direction of tropospheric temperatures in the 21st century, with or without a new Maunder- type minimum, and also little doubt as to the cause of that increase, I am still more interested in watching ocean heat content, and certainly hope we can get more readings at deeper levels very soon. The troposphere can be quite fickle with such a low heat capacity compared to the ocean. Whereas the ocean is both s better record of the past and is key to dictating how warm we'll be getting from our antropogenic experiment on our planet's energy balance.
The exercise:
To get maximum value for delta-T in short term predictions (2-5 years), one would have to argue for the suppression of the arctic (and antarctic) ice loss by the incoming currents (possibly by the THC shutdown mechanism?), while stating what the sudden ultra-large methane bursts would do. Additionally one has to make arguments of the continued rise of ocean surface temperatures (increased stratification) to get the maximum effect on temperature. Clean up of SOx in China and the lack of volcanic eruptions (because the world gets rounder with the glacier loss) would have an effect. And then there's the possibility of the solar cycle to continue for long since the sun had a long rest period (giving hydrogen more time to sink to the fusion layer of solar innards). All this while all the oil/gas pipeline networks have fatal failures for a solar flare so large the controlling circuits fuse together (here you might guess this is made somewhat tongue in cheek).
The text has very little maths currently, so it's easy to read! I won't post it here though. Maybe nowhere, since it's an exercise.
I had a stab at this prediction a few months ago, although I framed it thus:
I'm happy to stand by it.
Once the peak impact is reached in January an ENSO event typically decays steadily until roughly the middle of the year. However the temperature impact only reduces quite slowly until about the middle of the year when the temperature influence finally reduces relatively rapidly.
The upshot of this is that the temperature of 2012 has been largely determined by the current ENSO phase. Any impact from a developing warm ENSO event will not be felt until very late in the year. With current UAH temperatures quite low, I can't see any more than a very low chance that UAH will challenge for the record on an annual basis. However late in the year (after June) will see a substantial rise in temperature and I believe would be a high chance of achieving a daily record (for day of year) and a moderate chance of achieving a monthly record at some stage.
However a warm ENSO phase for 12/13 would then pretty much lock 2013 in as being a very warm, with a high chance of breaking the annual record.
My current gut feel is that we will see a short lived warming ENSO event that will return to cool-neutral during the critical peak months around Dec-Jan, and that 2013 will have a very slight cool influence from ENSO, and will not reach a record.
This is for UAH, which tends to react more to ENSO then GISS does, and I haven't looked in as much detail at the link between ENSO and temperature for GISS. I think the forecast in this article looks quite reasonable.
I'd be careful using a few days data to compare against cycle predictions. Sure, this week SSN's may be anything up to 100, but less than 2 weeks ago it was around 33. Month by month SSN fluctuate wildly and we're seeing high SSN's right now due to the CME's. I'm sure by the end of the month SSN's will have calmed right down again. Flux is still pretty low, a small indication the cycle is still "calm".
A sceptic is not allowed to believe in an AGW effect? ;)
As for GCR's, let's wait till Svensmark and CERN have finished their little projects, eh? But note I did predict it would be a very weak effect.
Also re GCRs - I presume you read the SkS posts on that?
The CERN experiments have really only started, so it's too early to tell. Svensmark has also announced he has a paper in review right now which is the last component of his theory. Once again, too early to tell.
But I think it's fair to say that if radiation from our sun affects our climate, then it's possible that radiation from other suns may too (even if a tiny tiny amount). However it only takes a minute change in clouds to cause a big effect.
It's all just a part of the general mix of forcings that make up our climate. :)
It doesn't matter what Svensmark's paper says or shows. The GCR hypothesis is effectively dead as an explanation for recent warming. Even if there was a big effect from GCR's on clouds (a very big *if*), there has not been a trend of decreasing GCR's over the last 40-50 years, which the hypothesis requires. The Sun has been going in the wrong direction for Svensmark's claims.
"then it's possible that radiation from other suns may too (even if a tiny tiny amount)."
You're talking many, many orders of magnitude too small of an effect. Changes in our Sun's TSI has a very small effect; nothing other stars do will be measurable.
If Svensmark can prove it, then it isn't effectively dead as an explanation. It puts it on the discussion table. But until that day, it's just another unproven claim.
Besides as I said, it's all just a part of the general mix of forcings.
Dale, it doesn't matter if he shows a strong effect from GCR's on clouds; GCR's have not been trending down over the last 40-50 years as would be needed in order to produce less clouds and therefore warmer temps. He has to rewrite cosmic ray history in order to be vindicated. Good luck with that.
There are the known properties of GHG's and their rapid increases, there are the direct GCR measurements and there are the paleoclimate records that disagree with the theory of GCR's moderating climate for a large part.
For the GCR theory to be true all the lines of evidence against the GCR theory need to be explained which is very difficult. Preponderance of evidence shows it's very unlikely that changes in GCR are the source of late 20th century warming.
Following on from Tom's question on uncertainties, I've started looking at this, but there is a problem. I'm probably wrong, but I think Tamino may have plotted 4-sigma uncertainties on the coefficients by mistake, rather than 2-sigma. I've posted a question on his blog.
The largest uncertainty is in the solar coefficient. Assuming the version in the table above is correct, it has a 95% chance of it lying between 0.030 and 0.092. ENSO plays a bigger role but is much better determined.
Please read this sentence again: "it's all just a part of the general mix of forcings".
GCR's are just one of a heap of forcings on climate. This article itself highlights another three, two of which bounce up and down too. GCR's don't have to explain the warming of the last decades.
Isn't a famous SkS line to "look at the whole picture"?
[DB] "Isn't a famous SkS line to "look at the whole picture"?"
Indeed. When looking at the whole picture of drivers of climate change, the observer will note that GCR flux is but a fleck in the corner of the picture.
"GCR's are just one of a heap of forcings on climate."
Nitpicky of me but I think you mean GCR's may be just one of a heap of forcings on climate. Since you acknowledge that Svensmark's theory is "just another unproven claim".
I agree the GCR-warming theory is pretty well dead at this point. Svensmark is far from the only researcher looking at this, and many other studies have found a very small if any GCR-cloud link. On top of that, as has been noted, GCR flux on Earth has been flat for the past 60 years, and was particularly high during some of the hottest years on record, when the hypothetical GCR effect should have been causing cooling. If anything it's a very small effect, and can't account for any of the warming over the past 60 years.
Saying GCR's are flat for the past 60 years is pretty misleading. It fluctuates by 20% in direct opposition to SSN's. It would be better to say "the trend is flat". And I'm not saying it may have a big effect, like I said above, a minuscule effect.
In the big picture it's good to be researching the full effects of all forcings, even if they are statistically ineffective. If we have a baseline for all forcings at least then we can clearly know if one of those forcings changes. So whilst you guys may scoff at research such as CERN Cloud and Svensmark, I applaud it and welcome it. More knowledge means better decisions. Such as this article, if we had better knowledge of what the sun and ENSO will do over the next two years, maybe then the predictions being made in this thread could actually be considered serious rather than simply guesstimates.
However, the impact of CO2, ENSO, and solar is not only an "idea" ("theory" is more apt), their impacts are well verified and quantified as being the strongest forcings outside occasional volcanic impacts, and Foster and Rahmstorf also show how they account for nearly all the year-to-year variability in climate.
[DB] As has been amply demonstrated, by you and others earlier on this thread, GCR's are pointedly not a driver of climate change and thus have no bearing on the OP. Interested parties, please take GCR's to a more appropriate thread. Thanks!
Foster & Rahmsdorf did check the exogenous variables that they used for colinearity and found that this was not going to be a problem. Adding variables that are highly colinear with variables that are already being used, while it will allways improve the fit to the data, can lead to a poorer predictor when you extrapolate the data. Be careful when adding variables.
I don't. I've been following it daily for about six years.
hth.
Here's a PDF that lays out the influence (basically about the same as aircraft and 20% of the value of land transport). The SO2 reduction is offset by the CO2 production - and one of the articles gave it summary of neutral but not benign.
AEA GHG Emissions from Shipping 2008 (3.5meg PDF)
The one curiosity (no link available) is the link to the GCR cloud-cover issue. Based on satellite observation, the marginal increase in ocean cloud cover in the second half of the 20th century was so small it could be ascribed to increases in shipping (sorry, no link).
I'm sure Malthus would agree with me. But best of luck!