


 Arguments


A striking resemblance between testimony for Peabody Coal and for Ted Cruz
Posted on 20 January 2016 by John Abraham
In a recent congressional hearing, Ted Cruz (one of the leading candidates for the Republican presidential nomination) first asked us to follow the science, and then misused and abused the very science he reportedly admires. The contrarian scientists that were invited to testify are members of a shrinking tribe that every year has to work harder to deny the clear evidence of a human-caused warming world.
Those scientists were William Happer, Judith Curry, and John Christy. They argued that the Earth isn’t warming (or has slowed its warming) or that satellite temperature measurements are the best way to measure the Earth’s temperatures. In fact, satellites don’t measure temperature at all, but these witnesses didn’t mention that fact.
Additionally, the satellite measurements that they showed are from the middle of the troposphere, high in the atmosphere (not at the surface). Finally, the contrarians declined to emphasize that the synthetic satellite temperature data have been wrong for years. The upper part of the atmosphere (stratosphere) is cooling as a result of the increased greenhouse gases while the lower layer (the troposphere) is warming. If any measurements of the stratosphere bleed into the measurements of the troposphere, it can cause a cooling bias.
I had the (dis)pleasure of testifying at a hearing in Minnesota where William Happer also testified. He, Roy Spencer, and Richard Lindzen all made errors in their testimony that were repeated at the Cruz congressional hearing. At the Minnesota hearing, these contrarians were representing Peabody Energy – the world’s largest private sector coal company.
They focused on high-altitude temperatures in the tropical part of the globe (near the equator) rather than temperatures at the surface or in the oceans. But it gets even worse – they combined two sets of satellite data into a single curve when in reality, satellite temperature measurements differ by as much as a factor of four depending on whose data you use!
The figure below is nearly identical to Figure 9 Exhibit 2 in Richard Lindzen’s direct testimony, and similar to Figure 3 in Exhibit 2 to Roy Spencer’s Direct Testimony. You can see the schedule for the testimony here and access the filed court documents. My rebuttal testimony is available here and my surrebuttal ishere. Climate scientist Andrew Dessler also testified at the hearing and his reports can be found here and here.
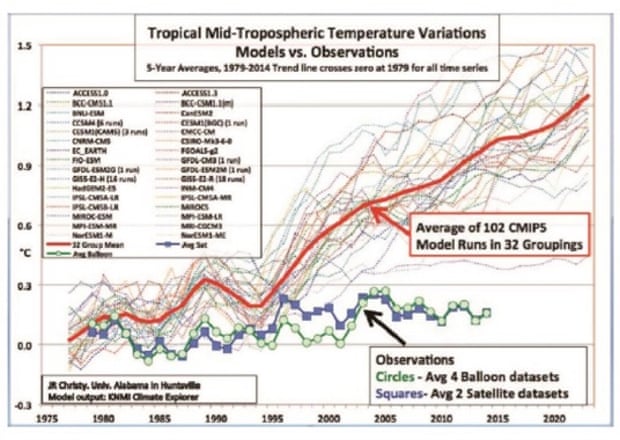
Image from Figure 4 Exhibit 2 of William Happer’s direct testimony (OAH Docket number 80-2500-31888, MPUC Docket E-999-CI-14-643).
As I wrote last year and submitted in my court filings, the table below shows the huge spread amongst various satellite measurements. Why didn’t the contrarians point this out? Why do they only use the coldest two datasets? Why didn’t Roy Spencer tell the Minnesota Public Utilities Commission that his work has been found to be wrong multiple times?
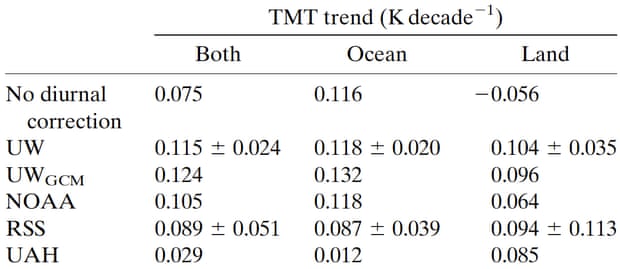
Tropical mid-troposphere temperature satellite trend estimates from different groups using different diurnal drift correction approaches. From Po-Chedley et al. (2014).
Why does this Peabody Coal case in Minnesota matter? Well, the same arguments were made by Ted Cruz and his contrarian witnesses in December in Washington DC. You can watch the video here. You can read John Christy’s testimony here.You can read Judith Curry’s written testimony here. The similarity between this group of contrarian documents is shocking. It is almost as if portions of their testimony were cut and paste.
I am not really surprised the Ted Cruz would question climate science. And I am not surprised the well-known contrarians Judith Curry, John Christy, William Happer, Roy Spencer, and Richard Lindzen continue to question the mainstream expert consensus. I am not really surprised that some of these scientists are representing fossil fuel companies in litigation or hearings. What I am surprised about is that they are being so selective in presenting data and not telling the full story.
For instance, why don’t Roy Spencer and John Christy tell these judges and panels that they have had to revise their own temperature estimates several times over the past two decades when other scientists identified errors in their model? They originally claimed that the atmosphere was cooling, and now their data shows it is warming.
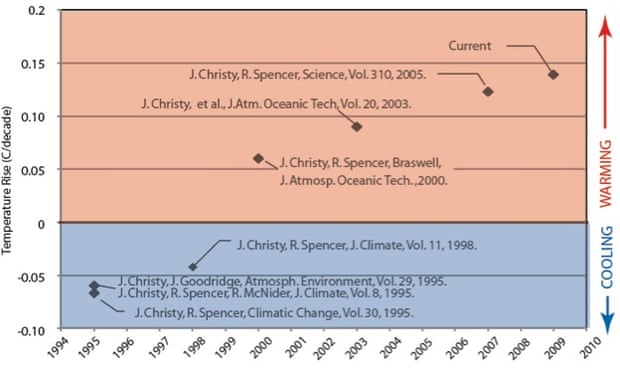
The University of Alabama at Huntsville lower troposphere temperature trend after each major revision to the dataset.
Why do these contrarians mislead by only showing some groups’ satellite temperature estimates while omitting others? Why do they neglect temperature measurements in the oceans and Earth’s surface where the warming is clear? Why do they falsely claim that there has been a halt or even a slowdown in overall global warming when no such halt or even slowdown has occurred, and in fact the warming is accelerating?
Why do some of these witnesses refer to their own publications after they were shown to be hugely in error, containing undergraduate-level math errors? Why don’t these contrarians and Ted Cruz tell us that the referenced satellite temperature recording team (Remote Sensing Systems) disagree with the way their dataset is being used?


Thanks.
btw, the 2015 temperatures are now at NOAA http://www.ncdc.noaa.gov/cag/time-series/global
2015 is a scorcher, deniers better jump right to the stratosphere data.
[PS] Fixed link. Please use the link tool in the comments editor to create links.
Oh, John, I feel your pain. To see Ted Cruz in action I fear for America. Curry, Happer and Christy were just plain embarrassing. Though I think Mayer, Schatz, Peters, Markin and Nelson deployed Titley powerfully and science shone over dogma.
I recently found (possibly through this site) James White's Colorado presentation to be a compelling expose of climate science clearly establishing the fundamental elements of climate change. White manages to sweep away the clutter of "complicated science" to reveal the undeniable basic principles.
https://www.youtube.com/watch?v=FmyBAUR7GZU
Was Cruz definitely using the TMT channel in the chart presented at "Data or Dogma"? I know he had trouble figuring out where the chart came from, before finally finding that it was RSS, but I never heard clearly whether it was TLT or TMT.
gregcharles @3, there are (at least) two graphs of satellite data used in the hearing. The first, introduced by Happer, shows the average of RSS and UAH TMT data against the average of four ballon datasets. It is shown above in the OP.
The second, shown by Ted Cruz himself is of RSS TLT data from March 1997 to Novemer 2015, and is shown below:
It should be noted that Admiral Titley's point about the start point is valid, but limited. That is because the strong La Nina's in 2008 and again in 2001/12 contribute as much to the low trend as does 97/98 El Nino. Ergo, in 2016 when RSS finally shows the current EL Nino (which it currently does not due to a well known lag), the trend will still be below what would be expected if there were no short term variations.
I might add that watching the video was distinctly unpleasant. It leads me to the belief that the purpose of a congressional hearing is to give the chair of that hearing the chance to see just how many lies he can fit into a three minute speach. Virtually everytime Cruz stated something was the position of climate scientists, he got it egregiously wrong.
It occurs to me that part of the reason people buy the "satellites are more accurate" line is that they never see graphs of the raw data. I'm not sure where you could find a graph of the true raw data, and certainly would not be able to make one. But Po-Chedley et al (2014) have a graph of minimally processed data:
As I understand it, the top panel already has processing in the form of a rough alignment of means ot each satellites series. At least, it would be stunning if such a close allignment of absolute values was achieved in raw data from satellites. For comparison, here are the absolute alignment of satellite measurements of the solar constant:
Certainly similar problems of alignment are experienced by Earth observing instruments measuring the IR spectrum, and I see no reason why the microwave observing instruments (which operate on the same principles as the IR and solar observing instruments) should be any different.
Further, it is possible that the top panel in Po-Chedley's figure 3 also includes adjustments for problems with the hot target.
In any event, the transition between the top panel and the third panel is not a given. It represents serious adjustment to the data - and different teams disagree about how that adjustment is best done. As a result they also significantly differ about satellite data trends.
This blog provides a very valuable service to people interested in climate change. I would however, like to see a minor expansion of the list of climate myths to include something like "A Technological Miracle Will Save Us." My first objection to this myth is that it implies that we don't currently have the technology necessary to end most greenhouse gas emissions. Clean energy sources combined with new electric grid infrastructure and some battery storage can reliably provide all of our power needs without any significant technological advancements. Carbon capture and storage methods are currently insufficient, but may require only a change in farming methods.
My second problem with this myth is that new technology will still require implementation. There may well be someone out there that will or even has invented a new, much more efficient solar panel, or a new battery that costs far less than those currently available, or some device capable of cheaply removing carbon from the atmosphere and storing it as a solid. Such inventions would of course be welcome, but whatever technological solutions are available will still require massive investments of money, labor, and political will to implement. We would still need to stop subsidising fossil fuel use, use public funds to create the necessary infrastructure to accomadate the new technologies, and ensure that any new technologies are implemented in a safe and responsible manner.