


 Arguments


Western Canada’s glaciers could shrink by as much as 95% by 2100, study finds
Posted on 16 April 2015 by Guest Author
This is a re-post from Robert McSweeney at Carbon Brief
The Canadian Rockies, which sit as a backdrop to many a stunning vista, could be almost entirely devoid of glaciers by the end of the century, a new study suggests.
Researchers modelled the impact of rising temperatures on glaciers across western Canada.
The results show widespread ice loss by 2050, and ice all but vanishing a few decades later.
Rising temperatures
Around 27,000 square kilometers of Western Canada is covered by glaciers, an area similar in size to the amount of ice in the Himalayas or the whole of South America.
For the new study, published in Nature Geoscience, the researchers developed a model to see how rising temperatures will affect the volume and area of glaciers in three regions in western Canada. These regions are shown in the map below: the coast (green sections), the interior (pink) and the Rockies (blue).
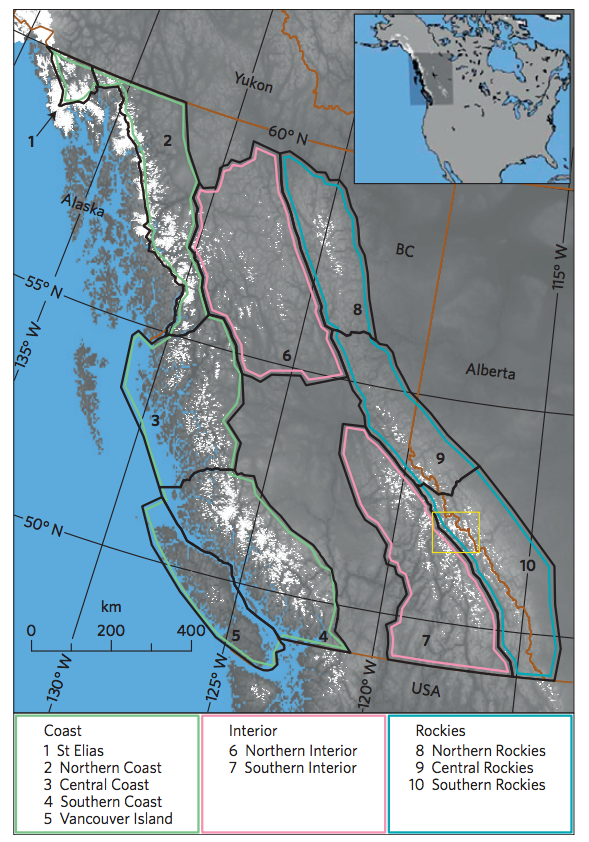
Map of study area in western Canada, including three subregions of the Coast (green), Interior (pink) and Rockies (blue). Present-day (2005) glacier extent is shown in white. Source: Clarke et al (2015)
The researchers looked at how temperature evolved under four different scenarios for future greenhouse gas emissions. Their model then calculated the amount of ice loss for glaciers in each region for each scenario.
You can see in the graphs below the striking losses of ice the model calculates. Even under the most stringent emissions cuts (RCP2.6, shown by the blue lines), glaciers in the Interior (bottom left graph) and Rockies (top right) regions are projected to lose around 70% of their ice compared to 2005. Under higher emissions, they would lose 95% of their ice.
Up until the middle of the century, the fate of most glaciers is similar for all four scenarios, the researchers say. But by 2100, there is a clearer separation between the amount of ice loss for each one.
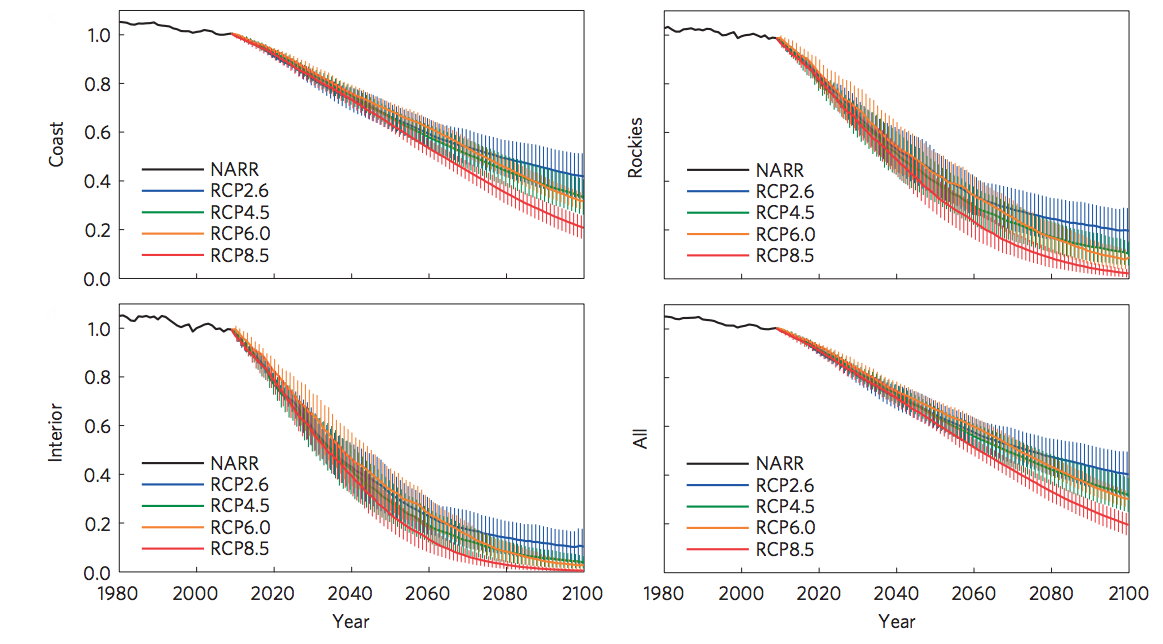
Project percentage changes for ice volume of glaciers in each region: Coast (top left), Interior (bottom left), Rockies (top right) and All (bottom right). For four emissions scenarios, from lowest (RCP2.6, blue) to highest (RCP8.5, red). NARR (black) shows observed changes. Source: Clarke et al (2015)
Unhelpful effects
The projected decline in ice volume is mainly caused by rising temperatures, Prof Garry Clarke, lead author and professor of glaciology at University of British Columbia, tells Carbon Brief:
"This has two different effects, neither of which is helpful to glaciers: One is more summer melting, and, two, is less winter snowfall."
Precipitation could actually increase under climate change, says Clarke, but rising winter temperatures mean it is more likely to fall as rain than as snow. And this is of no benefit to glaciers.
Ice loss is least drastic in the coastal region as it tends to receive more snow during winter, and cooler temperatures mean it loses less ice in summer, Clarke says. The glaciers in the very northwest are the most resilient to warming because they are at a higher elevation and get more snow than the other areas.
'Cutting-edge'
The researchers' methods are at the cutting-edge for studying the fate of glaciers across large regions, says Dr Tobias Bolch, a senior glacier researcher at the University of Zurich, who wasn't involved in the study.
Glacier models tend to consider either an individual glacier in detail, or ice changes across a region more broadly, says Clarke. Theirs is the first to model both, analysing many glaciers in detail at the same time.
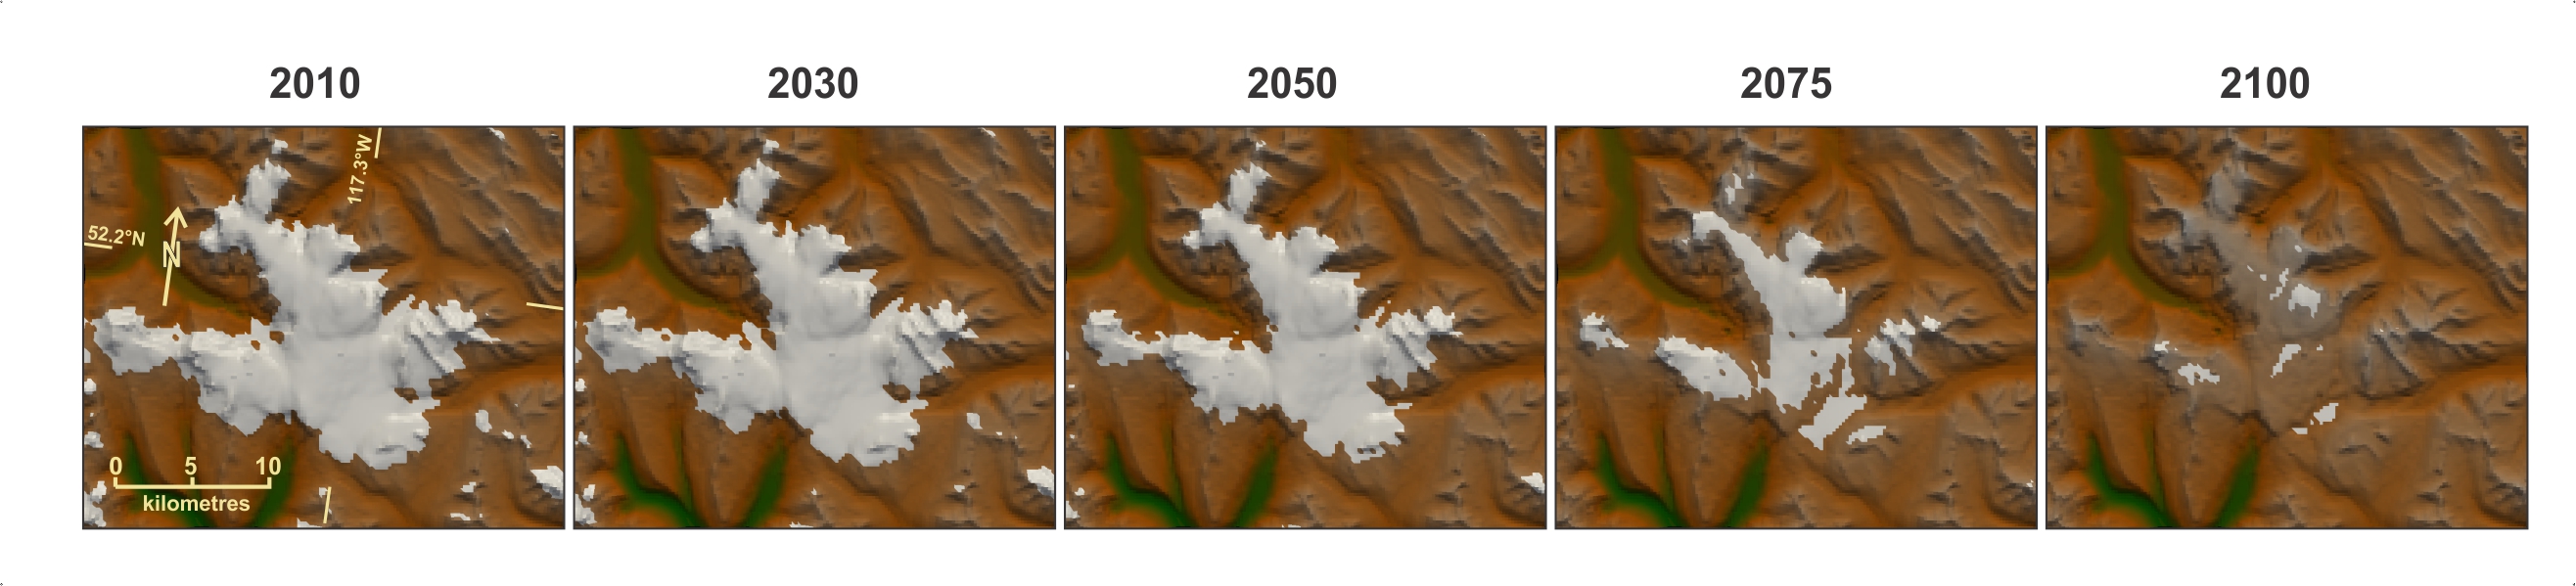
Glacier model images of projections of ice extent for the Columbia Icefield during the 21st century, under a high emissions scenario (RCP8.5). Credit: Garry Clarke.
Dr Alex Gardner, a solid earth research scientist at the Jet Propulsion Laboratory at Caltech, tells Carbon Brief that the study manages to model the flow of ice in the glaciers:
"Since mountain glaciers, by definition, are located in areas of complex topography, modeling this redistribution of ice has proven challenging at large scales. Garry Clarke and his colleagues make a considerable contribution to the field of glaciology by developing and employing a mathematical framework to do just this."
The authors have also made all the projections available online, so that other scientists can build on their work.
'Future is dim'
The loss of these glaciers would contribute around 6mm to global sea levels. This is relatively modest, says Clarke, but there are other impacts that he thinks could be more of a concern.
For example, the glacier meltwater feeds alpine streams, keeping the region cool during hot, dry summer months. Losing this natural thermostat would affect freshwater ecosystems, he says.
But Clarke thinks the major loss will be the visual changes to the landscape as mountains lose their glacier cover. The glaciers provide a key tourist attraction. The Athabasca Glacier in the Rockies, for example, is the most-visited glacier in North America. Millions of people each year visit to clamber over the huge mass of ice, yet it is retreating and thinning already, says Clarke:
"Athabasca Glacier is doing badly at present and will fare worse as climate warming continues."
Canada's Glacier National Park, which sits in the 'interior' region of the study, will experience near-total loss of its glaciers by 2100, says Clarke.
The glaciers also give Canada's iconic mountain lakes their distinctive colour. Fine sediments, known as rock flour, are eroded by glaciers and then washed downstream by meltwater.
Banff National Park, for example, attracts 3-4 million tourists every year, many of whom come to see its brilliant emerald lakes, such as Lake Louise. However, as the glaciers disappear, these lakes will look very different by the end of the century, Clarke warns:
"The future of this kind of tourism is dim."
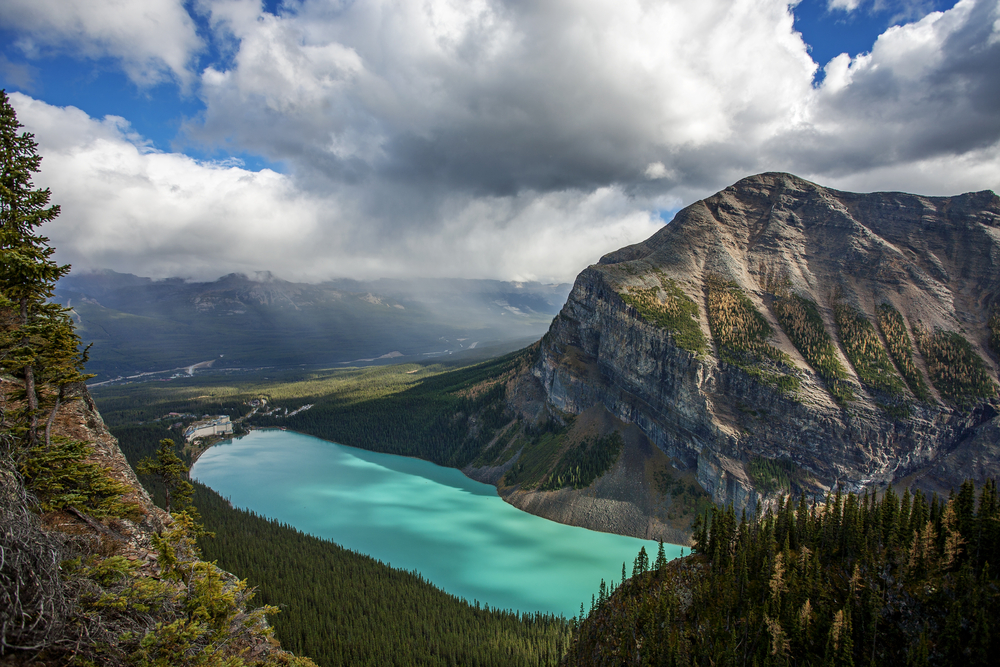
Lake Louise, as seen from the Big Beehive mountain. Source: Shutterstock
So, is there any good news from this study? Clarke thinks the glaciers and lakes could still have a future if we act quickly to cut emissions. He says:
"If we had the global will to hold to the mildest likely scenario for greenhouse gas increases, mountain glaciers would not entirely disappear from our study area."
Clarke, G.K.C. et al. (2015) Projected deglaciation of western Canada in the twenty-first century, Nature Geoscience, doi:10.1038/ngeo2407


Those abrupt changes in slope between past and projected trends do not make these projections look particularly credible, particularly for the Interior. I wonder what step change the models have happening at the present moment?
Intuitively, I would expect the future shape may look more like the increasing slope of current actic sea ice plots.
Yes, I wondered about the abrupt changes as well. Perhaps someone more knowledgable can explain them, as the article doesnt really do so.
The graphic presentations could have been less questionable if they had included the line of multi-year averages through the historical values. And it may have been helpful to include values prior to 1980 even if they were from a less precise information source or evaluation.
The model forecast will be a multi-year average trend line. Models are not set up to predict the rather random yearly variability of the systems they model. That would be a waste of time and effort.
The forecast average line will look 'out of line' with the jagged annual historical data line, especially when the most recent annual line was going up (as is the case with this report).
A clearer way to present this would be to have the average line through the historical data presented by a line matching the intensity of the forecast line, with the annual jagged line being a less intense background-style presentation.
@1, 2, 3: Yes, it makes it look as if we are at a precipice. But maybe we are, and this just depicts it graphically. We are aware of the potentail abyss from other works, this may just show how close we are. But you are right, that should have been the point of the article.