What does Solar Cycle Length tell us about the sun's role in global warming?
Posted on 17 January 2010 by John Cook
When I get the time (eg - rarely), I've been updating older content amongst the responses to skeptic arguments. One page that distinctly needed some TLC was the response to the argument that solar cycle length proves the sun is causing global warming. This argument is based on a study published nearly 20 years ago but also requires that you ignore any research since 1991. Here is what the latest data on solar cycle length tells us about the sun's role in recent global warming.
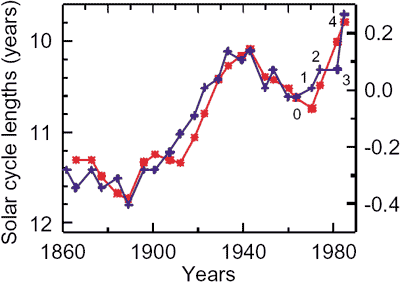
Solar cycle length is a useful indicator of long term changes in solar activity. When the sun gets hotter, we observe shorter solar cycles. When the sun shows a long term cooling trend, solar cycle length is longer. A 1991 study by Friis-Christensen and Lassen smoothed out data on solar cycle length and compared it to Northern Hemisphere temperature (Friis-Christensen 1991). The authors suggested the close correlation between solar cycle length and temperature supports the direct influence of solar activity on climate over the past 130 years. Note in particular the close correlation after 1980 during the modern global warming trend.

Figure 1: Changes in solar cycle length (blue crosses) versus change in Northern Hemisphere temperature (red *).
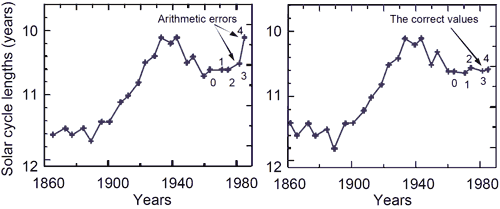
However, the solar cycle data presented in Figure 1 consists of two incongruous sets of data. The first 20 points of the graph are smoothed using a 1-2-2-2-1 running average. However, the last 4 points (marked 1 to 4 in the figure below) are not filtered in the same manner. Points 1 and 2 are only partially filtered. Points 3 and 4 are not filtered at all. In effect, it's like marrying two separate sets of data. When the latest data points are properly filtered using the latest solar data, the increasing in solar cycle length from 1980 disappears (Laut 2003).

Figure 2: Left: Original solar cycle length data from Friis-Christensen 1991. The last two points, 3 and 4 are due to errors in the authors’ arithmetic. Right: Updated solar cycle lengths using latest data from Thejll 2000.
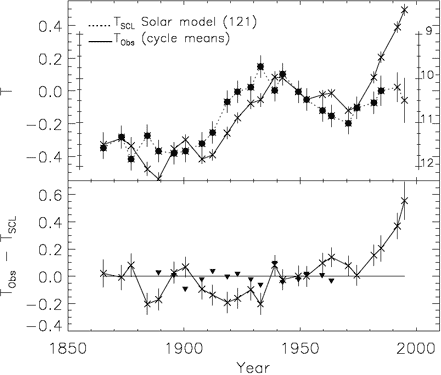
In 1999, one of the co-authors of the original 1991 paper updated their analysis with the latest data (Lassen 1999). They found that the solar cycle length showed no trend in the last few decades of global warming. They concluded that "since around 1990 the type of Solar forcing that is described by the solar cycle length model no longer dominates the long-term variation of the Northern hemisphere land air temperature".

Figure 3: the top figure compares temperature to solar cycles. The bottom figure plots the difference between temperature and solar cycle length, showing a strong divergence in the mid 1970s (Lassen 1999).
Other studies confirm Lassen's conclusion:
- Kelly 1992 models the effects of a combination of greenhouse and solar-cycle-length forcing and compare the results with observed temperatures. They find that "even with optimized solar forcing, most of the recent warming trend is explained by greenhouse forcing".
- Laut 1998 analyses the period 1579–1987 and finds "the solar hypothesis—instead of contradicting—appears to support the assumption of a significant warming due to human activities".
- Damon 1999 uses the pre-industrial record as a boundary condition and finds the SCL-temperature correlation corresponds to an estimated 25% of global warming to 1980 and 15% to 1997.
- Benestad 2005 concludes "There have been speculations about an association between the solar cycle length and Earth's climate, however, the solar cycle length analysis does not follow Earth's global mean surface temperature. A further comparison with the monthly sunspot number, cosmic galactic rays and 10.7 cm absolute radio flux since 1950 gives no indication of a systematic trend in the level of solar activity that can explain the most recent global warming".
Claims that solar cycle length prove the sun is causing global warming are based on a single paper published nearly 20 years ago. Subsequent research, including a paper by a co-author of the original 1991 paper, finds the opposite conclusion. Solar cycle length as a proxy for solar activity tells us the sun has had very little contribution to global warming since 1975. In fact, direct measurements of solar activity indicate the sun has had a slight cooling effect on climate in recent decades while global temperatures have been rising.


 Arguments


Comments