Climate Science Glossary

Term Lookup

Enter a term in the search box to find its definition.

Settings

Use the controls in the far right panel to increase or decrease the number of terms automatically displayed (or to completely turn that feature off).

Term Lookup

Settings


All IPCC definitions taken from Climate Change 2007: The Physical Science Basis. Working Group I Contribution to the Fourth Assessment Report of the Intergovernmental Panel on Climate Change, Annex I, Glossary, pp. 941-954. Cambridge University Press.

Home Arguments Software Resources Comments The Consensus Project Translations About Support

Twitter Facebook YouTube Mastodon MeWe

RSS Posts RSS Comments Email Subscribe


Climate's changed before
It's the sun
It's not bad
There is no consensus
It's cooling
Models are unreliable
Temp record is unreliable
Animals and plants can adapt
It hasn't warmed since 1998
Antarctica is gaining ice
View All Arguments...


Username
Password
New? Register here
Forgot your password?

Latest Posts

Archives

What does Solar Cycle Length tell us about the sun's role in global warming?

What the science says...

The claim that solar cycle length proves the sun is driving global warming is based on a single study published in 1991. Subsequent research, including a paper by a co-author of the original 1991 paper, finds the opposite conclusion. Solar cycle length as a proxy for solar activity tells us the sun has had very little contribution to global warming since 1975.

Climate Myth...

Solar Cycle Length proves its the sun

In 1991, Eigil Friis-Christensen and Knud Lassen published an article claiming "strikingly good agreement" between solar cycle lengths (the fluctuating lengths of cycles undergone by sunspot numbers) and northern hemisphere land temperatures over the period 1860–1990 (Friis-Christensen 1991).

Solar cycle length is a useful indicator of long term changes in solar activity. When the sun gets hotter, we observe shorter solar cycles. When the sun shows a long term cooling trend, solar cycle length is longer. A 1991 study by Friis-Christensen and Lassen smoothed out data on solar cycle length and compared it to Northern Hemisphere temperature (Friis-Christensen 1991). The authors suggested the close correlation between solar cycle length and temperature supports the direct influence of solar activity on climate over the past 130 years. Note in particular the close correlation after 1980 during the modern global warming trend.

 
Figure 1: Changes in solar cycle length (blue crosses) versus change in Northern Hemisphere temperature (red *).

However, the solar cycle data presented in Figure 1 consists of two incongruous sets of data. The first 20 points of the graph are smoothed using a 1-2-2-2-1 running average. However, the last 4 points (marked 1 to 4 in the figure below) are not filtered in the same manner. Points 1 and 2 are only partially filtered. Points 3 and 4 are not filtered at all. In effect, it's like marrying two separate sets of data. When the latest data points are properly filtered using the latest solar data, the decrease in solar cycle length from 1980 disappears (Laut 2003).


Figure 2: Left: Original solar cycle length data from Friis-Christensen 1991. The last two points, 3 and 4 are due to errors in the authors’ arithmetic. Right: Updated solar cycle lengths using latest data from Thejll 2000.

In 1999, one of the co-authors of the original 1991 paper updated their analysis with the latest data (Lassen 1999). They found that the solar cycle length showed no trend in the last few decades of global warming. They concluded that "since around 1990 the type of Solar forcing that is described by the solar cycle length model no longer dominates the long-term variation of the Northern hemisphere land air temperature".


Figure 3: the top figure compares temperature to solar cycles. The bottom figure plots the difference between temperature and solar cycle length, showing a strong divergence in the mid 1970s (Lassen 1999).

Other studies confirm Lassen's conclusion:

  • Kelly 1992 models the effects of a combination of greenhouse and solar-cycle-length forcing and compare the results with observed temperatures. They find that "even with optimized solar forcing, most of the recent warming trend is explained by greenhouse forcing".
  • Laut 1998 analyses the period 1579–1987 and finds "the solar hypothesis—instead of contradicting—appears to support the assumption of a significant warming due to human activities".
  • Damon 1999 uses the pre-industrial record as a boundary condition and finds the SCL-temperature correlation corresponds to an estimated 25% of global warming to 1980 and 15% to 1997.
  • Benestad 2005 concludes "There have been speculations about an association between the solar cycle length and Earth's climate, however, the solar cycle length analysis does not follow Earth's global mean surface temperature. A further comparison with the monthly sunspot number, cosmic galactic rays and 10.7 cm absolute radio flux since 1950 gives no indication of a systematic trend in the level of solar activity that can explain the most recent global warming".

Claims that solar cycle length prove the sun is causing global warming are based on a single paper published nearly 20 years ago. Subsequent research, including a paper by a co-author of the original 1991 paper, finds the opposite conclusion. Solar cycle length as a proxy for solar activity tells us the sun has had very little contribution to global warming since 1975. In fact, direct measurements of solar activity indicate the sun has had a slight cooling effect on climate in recent decades while global temperatures have been rising.

Last updated on 26 October 2016 by John Cook. View Archives

Printable Version  |  Offline PDF Version  |  Link to this page

Argument Feedback

Please use this form to let us know about suggested updates to this rebuttal.

Comments

1  2  Next

Comments 1 to 25 out of 35:

  1. Re John Cook, 6/26/10, Solar Cycle Length A five parameter, causal filer of the Wang, et al. (2005) solar radiation model predicts the entire 140-year HadCRUT3 record of annual surface temperature with one standard deviation of 0.11ºC. With three parameters, the fit is 0.13ºC. See SGW. The accuracy is within 10% (variance reduction ratio of 79.0% vs. 89.3%) of IPCC's non-causal, smoothed estimate for surface temperature. Published 3/27/10, rev. 4/17/10. Is there a comparable result in all of climatology?
  2. tblakeslee - Note that Friis-Christensen 1991 simply does not hold up due to simple math errors. Landscheidt's theories of cycle length to temperature, based upon that information, are equally unsupported. Once you pass 1970, where CO2 warming really separates from natural variability, and insolation decreases, it becomes extremely clear that the CO2 effects are overriding solar changes.
  3. tblakeslee - In previous threads your hypothesis seemed to be that temperature was controlled by cosmic ray levels, not CO2. Now it's solar cycle length (Landscheidt) and momentum, not CO2? I hate to say it, but I'm seeing a certain lack of consistency here.
  4. A new paper presents evidence that changes in solar cycle length can account for roughly 40 to 50 percent of the historic change in average temperature at a number of stations in coastal Norway. See Solheim Stordahl and Humlum, The long sunspot cycle 23 predicts a significant temperature decrease in cycle 24, in Journal of atmospheric and solar terrestrial physics, February 2012. The scientists have found that in this area, the solar cycle length is predictive of temperatures after a delay of 9 to 12 years, which delay they believe is related to the time frame for solar influences in the tropics to affect the north Atlantic ocean near Norway. They also make a very specific prediction that the extended length of solar cycle 23 will lead to significant cooling in their area of study. This theory will be tested as we see what happens with temperatures over the next ten years. If they are correct, then solar influence on temperature is much more significant, and the effect of co2 much less significant, than the consensus climate science would argue.
  5. tompinlb @4, the fact that the researchers chose to examine the impact of a global effect using only very localized data screams cherry pick to me. If solar cycle length genuinely explains changes in surface temperatures, it would do so globally for the sun is a global influence. Why then did the researchers not apply their techniques to a global temperature index? My guess is that they did, and did not like the result, so they started looking around for a set of local data sets that would give them results they liked. Given the number of such local data sets, it was inevitable they would find something.
  6. tompinlb @ 4, you did not provide a link to the paper you cited. Which journal published it? Do you have a link?
  7. My comment @5 appears to be in error to this extent at least - the paper in question does discuss global temperatures. I will reserve further comment until I have read the paper more closely: http://www.au.agwscam.com/pdf/SolheimSolarTemperature.pdf
  8. Doug H @6 and Tom Curtis @7: I believe the link provided by Tom Curtis is an early draft of the paper. A more extensive version and corrected proof of the paper is found online at http://www.sciencedirect.com/science/article/pii/S1364682612000417 This is in the Journal of Atmospheric and Solar-Terrestrial Physics. This version of the paper presents a more complete statistical analysis including an analysis of residuals that was not included in the earlier version of the paper cited by Tom Curtis.
  9. I do not understand why this page includes the following statement for "What the Science Says:" The claim that solar cycle length proves the sun is driving global warming is based on a single study published in 1991. Subsequent research, including a paper by a co-author of the original 1991 paper, finds the opposite conclusion. Solar cycle length as a proxy for solar activity tells us the sun has had very little contribution to global warming since 1975. This is neither current nor accurate.
  10. Let's put tompinlb's new great hope into context. Below is figure 1 from the paper, showing solar cycle lengths since 1680: The first thing you should notice is that it looks nothing like the solar cycle lengths from 1860 as shown in Friis-Christensen 1991, particularly in the early part of the 20th century. One or the other of these papers has got the solar cycle lengths wrong, and possibly both. Given the central role of solar cycle length in this theory, that does not inspire confidence. The second thing to do is to assume that the theory is not simply astrology. By that, I mean that the theory must postulate some causal connection between solar cycle length and global temperatures. The connection may be indirect. It may be that some factor causes the changes in solar cycle length and also through an extended causal chain causes the changes in global temperature, but it must exist. Given that, we expect temperatures to significantly track solar cycle length if the theory is true. That would mean that global temperatures peak for the 20th century in 1930 (remembering to allow for the lag). They would then have remained almost constant with only a slight downward trend until a very sharp dip in the 1980's, followed by a sharp rise, although not to temperatures experienced in 1930. Now, we can allow that there is some general trend on top of that pattern, and some noise disrupting that pattern, but the pattern should still be discernible. So what do we get? We get an early temperature peak a decade too late, 1980's temperatures above that early peak and a continuing sharp rise in temperatures. That pattern is almost completely dissimilar, with the only thing in common being a rising trend over the 20th century. In other words, this paper is arguing a connection between temperature and solar cycle length on a basis which would equally well establish a connection between global temperatures and the hemlines of skirts. We better hope we have no return to Victorian mores, or else we'll have a little ice age again ;)
  11. The authors of the paper discuss in some detail the method they use to calculate the length of the solar cycle. If you wish to criticize their approach, it would be more helpful if you raised specific objections to their method. You state that their method yields different results than Friis-Christensen 1991, but you do not address the substance of the authors’ method. You make a comment that we must “assume the theory is not simply astrology.” The authors are respected scientists, not astrologists. Is this an ad hominem criticism? There are various theories that posit causal relationships between solar activity and changes in global temperature. One of the more interesting posits a relationship between solar magnetic flux, the incidence of cosmic rays in the earth’s atmosphere, and the formation of low level clouds especially in the tropics. The research exploring these relationships is a work in process, but there are clear theories of causality that are being investigated. This is hardly astrology. You say that “we expect temperatures to significantly track solar cycle length if the theory is true.” And then you proceed to say what you think this would mean, and how it would show up, peaking in 1930, etc. But you do no analysis here, and you ignore the actual analysis and results of the authors’ work. In this paper they demonstrate that for a number of stations in Norway and the North Atlantic, temperatures do in fact significantly track solar cycle length. Do you take issue with their methods and their statistical analysis? When skeptical scientists point out that global temperatures in the last ten to fifteen years have not risen as fast as they had been projected to rise by the IPCC models, while CO2 continues to increase steadily, advocates of catastrophic anthropogenic global warming respond that other factors affect global temperatures, that the heat is hidden in the ocean, etc. So when you say that temperatures should significantly track solar cycle length, you do not allow for other influences. So this appears to be a straw man argument. The authors postulate a mechanism that solar influences affect the absorption of heat by the tropical oceans, and that this heat in turn affects surface temperatures as it is distributed through the oceanic circulation. They also acknowledge that the lag between solar heating influences and surface temperature varies depending on how many years it takes for these influences to reach various parts of the earth. These authors make specific forecasts that can be tested, and we will see whether temperatures do in fact decline in the areas they identify. I give them credit for that. It would be more helpful to the progress of science if those who argue for the singular importance of CO2 to global temperatures would make falsifiable hypotheses that can be rigorously tested. Many of us thought that the IPCC’s prediction of a tropospheric hot spot would be a testable hypothesis for the presence of water vapor amplification/positive feedback, which is assumed in their models, but instead it seems most defenders of the consensus science now argue that it is really there but there are problems with the thousands of radiosondes that can’t find it. Your criticisms and straw man argument do not address the substance of the arguments that are being made by the authors. And when you conclude that their work has no more substance than projecting temperatures based on hemlines, one must conclude that your prefer to argue with humour and insults rather than seriously address the paper.
  12. Journal of Atmospheric and Solar-Terrestrial Physics? They also published Scafetta's climatastology paper. Did they publish Humlum's 2011 nonsense too? What's intriguing here is the idea that a very small forcing in sun can account for temperature variation, yet much larger forcings do not. However, like Scafetta's curve-fitting, it makes predictions that can be quickly refuted. However, because of the nature of curve-fitting, I am sure some new and exciting other variable will found by skeptics when these have failed.
  13. @tompinlb It is not an insult to the authors to bein by assuming it isn't astrology. Sadly there are a number of papers on similar topics that are little more than climastrology. The assumption was that this wasn't one of them. There are several posts on SkS about galactic cosmic rays and their influence on climate. You will find that the evidence for GCRs having a large effect on climate is rather slight. It would be a good idea for you to familiarise yourself with the existing discussion. Your post also includes some incorrect ideas (e.g. the tropical hotspot) which is the expected result of any surface warming, regardless of whether it is due to CO2 or not. I rather doubt that anyone seriously questions the fact that the surface has warmed so that would suggest that the problem may well lie with the radiosondes. Arguing with good natured humour is often a good idea, and pointing out problems (in this case correlation is not causation) using a simple analogy similarly helps to get the point accross. I don't think anyone has been insulted so far, so please try not to escalate any misunderstanding. We are happy to discuss the science here. The best thing to do is to raise a single point in each post as that facilitates the discussion reaching a conclusion on that issue, rather than get lost in a broad multi-branched discussion.
  14. tompinlb#11: "for a number of stations in Norway and the North Atlantic, temperatures do in fact significantly track solar cycle length. " You omit a significant detail: No significant trend is found between the length of a cycle and the average temperature in the same cycle, but a significant negative trend is found between the length of a cycle and the temperature in the next cycle. --emphasis added What is the mechanism that allows temperature to lag the sunspot cycle by 11 years? How can that be, given other research showing no evidence of such a lag? The temperature anomalies in the Northern and Southern hemispheres show similar statistical relations with the solar and geomagnetic indices. The cross-correlation analysis shows no statistically significant global temperature lag behind the sunspots as well as behind aa-indices.
  15. Dikran@13, I appreciate the suggestion that it may be more productive to consider one matter at a time. Let's start with the tropical hotspot. I have read the Skeptical Science postings on the tropical hotspot. My understanding of the theory is that the tropical hotspot, if it were to exist, would be an indicator of the amplification of surface warming by water vapor in the upper troposphere. It would be an indicator that the positive feedback mechanism of water vapor, hypothesized by mainstream AGW theory, is significant. And I agree, as you say, that according to this theory, the tropical hotspot would be the expected result of any surface warming, not just that driven by CO2. The absence of the tropospheric hotspot would imply that the hypothesized water vapor positive feedback mechanism does not work as AGW theory, as embodied in climate models, assumes. This goes to the heart of the dispute over climate sensitivity. I think you are mistaken when you draw the conclusion that because everyone agrees the surface has warmed, then there may well be a problem with the radiosondes. Is there any published evidence for the actual existence of the tropical hotspot? Radiosondes measure temperatures with resolution of 0.1 degree. Now rather than conclude that there is a problem with thousands of readings from hundreds of radiosondes, over many years, I would suggest that an alternative hypothesis is that there is, indeed, no tropical tropospheric hot spot, and that the AGW hypotheses about the mechanisms and the magnitude of water vapor amplification / positive feedback are in error. In the face of the radiosonde evidence, does that not seem to be a reasonable alternative hypothesis? Which is the more reasonable conclusion, that all of the radiosonde data is in error, or that the AGW water vapor amplification hypothesis is in error?
    Response: [Dikran Marsupial] Discussions at SkS are kept focussed on specific issues and off-topic posts are normally deleted. Please could you re-post your comment on the thread about the tropical hotspot and I can delete it from this one to keep things tidy. Any responses to this post should similarly be made on the thread indicated (I'll look in tomorrow - its past my bed-time already! ;o) N.B. I have now posted a response on the appropriate thread.
  16. tompinlb#11: "But you do no analysis here, and you ignore the actual analysis and results of the authors’ work." So let's look at those results, thoughtfully presented in consistent graphical form in their figures 4-19. For example, their fig 4 (Tromso, Norway): Note the rate of temperature increase at this location: 0.36 deg C per 100 years. Most of the following figures are locations that show similar temperature increases. However, we see rates of 0.18 deg C per decade in much of the northern hemisphere. In other words, the authors have selected locations that show minimal warming. They are effectively analyzing the noise, rather than the signal. However, figure 13 (Archangel, Russia) shows the most significant warming, at 1.4 deg C per century. In the upper panel, the temperature is 'corrected' for this sunspot cycle length. Despite that 'correction,' the upper panel clearly shows additional warming of more than 1 degree C since the 1970s. In that time period, figure 1 (posted by Tom C above), sunspot cycle length has no discernible trend. How, then does cycle length explain away that warming?
  17. muoncounter, your argument is specious. You first select as an example the authors’ analysis of the Tromso Norway station, which had a temperature change of 0.036 degC per decade. Of all the stations studied by the authors, this shows the least warming. Is this cherry picking on your part? The average change of the seven stations in Norway investigated by the authors was 0.068 degC per decade. The average for Norway, per the author’s Table 1, was 0.56 degC per decade; the average for HadCRUT3N in this same table is shown as 0.47 degC per decade. So the seven stations investigated by the authors had an average rate of change that was 145% of the average global temperature change shown by HadCRUT3. Thus your assertion – that the “authors have selected locations that show minimal warming. They are effectively analyzing the noise, rather than the signal.” – is not consistent with the evidence. The stations selected by the authors show rates of change well in excess of the HadCRUT average. What is the basis for your assertion that they are analyzing the noise rather than the signal? You then select station Archangel Russia with a change of 0.14 degC per decade and ask how the authors can “explain away the warming” since the 1970’s. This station has experienced a rate of temperature change that is 300 percent of the average rate of change shown for HadCRUT3. At no place in this paper do the authors purport to explain 100 percent of the temperature changes in any of the stations, let alone one where temperature has increased three times as fast as the global average. They only make the argument, and provide the evidence to support the argument, that previous solar cycle length explains from 40% to 60% of the historic change in temperatures in the stations that they investigated.
  18. tompinlb @11 suggests that forcings as determined by the IPCC show a similar lack of predictive ability to solar cycle length when it comes to temperatures. That is simply not true: To further reinforce the point, here is a direct comparison between solar cycle length as determined by Solheim et al and global temperatures lagged by approximately one solar cycle (as required by their theory): 
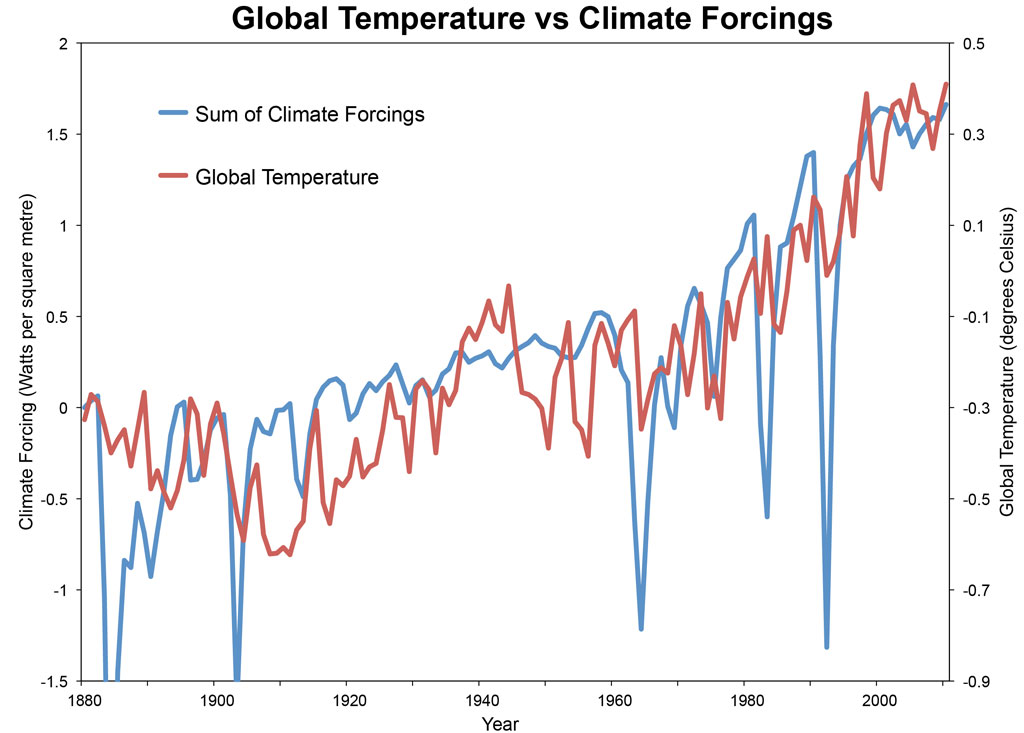
Solheim et al (and tompinlb) want us to believe that the changes in solar cycle length are responsible for 40% of the trend in global temperatures. They think that is a better theory than that the temperature increase is explained by known forcings. I suggest that represents desperation (anything but CO2), not analysis. (Unfortunately my longer response covering a number of additional points got eaten by the gods of the web. I may bring up some of those additional points in a later post.) Edited: 5:41pm to show corrected image.
  19. tompinlb @ 17, you speak of "Archangel Russia with a change of 0.14 degC per decade" and then state "This station has experienced a rate of temperature change that is 300 percent of the average rate of change shown for HadCRUT3", yet earlier you made the point "the average for HadCRUT3N in this same table is shown as 0.47 degC per decade". I am confused, or misreading the figures, but 0.14 is not 300% of 0.47 in my book. Have I misunderstood something? Your final sentence reads "They only make the argument, and provide the evidence to support the argument, that previous solar cycle length explains from 40% to 60% of the historic change in temperatures in the stations that they investigated". I think you are mixing up correlation with causation. They have identified a weak correlation between temperature change and previous sunspot cycle length, without suggesting any mechanism by which the previous cycle is implicated in causing the temperature change. The apparent correlation is a curio, no more. As stated in the paper: "This indicates a possible existence of a physical mechanism linking solar activity to climate variations", which is really no more definite than linking hem-lines with global warming, or even hem-lines with solar cycles. They conclude "This indicates a connection between the behavior between the solar dynamo and temperatures on the Earth". Of course there is a connection! The forcing from TSI is already well explored and is taken into account when modelling future climate change, along with all the other known forcings. The observed influence of variations in TSI is slight and does not lag the solar cycle by 6 years, or 12 years, or any other arbitrarily selected time span. I would reword the final sentence of your comment @17 like this: "They make the allegation, without providing satisfactory evidence to support the allegation, that previous solar cycle length explains from 40% to 60% of the historic change in temperatures in the small sample of stations that they investigated, without proposing any credible mechanism by which this may have occurred and without showing how this mechanism has affected global mean temperatures.". If the authors had come up with a new theory that invalidated what we know already about forcings on climate, they would be in line for a Nobel Prize, instead of being relegated to publishing in a fringe journal. I believe I speak for everybody on this forum in saying we would be thrilled to discover that AGW is not real and we can all sleep easy in our beds. The Solheim, Stordahl and Humlum paper has not done anything to refute AGW, unfortunately for us.
  20. Doug H@19. Sorry for the transcription error, I put the decimal point in the wrong place. The statement should have read, "The average for HadCRUT3N in this same table is shown as 0.047 degC per decade," so the Archangel Russia change of 0.14 degC per decade is 300 percent of the HadCRUT3N number. That is why it is specious to accuse the authors of selecting only stations that show little heating. The conundrum I see is this. There are many historic paleoclimate studies that show strong correlation between various records of solar activity and temperatures from many places on earth, from the tropics to the poles. The relationship between solar activity, as evidenced by sunspot counts, and cold temperatures in the Maunder, Dalton, etc. minima appear to be clear. The advocates of anthropogenic warming argue that solar influence is minimal because total solar insolation does not vary greatly. It would seem likely there are mechanisms, that are not yet understood by science, which operate to amplify changes in the solar forcings, otherwise how could the paleoclimate relationships between solar activity and global temperatures be so strong. If the evidence presented in this paper is not satisfactory, what would constitute "satisfactory evidence to support the allegation," as you say. Why do you conclude that "the apparent correlation is a curio, not more," and then compare it again to hemlines. The authors are making specific forecasts that temperatures will be cooler in the next solar cycle at these stations. Do the IPCC suite of climate models predict that it will be warmer in the next solar cycle? It is the case, is it not, that the IPCC models project major warming in the northern regions such as the Norway sites that are studied by these authors. I understand the IPCC models lack skill in making forecasts of future temperatures (as opposed to hindcasts, which anyone can do), which may be a function of poor parameterization of critical factors such as clouds and soil moisture, among others. Is it not the case that over the last decade actual temperatures have increasingly diverged lower than the IPCC forecasts, all the while CO2 has been increasingly steadily? Thanks for your insights.
  21. tompinlb - there is absolutely no doubt that the climate responds to changes in solar activity and that solar has been major influence in the past. The problem with the solar explanation for current warming is that the solar signal is more or less flat, unlike the past. Solar proponents ask us to believe that a warming comparable with holecene climatic optimum in NH is happening in both hemispheres but without the same solar signal. The signal is consistant with GHG forcings and completely out of scale to other mechanisms. Furthermore, there is the problem of explaining why the measured increase in GHG forcing somehow is not involved in the warming. Do you have a problem with the instruments doing the measurements? The idea that actual temperatures have "increasing diverged" from IPCC models is just denialist posturing. Some detail can be found here. Furthermore the Rahmstorf and Foster paper reveals the signal more clearly when natural variation is removed. While the natural variation estimates are indeed curve-fitting, the scale of change in the natural forcing considered (temperature diff compared to change in energy), is believable from physics point of view (unlike humlum's effort).
  22. tompinlb Your last paragraph suggests that decadal scale forecasts are meaningful, however it is widely known that the internal variability of the climate (due to things like ENSO) is large compared to the expected trend due to GHGs, and I would expect also of solar influences. Making forecasts for station data is even less practical as the spatial averaging greatly attenuates the variance. If you want to suggest that the models lack forecasting skill, then you need to provide evidence that this is the case, rather than just boldly state it as a fact. Where there is suficient "test data", then the models perform pretty well (e.g. Hansen's original projections) Regarding your question "Is it not the case that over the last decade actual temperatures have increasingly diverged lower than the IPCC forecasts, all the while CO2 has been increasingly steadily?" This is a question that has been absolutely done to death. If CO2 were the only forcing and the internal variability of the climate were small, then yes it would be a surprise to see a lack of warming while CO2 levels are rising. However, neither of these assumptions are valid. Further discussion of this should be directed to a more appropriate thread, e.g. Global warming stopped in 1998 I offer this as well intentioned advice: You appear to be labouring under a number of misunderstandings about climate and model projections. Please before you post arguments, check what has already been discussed on these topics by reading the relevant posts on SkS. The list of most used climate myths at top left of the page would be a good place to start.
  23. tompinlb says "It would seem likely there are mechanisms, that are not yet understood by science, which operate to amplify changes in the solar forcings." These are called feedbacks and there is a sizeable litterature on the subject to say the least. They also have been abundantly discussed on SkS. If such mechanisms exist, why would they not also amplify other forcings than solar? Could they be selective as to the nature of the orignal forcing? How would that be possible? I note that tompinlb was recently arguing against the existence of the possible signature of a major feedback that certainly would be involved in amplification of solar changes (the tropospheric hot spot, possible evidence of water vapor feedback).
  24. tompinlb You've clearly misread both the figures and the authors' Table 1. The trends are given in degrees per 100 years, not degrees per decade. Svalbard and Archangel are the only stations analyzed that give a reasonable northern hemisphere temperature trend (1.6 and 1.4 degrees per 100 years, respectively). "The stations selected by the authors show rates of change well in excess of the HadCRUT average." Comparing a few tightly clustered stations with the entire northern hemisphere HADCRUT is the specious argument. Running the HADCRUT trend back as far as 1850 when Svalbard begins in 1910 is the specious argument. Drawing conclusions from such weakly defined trends as are shown in the center panels of figures such as those shown here is the specious argument. Perhaps you should review the long list of the papers shown here. For example, Benestad 2005: ... further comparison with the monthly sunspot number, cosmic galactic rays and 10.7 cm absolute radio flux since 1950 gives no indication of a systematic trend in the level of solar activity that can explain the most recent global warming.” Laut 2004: Analysis of a number of published graphs that have played a major role in these debates and that have been claimed to support solar hypotheses shows that the apparent strong correlations displayed on these graphs have been obtained by incorrect handling of the physical data. Thejll and Lassen 2000: ... since around 1990 the type of Solar forcing that is described by the solar cycle length model no longer dominates the long-term variation of the Northern hemisphere land air temperature. Finally, any prediction based on cycle analysis without an underlying physical mechanism is specious, which Google defines as "superficially plausible, but actually wrong."
  25. If it`s not the sun, was it a "positive back radiation feedback" as explained by Roy Spencer and used in the "Trenberth Energy budget"? Then I would like to know why the fins on power transistor heat sinks don`t "back radiate" each other into a China Syndrome melt down. The configuration to do so is even better than Roy Spencer`s "thought experiment". Here is a comparison: http://askbernhard.9f.com/

1  2  Next

Post a Comment

Political, off-topic or ad hominem comments will be deleted. Comments Policy...

You need to be logged in to post a comment. Login via the left margin or if you're new, register here.

Link to this page


The Consensus Project Website

THE ESCALATOR

(free to republish)


© Copyright 2024 John Cook
Home | Translations | About Us | Privacy | Contact Us