Climate Science Glossary

Term Lookup

Enter a term in the search box to find its definition.

Settings

Use the controls in the far right panel to increase or decrease the number of terms automatically displayed (or to completely turn that feature off).

Term Lookup

Settings


All IPCC definitions taken from Climate Change 2007: The Physical Science Basis. Working Group I Contribution to the Fourth Assessment Report of the Intergovernmental Panel on Climate Change, Annex I, Glossary, pp. 941-954. Cambridge University Press.

Home Arguments Software Resources Comments The Consensus Project Translations About Support

Bluesky Facebook LinkedIn Mastodon MeWe

Twitter YouTube RSS Posts RSS Comments Email Subscribe


Climate's changed before
It's the sun
It's not bad
There is no consensus
It's cooling
Models are unreliable
Temp record is unreliable
Animals and plants can adapt
It hasn't warmed since 1998
Antarctica is gaining ice
View All Arguments...


Username
Password
New? Register here
Forgot your password?

Latest Posts

Archives

Are surface temperature records reliable?

What the science says...

Select a level... Basic Intermediate Advanced

The warming trend is the same in rural and urban areas, measured by thermometers and satellites, and by natural thermometers.

Climate Myth...

Temp record is unreliable

"We found [U.S. weather] stations located next to the exhaust fans of air conditioning units, surrounded by asphalt parking lots and roads, on blistering-hot rooftops, and near sidewalks and buildings that absorb and radiate heat. We found 68 stations located at wastewater treatment plants, where the process of waste digestion causes temperatures to be higher than in surrounding areas.

In fact, we found that 89 percent of the stations – nearly 9 of every 10 – fail to meet the National Weather Service’s own siting requirements that stations must be 30 meters (about 100 feet) or more away from an artificial heating or radiating/reflecting heat source." (Watts 2009)

At a glance

It's important to understand one thing above all: the vast majority of climate change denialism does not occur in the world of science, but on the internet. Specifically in the blog-world: anyone can blog or have a social media account and say whatever they want to say. And they do. We all saw plenty of that during the Covid-19 pandemic, seemingly offering an open invitation to step up and proclaim, "I know better than all those scientists!"

A few years ago in the USA, an online project was launched with its participants taking photos of some American weather stations. The idea behind it was to draw attention to stations thought to be badly-sited for the purpose of recording temperature. The logic behind this, they thought, was that if temperature records from a number of U.S. sites could be discredited, then global warming could be declared a hoax. Never mind that the U.S. is a relatively small portion of the Earth;s surface. And what about all the other indicators pointing firmly at warming? Huge reductions in sea ice, poleward migrations of many species, retreating glaciers, rising seas - that sort of thing. None of these things apparently mattered if part of the picture could be shown to be flawed.

But they forgot one thing. Professional climate scientists already knew a great deal about things that can cause outliers in temperature datasets. One example will suffice. When compiling temperature records, NASA's Goddard Institute for Space Studies goes to great pains to remove any possible influence from things like the urban heat island effect. That effect describes the fact that densely built-up parts of cities are likely to be a bit warmer due to all of that human activity.

How they do this is to take the urban temperature trends and compare them to the rural trends of the surrounding countryside. They then adjust the urban trend so it matches the rural trend – thereby removing that urban effect. This is not 'tampering' with data: it's a tried and tested method of removing local outliers from regional trends to get more realistic results.

As this methodology was being developed, some findings were surprising at first glance. Often, excess urban warming was small in amount. Even more surprisingly, a significant number of urban trends were cooler relative to their country surroundings. But that's because weather stations are often sited in relatively cool areas within a city, such as parks.

Finally, there have been independent analyses of global temperature datasets that had very similar results to NASA. 'Berkeley Earth Surface Temperatures' study (BEST) is a well-known example and was carried out at the University of California, starting in 2010. The physicist who initiated that study was formerly a climate change skeptic. Not so much now!

Please use this form to provide feedback about this new "At a glance" section, which was updated on May 27, 2023 to improve its readability. Read a more technical version below or dig deeper via the tabs above!


Further details

Temperature data are essential for predicting the weather and recording climate trends. So organisations like the U.S. National Weather Service, and indeed every national weather service around the world, require temperatures to be measured as accurately as possible. To understand climate change we also need to be sure we can trust historical measurements.

Surface temperature measurements are collected from more than 30,000 stations around the world (Rennie et al. 2014). About 7000 of these have long, consistent monthly records. As technology gets better, stations are updated with newer equipment. When equipment is updated or stations are moved, the new data is compared to the old record to be sure measurements are consistent over time.
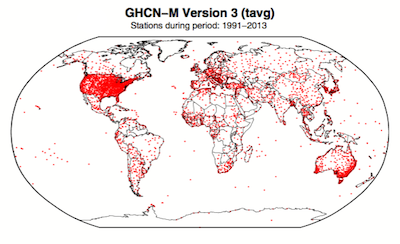
 GHCN-M stations

Figure 1. Station locations with at least 1 month of data in the monthly Global Historical Climatology Network (GHCN-M). This set of 7280 stations are used in the global land surface databank. (Rennie et al. 2014)

In 2009 allegations were made in the blogosphere that weather stations placed in what some thought to be 'poor' locations could make the temperature record unreliable (and therefore, in certain minds, global warming would be shown to be a flawed concept). Scientists at the National Climatic Data Center took those allegations very seriously. They undertook a careful study of the possible problem and published the results in 2010. The paper, "On the reliability of the U.S. surface temperature record" (Menne et al. 2010), had an interesting conclusion. The temperatures from stations that the self-appointed critics claimed were "poorly sited" actually showed slightly cooler maximum daily temperatures compared to the average.

Around the same time, a physicist who was originally hostile to the concept of anthropogenic global warming, Dr. Richard Muller, decided to do his own temperature analysis. This proposal was loudly cheered in certain sections of the blogosphere where it was assumed the work would, wait for it, disprove global warming.

To undertake the work, Muller organized a group called Berkeley Earth to do an independent study (Berkeley Earth Surface Temperature study or BEST) of the temperature record. They specifically wanted  to answer the question, “is the temperature rise on land improperly affected by the four key biases (station quality, homogenization, urban heat island, and station selection)?" The BEST project had the goal of merging all of the world’s temperature data sets into a common data set. It was a huge challenge.

Their eventual conclusions, after much hard analytical toil, were as follows:

1) The accuracy of the land surface temperature record was confirmed;

2) The BEST study used more data than previous studies but came to essentially the same conclusion;

3) The influence of the urban stations on the global record is very small and, if present at all, is biased on the cool side.

Muller commented: “I was not expecting this, but as a scientist, I feel it is my duty to let the evidence change my mind.” On that, certain parts of the blogosphere went into a state of meltdown. The lesson to be learned from such goings on is, “be careful what you wish for”. Presuming that improving temperature records will remove or significantly lower the global warming signal is not the wisest of things to do.

The BEST conclusions about the urban heat effect were nicely explained by our late colleague, Andy Skuce, in a post here at Skeptical Science in 2011. Figure 2 shows BEST plotted against several other major global temperature datasets. There may be some disagreement between individual datasets, especially towards the start of the record in the 19th Century, but the trends are all unequivocally the same.
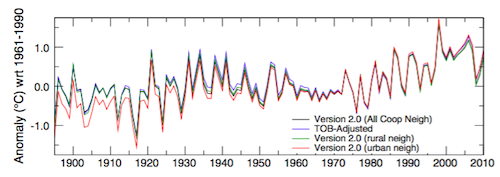
rural-urban T

Figure 2. Comparison of spatially gridded minimum temperatures for U.S. Historical Climatology Network (USHCN) data adjusted for time-of-day (TOB) only, and selected for rural or urban neighborhoods after homogenization to remove biases. (Hausfather et al. 2013)

Finally, temperatures measured on land are only one part of understanding the climate. We track many indicators of climate change to get the big picture. All indicators point to the same conclusion: the global temperature is increasing.


See also

Understanding adjustments to temperature dataZeke Hausfather

Explainer: How data adjustments affect global temperature recordsZeke Hausfather

Time-of-observation Bias, John Hartz

Berkeley Earth Surface Temperature Study: “The effect of urban heating on the global trends is nearly negligible,” Andy Skuce

Check original data

All the Berkeley Earth data and analyses are available online at http://berkeleyearth.org/data/.

Plot your own temperature trends with Kevin's calculator.

Or plot the differences with rural, urban, or selected regions with another calculator by Kevin

NASA GISS Surface Temperature Analysis (GISSTEMP) describes how NASA handles the urban heat effect and links to current data.

NOAA Global Historical Climate Network (GHCN) DailyGHCN-Daily contains records from over 100,000 stations in 180 countries and territories.

Last updated on 27 May 2023 by John Mason. View Archives

Printable Version  |  Offline PDF Version  |  Link to this page

Argument Feedback

Please use this form to let us know about suggested updates to this rebuttal.

Related Arguments

Further reading

Denial101x video

Here is a related lecture-video from Denial101x - Making Sense of Climate Science Denial

Additional video from the MOOC

Kevin Cowtan: Heat in the city

Comments

Prev  1  2  3  Next

Comments 26 to 50 out of 70:

  1. On the subject of stations, I note that the number of stations used for data collection has dropped dramatically from 1990 'til present day. Coverage in (what was) the USSR and China has virtually disappeared. Coincident with the fall in stations the GMTemp has apparently risen.(???any connection here???) Look at a map of the current station locations and then tell me they are providing data that can be seriously used to construct a global model. Yes satellites provide additional cover but only during their overpass which is limited. Yes, their instrumentation is more accurate than land-based stations, but there are too few of them, so their 'correcting' effect on the overall dataset is diluted. The earth has around 510 million sqkm in surface; 150 land and 360 water. The vast majority of stations are land based and with around 4000 in use that works out to a station roughly every 38,000 sqkm. To try and model from that low level of distribution would be rejected by most reasonable people. The fact that most of these stations are actually concentrated in a much smaller area leaving HUGE areas un-monitored simply makes the data collected even more worthless for constructing any realistic model.
  2. Sorry, forgot to post the sites....Look at: http://science.nasa.gov/headlines/y2000/ast21jul_1m.htm http://climate.geog.udel.edu/~climate/html_pages/ghcn_T_stn.html Note the closing comments...... "The improved temperature record will guide efforts to refine computer models of the world's climate so that the behavior of the models more closely resembles the observed behavior of the atmosphere. Current models suffer from several shortcomings. For example, clouds are not well represented by the models. The resolution of current models is too coarse for features as small as clouds, Spencer said. Yet clouds clearly play a crucial role in climate due to their influence on humidity, precipitation and albedo (the percentage of solar energy reflected back into space as light). "The role of clouds is still regarded as one of the biggest uncertainties in global warming predictions," Spencer said. The ability of plants to remove carbon dioxide from the atmosphere and the role of soils have only recently been added to the models, and scientists aren't confident yet of how the models portray these factors, Spencer said. "While we know that vegetation takes up some of the carbon dioxide we generate from burning of fossil fuels, how that sink of carbon will change in the future is still pretty uncertain," Spencer said. Climate models are also limited by the computing power available. "The global models would be much better if computers were much faster," Spencer said. "Instead, a lot of approximations are made to make the models simple enough to do climate simulations over the whole globe. "Unfortunately," Spencer continued, "we know that many of the processes that are crudely represented are quite non-linear, and so have the potential to respond in unexpected ways."
  3. Someone just suggested to me (from a book called 'Heat' I believe) that the earth has taken millions of years to store the potential energy of oil, gas, coal etc... and we're releasing it in a few hundred years so its bound to have an effect. Is this credible? How does this release compare to volcanic activity for instance? Opinions please! And apologies if this is the wrong thread for such a question. Just to tack another thought onto this: as people generally have an overriding opinion on AGW, do you think the multitude of factors and questions such as the one I've asked above are generally explained to support one's own 'overriding opinion'? And further, how many factors and questions would it take for someone educated in this field to 'change' their overriding opinion? I openly admit that I plead ignorance before I plead an opinion! The back and forth on this subject is dizzying.
  4. theTree: Check out Wikipedia: It is (guess)timated that around 14 terawatts of heat is released from the earth's core through tectonic/vulcanic activities, around the same amount of energy that we currently consume. Science is about facts, not opinions. Opinions are shaped by the kind of person you are and you will find a lot of people will deny facts because they do not fit 'their' model of reality. That's why we need science, not opinion, not emotional hype, not fear induced reactions to an un-proven hypothesis. Science enables us to respond rather than react.
  5. theTree Yes it does have an effect, producing a false feedback through CO2 release which is a GHG. The argument on CO2 is climate sensitivity. Hansen claims a high sensitivity while Spencer claims a low one. The results thus far indicate Spencer is scientifically but not politically correct.
  6. Re #30-32 These questions have been addressed fairly conclusively by the science. (i) You are correct (Tree) that the earth took many millions of years to sequester atmospheric CO2 in the form of fossil fuels (oil, gas, coal, shale and so on). Around 4000 billion tons of carbon is "stored" in this manner, and it's taken around 600 million years to do this. In the last 100 years we've released around 500 billion tons of this carbon back into the atmosphere, of which around 200 billion tons has remained there (around 300 billion tons has been absorbed by the oceans and terrestrial environment). see for example: http://www.physicalgeography.net/fundamentals/9r.html (ii) It's very clear that volcanic activity is on a miniscule scale with respect to our massive release of carbon dioxide. It's easy to demosstrate this. If one examines the high resolution atmospheric CO2 record over the last 1000 years, for example, one can see that the atmospheric CO2 levels remain rather constant over the period up to around the mid to late 19th century and rise massively in response to our emissions. The absence of significant activity from volcanoes can be observed by the absense of jumps in the atmospheric CO2 record as a result of the truly hummungous volcanoes of the last 1000 years (e.g. Santorini, Krakatoa and Tambora). Volcanic activity results in the release of something a ggod bit less than 1% of our current industrial emissions. see, for example, the high resolution atmospheric CO2 record compiled on page 3 of the IPCC summary for policymakers: http://www.ipcc.ch/pdf/assessment-report/ar4/wg1/ar4-wg1-spm.pdf (see page 3) (iii) Heat from tectonic activity is trivial with respec to greenhouse gas warming. This is one of those fallacious "arguments" that is doing the rounds! The practicioners avoid the three pertinent points. These are: (i) is there any evidence for enhanced tectonic activity during the period of very large warming (especially last 30-odd years)? After all tectonic activity has been occurring for millions of years. Has it suddenly intensified? Evidence please! (ii) how can it be that the areas of which major tectonic activity show little match to areas of temperature increase? For example Iceland is one of the most tectonically active regions on earth. However it is one of the few places on earth that has undergone a tiny bit of COOLING during the period of global warming: e.g. data on the scale and location of Arctic warming over the last 50 years from the Colorado University Arctic research center: http://arctic.atmos.uiuc.edu/CLIMATESUMMARY/2003/IMAGES/annual.1954-2003.tchange.png (iii) the heat released by undersea tectonic activity is around that of the geothermal background. This is around 0.1% of the heat energy from solar/greenhouse activity. e.g. according to Jeff Severinghaus of the Scripps Institution of Oceanography "... the average heat added from volcanoes to the ocean is of order 0.1 Watt per square meter. But the heat added (or removed) to the ocean from the sun and atmosphere is of order 100 Watt per square meter. So it is very hard for volcanoes to compete." So it's not just a question of showing that tectonic activity on the ocean bottom is significant with respect to warming (the evidence indicates it isn't), but of showing that this activity has increased in the last several decades to an extent that can have contributed to warming (the evidence indicates that it hasn't)...
  7. Chris: "If one examines the high resolution atmospheric CO2 record over the last 1000 years,"...... What highres records are we talking about please? Paleoproxies?
  8. Re #34 No, not paleoproxies. That's clear from the data I linked to: http://www.ipcc.ch/pdf/assessment-report/ar4/wg1/ar4-wg1-spm.pdf (see page 3) The atmospheric CO2 record is the directly measured atmospheric CO2 either in the atmosphere (from the many sites around the world and the continuous record from Manua Loa since 1959), and trapped in bubbles in ice cores extending back many 100's of thousands of years, but at a high resolution extending back 1000 years: e.g. D. M. Etheridge et al (1996) "Natural and anthropogenic changes in atmospheric CO2 over the last 1000 years from air in Antarctic ice and firn" J. Geophys Res. 101, 4115 -4128. and later extended to 2000 years: CM Meure et al (2006) "Law Dome CO2, CH4 and N2O ice core records extended to 2000 years BP" Geophys Res. Lett. 33 Art. # L14810
  9. Thanks Chris; somehow I missed the link. This thread is about temperature records and how reliable /accurate/representative are they. CO2 levels are assumed to vary only slightly due to effective atmospheric mixing, but this is very different from temperature which has much greater variation. Given the paucity of temperature recording stations I cannot accept that the data used for models is sufficiently representative of the global condition, and thus the resultant of the model is questionable. Even satellite records are questionable as recently demonstrated by the modification needed to the attitude correction algorithm.
  10. Re #36 that's good...you agree that the atmospheric CO2 levels vary only slightly due to effective atmospheric mixing. You say that this is "assumed", but of course, as we both know [http://www.skepticalscience.com/co2-measurements-uncertainty.htm], this isn't an "assumption" at all..it's a real world observation [so long as we are careful to make CO2 measures in isolated locations and average over the relevant timescales for mixing (yearly averages are appropriate)]. There's still a few problems with your post: (i) Temperature data isn't "used" for models of course. And so the "resultant" of the models isn't in any way "questionable" in relation to the temperature data which is an entirely independent data set. Model output (as predictions or hindcasts) might well be compared with the real world temperature....but that's another matter altogether. (ii) Notice that one doesn't need a huge number of "temperature recording stations" to assess changes in global temperature. Remember that the aim is not to determine the Earth's "average temperature" or "global temperature". These are terms with little meaning (after all the Earth's average sea level surface temperature will differ from the Earth's average 200 metres altitude temperature and so on). The Earth's temporal temperature evolution is determined as a change in the "temperature anomaly", which is the change in temperature in single locations averaged over a very large number of locations. Thus temperature stations at a whole range of locations and altitudes provide valid data sets. On similar lines, the fact that there is a strong correlation between temperature anomalies over large distances (100's of kilometres) means that the whole Earth doesn't need to be minutely sampled. Obviously we couldn't assess absolute global temperatures in this manner. But we're not assessing absolute global temperatures. We're assessing the change is absolute temperature at single locations and averaging these changes. So one needs to be clear about what the surface temperature anomaly means and how this is determined before attempting to trash it! [you might read the relevant descriptive papers here [*****]. Notice that in relation to the subject of this thread, the Earth's temperature anomaly progression under the influence of a marked 20th (and especially late-20th) century warming is essentially unchanged if the entire set of urban stations is omitted from the analysis. [e.g. Hansen et al (cited below) state in an analysis of urban heat effects that: “These examples illustrate that urban effects on temperature in specific cases can dominate over real climate trends. Fortunately, there are far more rural stations than urban stations, so it is not essential to employ the urban data in analysis of global temperature change.”] So the "urban heat island effect" is somewhat of a red herring (or a stalking horse) in the context of global temperature anomaly measures. [*****] Hansen et al (1999) GISS analysis of surface temperature changes J. Geophysical Res (Atmos) 104, 30997-31022 or (for the Hadley analyses): Rayner NA et al (2003) Global analyses of sea surface temperature, sea ice, and night marine air temperature since the late nineteenth century J. Geophys. Res. (Atmos) 108 (D14): Art. No. 4407 JUL 17 2003 etc. etc. (iii) Of course the proof is in the pudding. We've observed a large warming, especially of the high Northern latitudes (as predicted by models) with large attenuation of Arctic sea ice....we've observed large scale retreat of mountain glaciers....we've observed increased concentrations of atmospheric water vapor in response to atmospheric warming much as predicted ......we've observed widespread increases in the sea surface temperature...and so on. In fact it's possible to leave out direct surface temperature measures and construct a completely independent temperature scale by analysis of the record of mountain glacier retreat: e.g. J. Oerlemans (2005) "Extracting a climate signal from 169 glacier records" Science 308, 675-677. And as John Cook outlined in his top post, there are many other indicators of rising surface temperatures that are independent of direct temperature measures.
  11. Chris said, Notice that one doesn't need a huge number of "temperature recording stations" to assess changes in global temperature. Now I am glad she mentions this, there are enough rural sites certainly in the US that will give complete coverage, these rural sites show NO significant warming since 1900. Because of this problem (no warming) Hanson/Giss use over 1100 US weather stations many urban so they can then manipulate the raw data to push their cause. http://www.youtube.com/watch?v=LcsvaCPYgcI http://www.climateaudit.org/?p=1859 http://www.climateaudit.org/wp-content/uploads/2007/08/peters27.gif Chris says, So one needs to be clear about what the surface temperature anomaly means and how this is determined before attempting to trash it! [you might read the relevant descriptive papers here [*****]. Notice that in relation to the subject of this thread, the Earth's temperature anomaly progression under the influence of a marked 20th (and especially late-20th) century warming is essentially UNCHANGED if the ENTIRE SET OF URBAN STATIONS IS OMITTED from the analysis. Fortunately, there are FAR MORE RURAL stations than urban stations, so it is NOT ESSENTIAL to employ the urban data in analysis of global temperature change.”] So the "urban heat island effect" is somewhat of a red herring (or a stalking horse) in the context of global temperature anomaly measures. I SAY PERHAPS CHRIS SHOULD TELL HANSON THAT. PERHAPS CHRIS CAN INFORM US WHY HANSON USES STATION PAIRS INSTEAD OF USING THE PRISTINE RURAL STATION DATA ALONE THAT IS READILY AVAILABLE OVER THE ENTIRE GLOBE. Station pairs disguise the actual temperature, by suggesting in flawed studies that there is little UHI effect, try London 9 degree C difference and every other major cities and towns on the planet. Google population growth and the UHI effect, 9 degrees C is NOT high.
  12. ummmmm Rob.. Since I am quoting Hanson directly from one of his papers, I don't really need to tell him anything. Urban areas are generally warmer than the surrounds. Therefore one either eliminates urban areas from the record to establish the Earth's surface temperature evolution, or one corrects the data from urban stations by reference to local urban stations. However one does this (leaves out the urban stations or corrects these) the Earth's surface temperature anomaly is the pretty much the same. You would benefit from reading John Cook's article on urban heat island effect.
  13. I'm amazed at the rhetoric. If you lose the validity of the surface temperature record, your hypothesis, that warming is greater than expected, is invalidated. It is a logical fallacy to claim that it doesn't matter if one of your premises are proven false. It is impossible for the conclusion to be correct if the premises do not hold. Here in lies the crux of the problem. --------------------------------------------------------- So If I'm not mistaken this is the AGW Hypothesis: 1. The world has been warming for a century, and this warming is beyond any cyclical variation we have seen over the last 1000 or more years, and beyond the range of what we might expect from natural climate variations. 2. Almost all of the warming in the second half of the 20th century, perhaps a half a degree Celsius, is due to man-made greenhouse gases, particularly CO2 3. In the next 100 years, CO2 produced by man will cause a lot more warming, from as low as three degrees C to as high as 8 or 10 degrees C. 4. Positive feedbacks in the climate, like increased humidity, will act to triple the warming from CO2, leading to these higher forecasts and perhaps even a tipping point into climactic disaster 5. The bad effects of warming greatly outweigh the positive effects, and we are already seeing the front end of these bad effects today (polar bears dying, glaciers melting, etc) 6. These bad effects, or even a small risk of them, easily justify massive intervention today in reducing economic activity and greenhouse gas production [1] http://www.conservapedia.com/AGW_hypothesis --------------------------------------------------------- In order for this to be proven true at this point in time, the surface temperature record needs to be accurate, because the other forms of temperature data collection have not been around long enough to be relied on. We simply do not have upper atmospheric temperature measures for long enough to see any long term trends. Let alone trends that are not expected. This is also true of the surface temperature record, although it is slightly older. Let's put it into perspective, if we scaled earth's total existence in time to a period of 1 year, the 50-100 years of data collection we now have would still be a fraction of a second on that time scale. So... claiming that you "Don't need" the temperature record is simply an act of hand waving by those too stubborn to admit defeat. At least for now, there is more work to be done.
  14. Yes, don't allow yourself to be taken in by "rhetoric" beam! In science it’s all about the evidence. I'm sure nobody would suggest that it doesn't matter if we "lose the validity of the surface temperature record". I've had a look through the thread and haven't found any post which claims that, let alone "claiming that you "Don't need" the temperature record"...that would be an odd claim indeed! Notice that in order to take action in response to real world observations we don't need "proof". Proof is a mathematical/philosophical concept. What we need is strong evidence. So the pertinent question is: "is there strong evidence that the temperature record is robust to the extent that we can reliably assess the Earth's temperature response in relation to our understanding/predictions of massive enhancement of greenhouse gas concentrations". The answer is yes I suspect we would agree for some of the reasons already outlined on this thread: (i) The record is independently assessed by three different organizations. Although there are differences in data compilation/analysis methods and some differences that relate to the nature of covering sparsely-monitored regions, the different compilations yield a consistent interpretation of the surface temperature evolution over the last 100 and a bit years. (ii) the surface record seems not to have significant contamination from the UHI since (a) a number of direct analyses indicate that the UHI isn’t significant [comparison of temperatures on windy days (with rapid excess heat dispersal) cf calm days, and other types of analysis, for example as described here: http://www.skepticalscience.com/Does-Urban-Heat-Island-effect-add-to-the-global-warming-trend.html, or in John Cooks introductory summary on this thread]; (b) one can remove all of the urban records from the analysis, and the temperature profile is pretty much unaffected; (c) those regions showing the largest warming are far, far away from urban centres and generally there is no correlation between local temperature evolution and local urban density [see for example: http://www.skepticalscience.com/urban-heat-island-effect.htm] (iii) completely independent records of the consequences of a warming Earth are consistent with the surface record [these include high latitude ice recession; independent temperature scales constructed from the record of high altitude glacier recession; tropospheric warming; enhanced tropospheric absolute humidity and so on]. So the evidence supports the interpretation that the temperature record is robust. Your point about scaling of the record with respect to the Earth’s “total existence” isn’t an important comparison with respect to the question of the consequences of massive enhancement of the atmospheric greenhouse gas concentrations at this particular time in the Earth’s long history. In any case we have a huge amount of information about temperatures in the recent and much more distant geological past. This also informs our understanding and provides strong evidence in support of the expected surface warming response to enhanced greenhouse gas concentrations. For example there is a good correlation between atmospheric CO2 concentrations and the Earth’s “temperature” in proxyCO2 and proxytemperature data stretching back right through the Phanerozoic So in general, the paleorecord reinforces the data from our contemporary temperature record and all of the vast amount of information from understanding of basic atmospheric physics, to the spectroscopy of greenhouse gases, ice core records and so on and on, that informs us on the consequences of massive enhancement of greenhouse gas concentrations. That’s not to say that there isn’t much more work to be done!
  15. Chris: we cannot adequately model climate right now, let alone model climate 'that was' millions of years ago. We assume land mass distribution, oceanic currents, atmospheric conditions and movement, biomass activity etc and then use proxy records to pin down climatic conditions. The best we can actually expect is an intelligent estimate of trends.
  16. We're not talking about modeling Mizimi. We're talking about measuring.
  17. Your quite right Chris; apologies.
  18. I need clarification on what is meant be "average" in the context of temperature station readings. What are we interested in here daily averages, monthly averages, hourly averages etc. Ie is "average" simply some arbitrarily collected(high+low)/2 or are we talking about some fully intergrated average. Just what is the standard? Another question is what does science say about the type of average that is used to calculate the presnet state of the earth's "fever" (referring to your spokesman Al Gore's expression for it.) Do we do RMS averages, a simple arithemetic mean, or is a modal or median average most appropriate in determing the state of the this "fever"? Maybe can we mix them all up and wave some abra-cadabra (correcting the data) over it and voila - the current state of the earths fever is determined to 5 decimal points. How does science deal with migrating weather stations? If I decide to place 500 weather stations in Arizona next year and call them "official" will the USA develop a strong "global warming" signal or just Arizona? or doesn't it matter at all? Conversely if I fund 10,000 weather stations in Siberia can I cool the planet's present fever?
  19. #45 Unfortunately most of the weather stations in Siberia have been shut down and if you look up the current distribution of weather stations globally they are distributed very unevenly...the highest density being in the USA. Many other parts of the world are not 'thermally' represented so any global mathematical average (however it is derived) is going to be wrong. Satellite measurement has been around now for only 30 years so whilst we have a more even distribution of data (not necessarily more accurate) the data series is too short for any predictive climate modelling. Interestingly, the current series of satellite temperature data shows a clear cooling trend since 2002 despite increasing CO2 levels.
  20. That is a nice article!That's because they are troposphere numbers. They should be like that. The trends are in agreement.Well, it is not new to me. But aside from that breaking news, are you familiar with Victoria Gotti? Victoria Gotti is in trouble. She isn't getting arrested or anything, but the mortgage on the castle Victoria Gotti lives in is about to get foreclosed on – putting the Mafia princess out of her home. Daughter to criminal royalty, John Gotti, the onetime head of the Gambino crime family, she married a mobster herself (surprise!) and they were able to purchase a lavish home close to Long Island. She is $650,000 behind, so she isn't likely to be able to keep it, and that is definitely out of the reach of quick payday loans. However, with a mortgage that size there will probably be no mortgage loan modification in the future for Victoria Gotti
  21. Greeting all, When some outfit like Hadley or GISS offers an estimate of the global mean temp for a given year, do they present along with it an error estimate? e.g. In 2008 the average temp was 25 degrees C + or - 5 degrees. Seems like they would have to, given all that goes into coming up with an estimate. How do they assess the range of error, and how much confidence can we place on such estimates? cordially Frank
  22. Wondering Aloud, would Energy & Environment be the same "journal" that published that awful "paper" by Beck-the one claiming that, based on measurements of the day, CO2 levels in the 19th century were higher than in the 20th century? When you look at the results used by Beck, you see they have *massive* margins of error (around +/-200ppm) because most of the samplings were taken in urban environments, were measured without internal controls &/or were measured with equipment with sensitivities 10-100 times worse than modern equipment. Yet E&E still accepted this paper, even when no other respectable journal would touch it, because it fit into their ideological agenda. I suspect the same is true with their "analysis" of monitoring stations.
  23. WA. 1951-1980 was not the *coldest stretch in a century*. The 30-year average of 1901-1930 was a good .24 degrees *colder* than 1951-1980-& is by far the coldest 30 years of the the 20th century. 1931-1960 average is almost identical to 1951-1980, & the 1961-1990 average is slightly warmer than either 1931-1960 or 1951-1980, so I don't see why you think GISS is in error for using this period as a base-line. The satellite data is from 1979-2000 because 1979 represents the start of the satellite measurement period.
  24. Mizimi, I have to tell you that your claims regarding the Siberian stations is just plain wrong. If you can provide *proof* of this wild allegation, I'd be happy to entertain it though. As for your claim regarding the satellite data post-2002. Even if what you said was true, 2003-2009 represents too small a sample group to be of any real benefit for determining trends-especially when that period is dominated by abnormally low sunspot numbers. That said, if we look at temperatures from AMSU-A for 1st July, we see that 2003 was -14.42, 2004 was -14.19, 2005 was -14.13, 2006 was -13.94, 2007 was -13.86, 2008 was -14.39 then 2009 was -14.11. This is only a single date, of course, but a look through the entire year shows that, if anything, the trend has been towards *warming* between 2003-2009, not cooling as you claim. As I said, though, picking on these dates-to prove either case-is the worst kind of cherry picking.
  25. What galls me is this-in spite of the fact that Dr Roy Spencer (of University of Alabama, Huntsville) has been shown that his adjustment for diurnal variations is in error, as far back as 2005, he still persists in using this method, which generates a long-term trend of +0.035 per decade lower than what is should be. If this error is accounted for, the long-term trend for UAH satellite data is around +0.2 degrees per decade (the same order of magnitude as RSS, which was around +0.23 degrees per decade). What's interesting is that *both* of the satellite data-sets give values which are *higher than for surface-based measurements (+0.187 degrees per decade). Another point is this, why do skeptics refuse to pillory Dr Spencer (a skeptic) for his errors, yet are quick to attack any apparent errors made by climatologists with CRU or GISS? That smacks of hypocrisy to me!

Prev  1  2  3  Next

Post a Comment

Political, off-topic or ad hominem comments will be deleted. Comments Policy...

You need to be logged in to post a comment. Login via the left margin or if you're new, register here.

Link to this page


The Consensus Project Website

THE ESCALATOR

(free to republish)


© Copyright 2024 John Cook
Home | Translations | About Us | Privacy | Contact Us