Climate Science Glossary

Term Lookup

Enter a term in the search box to find its definition.

Settings

Use the controls in the far right panel to increase or decrease the number of terms automatically displayed (or to completely turn that feature off).

Term Lookup

Settings


All IPCC definitions taken from Climate Change 2007: The Physical Science Basis. Working Group I Contribution to the Fourth Assessment Report of the Intergovernmental Panel on Climate Change, Annex I, Glossary, pp. 941-954. Cambridge University Press.

Home Arguments Software Resources Comments The Consensus Project Translations About Support

Bluesky Facebook LinkedIn Mastodon MeWe

Twitter YouTube RSS Posts RSS Comments Email Subscribe


Climate's changed before
It's the sun
It's not bad
There is no consensus
It's cooling
Models are unreliable
Temp record is unreliable
Animals and plants can adapt
It hasn't warmed since 1998
Antarctica is gaining ice
View All Arguments...


Username
Password
New? Register here
Forgot your password?

Latest Posts

Archives

What evidence is there for the hockey stick?

What the science says...

Select a level... Basic Intermediate

Recent studies agree that recent global temperatures are unprecedented in the last 1000 years.

Climate Myth...

Hockey stick is broken

“In 2003 Professor McKitrick teamed with a Canadian engineer, Steve McIntyre, in attempting to replicate the chart and finally debunked it as statistical nonsense.  They revealed how the chart was derived from "collation errors, unjustified truncation or extrapolation of source data, obsolete data, incorrect principal component calculations, geographical mislocations and other serious defects" -- substantially affecting the temperature index.” (John McLaughlin)

At a glance

The Hockey Stick is a historic graph dating back to a paper published in 1999. It showed Northern Hemisphere temperature variations over the near-thousand year period from 1000-1998. The 'blade' of the stick represented the rapid warming of the late 20th Century. It has an iconic status, both in climate science and in the murky world of science-misinformation, where, naturally, it is despised by all and sundry.

Objections to the Hockey Stick are varied but mostly focussed on the stick's long handle and the data that represents. Obviously, during the centuries going back to 1000, reliable temperature measurements are not available. Fortunately for science, there are things that lived through that long time, such as certain very old trees. They record in the rings of their wood an indication of temperatures, year on year. Gardeners and farmers talk about good and bad growing years and it’s the same for natural systems. For example, cold dry periods make for narrow and densely-packed tree-rings whereas warmer, wetter times lead to more widely-spaced ones.

Importantly, today there are a great many effective past climate indicators, known as proxies because they act in place of thermometers. Because there's a range of indicators, the results from each one can be cross-checked against one another. If a new proxy is any good, its data should agree with that from the other, established ones.

Proxy datasets contain more uncertainty than directly measured temperatures. Everyone knows that. That does not mean they are useless, far from it. Cross-checking means poor data can readily be identified and investigated.

Finally, it's 24 years since the Hockey Stick graph was published. Since then, work on developing and refining the best proxies has been relentless. Better, longer temperature reconstructions have become possible. At the same time, global temperatures have continued to rise. In any of the observation-based records of surface temperature, all of the eight warmest years have been since 2015.

Please use this form to provide feedback about this new "At a glance" section, which was updated on May 27, 2023 to improve its readability. Read a more technical version below or dig deeper via the tabs above!


Further details

Reliable observational temperature records only go back so far in time – in the UK back to 1850 and in the USA to 1880, for example. So how do we find out about conditions going further back, hundreds, thousands or even millions of years into the past? We use proxies.

Proxies are things whose measurable properties are affected in certain, well-defined and understood ways by variations in temperature and other climatic parameters. Although the most well-known proxy work was undertaken by studying the rings of ancient trees, many other things have since shown usefulness in this field. They include data from ice-cores, marine and lake sediments and the fossils they contain, corals, mountain glaciers: as time goes by more and more things have shown themselves to be useful over a variety of time-spans. Armed with such tools, the paleoclimatologist can thereby reconstruct climatic conditions in ancient times, just as the paleontologist can reconstruct ancient ecosystems, from data preserved in the rocks.

By 1999, confidence in paleoclimate proxy data was sufficient to link these ancient records to modern observations and this was done in a famous paper by Michael Mann and colleagues (Mann et al. 1999), showing that global temperature gradually cooled over the last 1000 years, but then rose sharply, beginning in the 20th Century. The shape of the graph (Figure 1) therefore looked like a hockey stick lying flat on the ground with its blade pointing upwards.
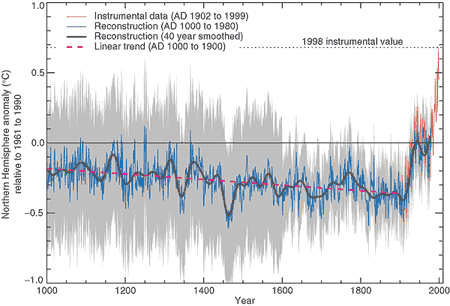

Figure 1: Northern Hemisphere temperature changes estimated from various proxy records shown in blue (Mann et al. 1999). Instrumental data shown in red. Note the large uncertainty (grey area) as you go further back in time.

Controversy, mostly of a manufactured nature, raged over the hockey-stick graph in the years following its publication: it became a symbolic focal point in the online 'climate-wars' that characterised the first two decades of the 21st Century, a time of often bitter battles and recriminations as misinformers attacked climate scientists in any way they could think of.

In the meantime, the expansion of things that were found to work as effective proxies continued apace, so that by the late 2010s we had learned a lot more about paleoclimate going right back through the glaciations and interglacials of the Quaternary and into the warmer late Cenozoic era. The paleoclimate record today stretches a long way back, through tens of millions of years.

Back to shorter time-spans though, and another visually-catching graphic was recently created by climate scientist Ed Hawkins, using blues for colder years, reds for warmer ones and whites for near-average times. Known as “Warming Stripes'', the initial 2018 graph represented temperatures over the past 200 years, but a more recent version (Figure 2) uses a wide range of reliable proxy data from an international collaboration of scientists, called Past Global Changes 2K (PAGES2K), because it covers the past 2,000 years.
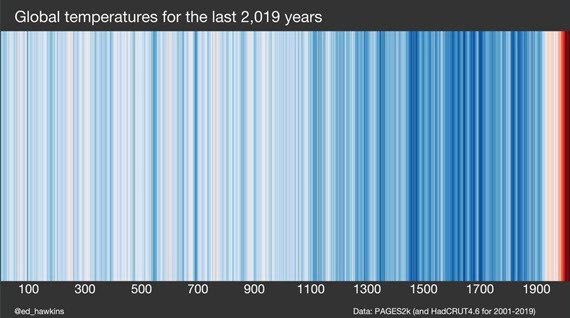
Warming Stripes past 2000 years

Figure 2: Warming Stripes based on PAGES2k (and HadCRUT4.6 for 2001-2019). Source: Ed Hawkins' Climate Lab Book

Warming Stripes is a visually striking graphic due in large part to its simplicity. It's like the Hockey Stick but with 20 years more scientific progress included. But like the Hockey Stick, it confirms the original findings: that the rate of recent warming is very steep in contrast to anything in the past two millennia.

Of course, as one would entirely expect, some crude attempts have been made to doctor Warming Stripes, but they never stand up to the level of scrutiny that scientists apply to their datasets. A graphic circulated in 2019 is one such example. For some unknown reason, its author left off the period 2007-2019, despite the temperature data being readily available. Could it have been because the warmest years on record occurred during this period? You tell us.

Furthermore, an in-depth examination of the graphic in question in a CBS News article shows that in fact it had been put together by crude copying and pasting in Photoshop or a similar application, so badly in fact that the edges of the pasted sections are clearly visible standing out from the top of the graphic. Like all climate misinformation, it just doesn't stand up to scrutiny.

Last updated on 27 May 2023 by John Mason. View Archives

Printable Version  |  Offline PDF Version  |  Link to this page

Argument Feedback

Please use this form to let us know about suggested updates to this rebuttal.

Further reading

The National Academy of Science's summation of the various temperature proxies are available online at Surface Temperature Reconstructions for the Last 2,000 Years.

Tamino has an interesting blog post Not Alike where he compares the Moberg temperature reconstruction (one of the least hockey stick like reconstructions with a distinct Medieval Warm Period and Little Ice Age) to modern temperature trends. He finds modern temperatures are 0.53 deg.C hotter than medieval times and the modern warming rate is 64% greater than the fastest rate in medieval times.

The NOAA Paleoclimatology Reconstructions Network has made available paleo data for download including 92 high-resolution temperature records over the past 2+ millennia.

Denial101x video

Here is a related lecture-video from Denial101x - Making Sense of Climate Science Denial

Additional video from the MOOC

Interviews with  various experts

Comments

Prev  1  2  3  4  Next

Comments 26 to 50 out of 79:

  1. Regarding the supposed debunking of the hockey stick by McShane and Wyner, "A new Hockey Stick: McShane and Wyner August 16, 2010, by Tim Lambert http://scienceblogs.com/deltoid/2010/08/a_new_hockey_stick_mcshane_and.php
  2. McShane and Wyner is apparently yet another smoking "gub," looks like. Nailed by their lack of expertise? The tasty nugget at the center of the paper, for skeptics: In other words, our model performs better when using highly autocorrelated noise rather than proxies to predict temperature. The real proxies are less predictive than our "fake" data. It appears M&W compared the performance of proxies sensitive to regional changes against the global NH temperature record. Naturally, the thermometer on your porch (for instance) will turn out to be a poor proxy for global NH temperature if you're trying to tease out changes on the order of a couple of degrees. Even I should have been able to see that. Rats. Noted in various places.
  3. Re: Comparing proxies against global NH (i.e. EIV) versus regional temperature records (i.e. CPS). The two methodologies are compared in Mann 08 http://www.pnas.org/content/early/2008/09/02/0805721105.full.pdf and are also compared in the new paper (see sections 3.2 and 3.6 in Doug's link in post 26)
  4. And that makes this time period......the 26th warmest period in the Holocene era. Big deal.
    Response: See the Argument "It's Not Bad," also titled "Positives and Negatives of Global Warming."
  5. Deep Climate has done a detailed analysis of the McShane and Wyner paper.
  6. McShane and Wyner's paper was tossed into the ring of public contention prior to being graced with the full benefit of review. Presumably this was voluntary on the authors' part, or let's hope so. DeepClimate has a lengthy post delving into various features of M&W, and as well there's a robust discussion in the comments there for folks who'd like to get caught up one way or another. DC is not the only outfit to notice the strangely situated political freight loaded onto the M&W train of thought.
  7. Regarding McShane and Wyner: Is being reviewed. We will wait with baited breath. I guess I missed the "political freight" when I read it today. DC seemed to be going for the ad hominem argument in that regard. I would have preferred that DC skip over the jibes at political incorrectness and spent that time delving into the paper itself. There was a lot going on in those 45 pages. McShane and Wyner take their own shot at the climatological world for being statistically challenged as well. Data is data after all and that is the world of statisticians. One of the conclusions: ...we conclude unequivocally that the evidence for a ”long-handled” hockey stick (where the shaft of the hockey stick extends to the year 1000 AD) is lacking in the data. In other words, there might have been other sharp run-ups in temperature, but the proxies show them. The hockey stick handle may be crooked, but the proxies can't show it one way or the other. Note that McShane and Wyner don't necessarily think the historical record is all wrong, but rather that the anomaly signal that the global warming crowd is using is not necessarily detectable the data.
  8. TOP if M&W choose to include a narrative of the political history of paleoclimate studies in what is advertised as a technical critique and improvement of statistics employed in proxy temperature reconstructions, it's not an ad hominem attack when readers are arrested by this unusual feature and begin to speculate on why the extra material is included. The authors themselves after all have chosen to include this distraction; presumably they wished to call attention to their paper in this way. They've succeeded. To wit, this example paragraph, which you apparently did not notice when reading the paper: Quotations like the above and graphs like those in Figures 1, 2, and 3 are featured prominently not only in official documents like the IPCC report but also in widely viewed television programs (BBC, September 14, 2008), in film (Gore, 2006), and in museum expositions (Rothstein, October 17, 2008), alarming both the populace and policy makers. Al Gore? Alarming? Really? Can you spot the statistics in that? I can't, but I do read what many would term as "dog whistle" political words. Now do you notice how the choice to include political fluff makes it more difficult to discuss their work? Why do I have to ask, because I made M&W mention Al Gore, or because M&W chose to write about Al Gore instead of statistics?
  9. TOP - where is the ad hominem in DC's article? Ie the attempt to discredit the argument by an attack on the persons of M&W, rather than on the argument that they present? DC helpfully makes it possible to check M&W version of history is correct or not, but the teeth of article deals with the technical argument.
  10. It is easy to see why M & W was not submitted to a climate journal. First question they'd be asked is why they used local proxies to correlate to global temperatures and then criticized those same proxies for not being predictive of global temperatures. If they had any sense they would of compared them to the LOCAL temperatures that the proxies actually respond to...
  11. Moderator: The link to Tamino's post "Not Alike" in the Further Reading section is broken. The actual link to where it can be accessed is: http://web.archive.org/web/20080220174450/http://tamino.wordpress.com/2007/10/19/not-alike/ Courtesy of the Internet Archive Wayback Machine". Tamino's posts older than March of 2010 are gone, and pre-existing links to them are probably broken. Posts older than August 22 of 2008 can be found at the archive search link provided. Anyone have any ideas for missing posts between those dates? The Yooper
  12. As far as I know Tamino has written a book, and that may be a reason why he deleted the older post.
  13. Re: Bodo (38) AFAIK, the missing posts are a result of a dispute between Wordpress and Tamino over content. At one point, one of the two parties pulled all past content. All posts prior to March or so of this year are gone from Tamino's Wordpress blog. Some of the missing content is still accessible, as I note. The Yooper
  14. GC - you claim Tamino supports papers that deny the historical record. I assume this has something to do with MBH? Can you be more specific please? I assume you think MBH denies history. Do you also assume that all those other papers in Paleoclimate chapter of AR4 using different methods and proxies, published since M&M are also "denying the historical record"?
  15. scaddenp, (From "Lies, Damn Lies & the IPCC) My problem with MBH 08 & 09 plus the hundreds of subsequent papers and commentaries including those by my ex-colleagues such as Gabby Hegerl or distinguished statisticians such as Tamino is their ignorance of the historical record. The first test of any paleo-climate reconstruction should be whether it portrays past climate in a plausible way. Any set of proxies that disagrees with history should immediately be discarded. Specifically, I mean that at least the following warm periods should be seen: Minoan, Roman (2), Medieval and Modern. Cold periods should include: Dark Ages and Little Ice Age. For proxies that go back into pre-history, one would expect to see the Younger Dryas. While we don't have a true historic record of this there is a good archaeological record of the Clovis people. You should be honest enough to recognize that MBH et seq. fail this test in dismal fashion, yet there are some proxies that portray the historical and even pre-historical (Younger Dryas) temperatures quite well. You don't have to believe they are correct but at least admit that they pass the initial acid test of being consistent with history and archeology. The proxies I find credible are ice cores. As the historical record in the southern hemisphere is thin, one can only check a tiny part of the Antarctic ice core record against history. It is quite a different story in the northern hemisphere where we have the Greenland ice cores. Here is a "ftp" link to Richard Alley's (2000) ice core data for central Greenland: I downloaded this file and prepared a number of plots over different time periods. This is quite time consuming so you can get the same information from the following site and learn about the Eisenhower administration at the same time: http://www.foresight.org/nanodot/?p=3553 Your comments will be appreciated as I plan to visit NOAA in Asheville, North Carolina in mid October to discuss this and related issues.
    Response: [RH] Embedded link.
  16. Quite why *should* an hemispheric or a global temperature record detail all known regional or local climate variations? Ignorance of the historical record is a significant accusation, I wonder if you can back that up with any more than the suggestion that global temperature series should record local fluctuations? Historical observations of Medieval or Roman (clue in the name) warmth come from small portions of the world (dominantly Europe). If most of the rest of the world showed little temperature change or a change of opposite sign, then the impact of even large local changes recorded in the historical record will be outweighed by the record (not stored in written history, but faithfully recorded by proxies) from the rest of the world. Or are you assuming, incorrectly, that all climate fluctuations must always occur worldwide and be globally synchronous?
  17. Not to mention Mann et al. (2008) do use ice cores. If ice cores perform so much better (different) than other proxies, I would assume they would mention it. Also, link dump! Gavin's response to MW2010. Martin Tingley's response to MW2010. McIntyre's response to Mann2008. Reply to McIntyre by Mann
  18. GC - your initial accusation is that MBH and later reconstructions supported by Tamino etc do not honour the historical record so for starters that should limit you to the considerations of the last 1000 years, NH only, as earlier climate events are outside the scope of the papers supposed ignorance of history. Fig 6.10 in AR4 WG1 has summary figure of the various reconstruction, and Box 6.4, Fig 1 shows the individual temperature proxies for different parts of NH. And what do these show? Well for starters, where is the mismatch with history? The proxy records for sites in the area of historical records match what you can infer about temperatures in the pre-thermometer age. That things like the "medieval warm period" occurred at different times in different places is established from the historical records for Greenland, Europe, Russia and China. The NH reconstruction do indeed show a LIA which may be global (you would expect it to be from what we know of forcing at the time). I find no evidence of a problem here though I do certainly accept that MBH, being the first attempt at a multi-proxy reconstruction, needed improved methodologically and has been. I dont think its substantial conclusions has changed much with later reconstructions. Perhaps you could also point out which defense of a paper by Tamino you find so objectionable. Looking back further for evidence that climate science and history are in opposition also produces a blank. Was it warm in the Bronze age? Almost certainly warmer than now is what the climate science says (see WGA 6.5.1.3 for papers). Solar production proxies globally and orbital forcing for NH point to an expectation of warmer temperatures which is borne out in historical and paleoclimatic record. There is evidence of warming similar to now in SH as well. Just as well we dont have that solar forcing now on top of our CO2 concentrations. Younger Dryas - I am not sure why you brought this up as for life of me I can see why you think there is a conflict with "historical record" - perhaps you could explain? I cant see that archeological record is much easier to interpret than the paleoclimate one and boy does it have fun with YD. Be aware that YD is area where techniques are being refined, better time calibration is coming and so watch for new papers in next couple of years. Also note that events like YD are features of glacial terminations and thankfully we lack evidence that interglacial periods are prone to such rapid climate shifts. Time for a quick reset of the respect-o-meter perhaps in face of all that data?
  19. scaddenp (#44), Starting at the end, the Younger Dryas is relevant because it is another example of Alley's ice cores being in synch with history/archeology. You are selling history short if you think it only goes back 1,000 years. There is no merit in multi-proxy studies if most of the proxies are junk science. Mann's tree rings should have been thrown out the minute they failed to model the warm and cold periods over the last 1,000 years.
  20. apeescape (#43), What is this "link dump" thing? Scaddenp asked for data so I sent a NOAA ftp link. Then I try to help by sending a reference that has pre-digested the data into a series of charts. I will read your links; perhaps you will be kind enough to read mine unless you are afraid of being confused by facts.
  21. skywatcher (#42), You are right to be wary about applying measurements from a small area to the entire globe, so get your blinkers off and acknowledge that is exactly what Mann tried to do. He took measurements on spruce trees from a few sites all in high latitudes and tried to draw conclusions relating to the entire planet. Take a look at the Yamal peninsula studies that came down to a few carefully selected trees. I won't send you the links as that might offend "apeescape".
  22. GC - This thread started elsewhere with the claim you didnt like Tamino because he supported papers that were in conflict with the historical record. The papers you objected to only cover the last 1000 years. I am not selling history short (as rest of comment indicates), only that objections to those particular papers are for events of last 1000 years. If you have other papers that you think imply conflict with the historical record, then name them. Your comments so far ignore my objection to this. Further you claim that Mann inferred global climate from only Yamal tree rings. Also not true - the paper used a variety of proxies from many location; that was what was new. The first multi-proxy reconstruction. I am not clear whether you are agreeing that climate science view of YD in concordance with history (no problem then) or not.
  23. I am also still interested what paper you think Tamino mounted an inappropriate defense.
  24. gallopingcamel writes: What is this "link dump" thing? I think apeescape was referring to the bunch of links that she/he included immediately below that line. It wasn't a remark about your own comment.
  25. apeescape (#43), It seems I misinterpreted your "link Dump". Please accept my apologies. Thank you Ned, once again. Scaddenp, it seems we are having communications difficulties. I will try to rephrase my arguments more clearly tomorrow when there is no Monday night football. While I am doing that, what is your opinion on Alley's temperature reconstructions for central Greenland? Plausible or not?

Prev  1  2  3  4  Next

Post a Comment

Political, off-topic or ad hominem comments will be deleted. Comments Policy...

You need to be logged in to post a comment. Login via the left margin or if you're new, register here.

Link to this page


The Consensus Project Website

THE ESCALATOR

(free to republish)


© Copyright 2024 John Cook
Home | Translations | About Us | Privacy | Contact Us