Gillett et al. Estimate Human and Natural Global Warming
Posted on 14 January 2012 by dana1981
In another new global warming attribution study (we will soon do an overview of the results of this and similar studies), Gillett et al. (2012) perform a number of interesting analyses. First, they estimate the contributions of various different components (both human-caused and natural) to the observed global warming. They also use their results to estimate the transient climate response (TCR), which refers to the global mean temperature change that is realised at the time of CO2 doubling in a scenario in which CO2 concentrations increase by 1% per year. In short, the TCR is an estimate of how much global surface temperatures will warm immediately, without needing to consider factors like the thermal inertia of the oceans. Gillett et al. then use their TCR estimate to project how much the planet will warm in the future based on several different emissions scenarios.
On the attribution question, the results of Gillett et al. are consistent with the many other attribution studies we've looked at (i.e. Lean and Rind 2008, Huber and Knutti 2011, and Foster and Rahmstorf 2011) - namely that humans have been the dominant cause of the global warming over the past 25-150 years (Figure 1).
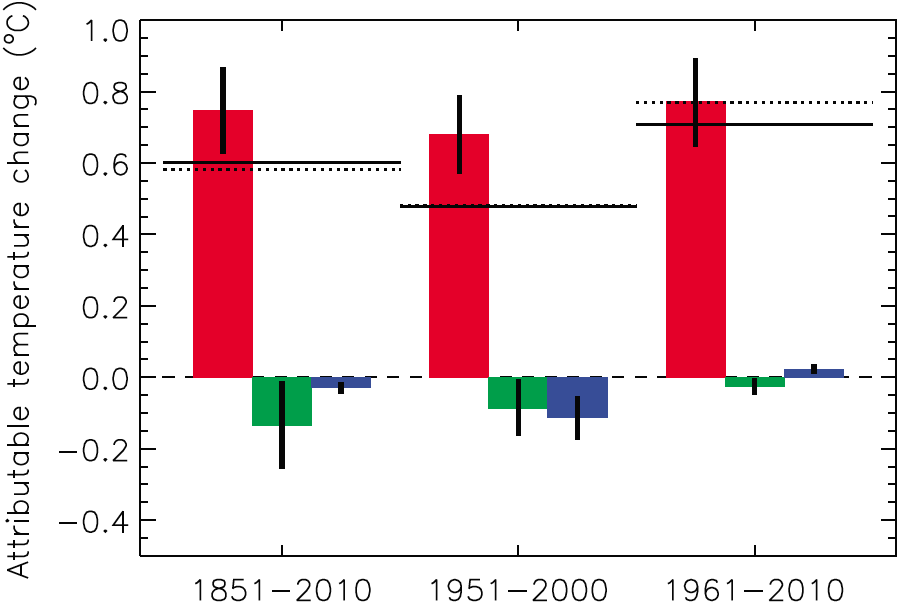
Figure 1: Gillett et al. attributable temperature changes due to greenhouse gases (red), other anthropogenic effects (green), and natural effects (blue) over each of the periods indicated in °C, based on the standard regression over the 1851–2010 period, with their associated uncertainties (vertical black lines). Horizontal dashed black lines indicate the sum of the trends attributable to each forcing, and horizontal solid lines indicate observed trends.
However, the conclusions of Gillett et al. with respect to the transient climate response are somewhat more unexpected, as we will see below.
Methods
Gillett et al. use new historical simulations and Representative Concentration Pathway (RCP) scenario simulations using the second generation Canadian Earth System Model (CanESM2) firstly to derive scaling factors on the greenhouse gas and aerosol forcing responses which give the best fit to observations over the historical period, and then to derive observationally-constrained projections of 21st-century temperature change. They use a regression-based method to scale the model-projected warming up or down according to whether it under- or over-predicts the response to anthropogenic forcings over the historical period.
"We use 1280 years of control simulation, with constant preindustrial forcings including constant specified CO2, and a five-member ensemble of historical simulations from 1850–2005 including prescribed historical greenhouse gas concentrations, SO2 and other aerosol-precursor emissions, land use changes, solar irradiance changes, tropospheric and stratospheric ozone changes, and volcanic aerosol (ALL), following the recommended CMIP5 specifications. We also use five-member ensembles of simulations with greenhouse gas changes only (GHG), volcanic and solar irradiance changes only (NAT), and aerosol changes only (AER) over the period 1850–2010."
For their future climate projections, Gillett et al. use five-member ensembles of scenario simulations from 2006–2100 with RCP 2.6, RCP 4.5, and RCP 8.5 emissions scenarios. The numbers in the emissions scenarios refer to the radiative forcing in 2100 in Watts per square meter (W/m2) relative to pre-industrial levels, from all human effects. For example, the RCP 4.5 scenario projects a 4.5 W/m2 radiative forcing in 2100 (for reference, a doubling of atmospheric CO2 alone corresponds to approximately 3.7 W/m2).
Attribution Results
As shown in Figure 1, in every timeframe examined, greenhouse gases account for over 100% of the observed global warming. When combined with the other human effects, the net human influence is responsible for approximately 102% of the observed warming from 1851 to 2010, and approximately 113% over the 50-year periods from 1951 to 2000 and 1961 to 2010 (averaged together). The natural contributions are -4.8% and -6.5%, respectively, in both cases having a net cooling effect. The model simulations of the various effects are shown in Figure 2.
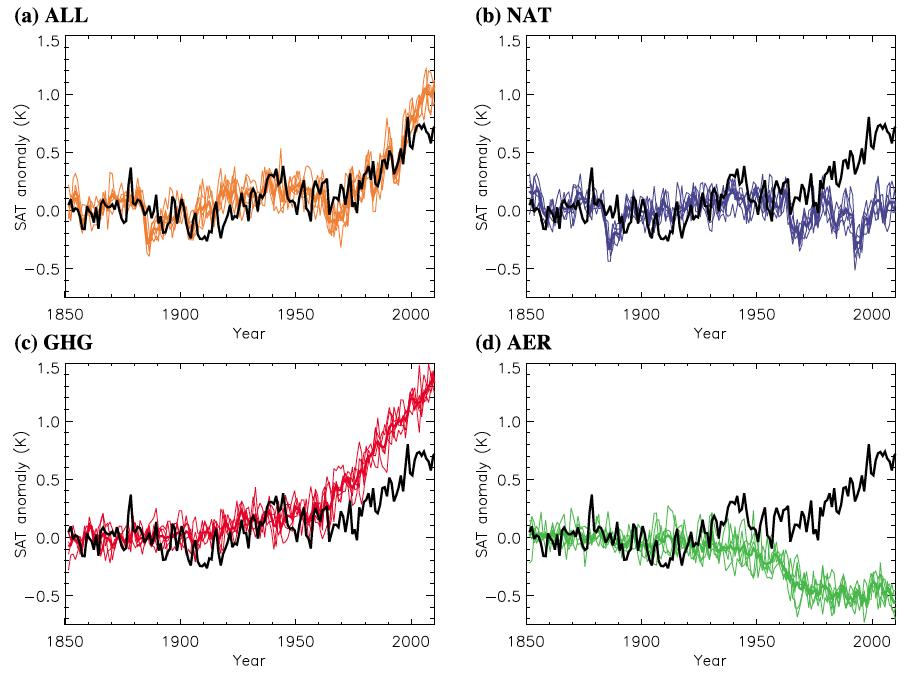
Figure 2: Gillett et al. time series of global mean near-surface air temperature anomalies in observations and simulations of CanESM2. Black lines show observed global mean annual mean temperature from HadCRUT3, and thin coloured lines show global mean temperature from five-member ensembles of CanESM2 forced with (a) anthropogenic and natural forcings (ALL), (b) natural forcings only (NAT), (c) greenhouse gases only (GHG), and (d) aerosols only (AER). All anomalies are calculated relative to the period 1851–1900, and ensemble means are shown by thick coloured lines.
One odd result of note, as can be seen in the solid horizontal black lines in Figure 1, is that Gillett et al. estimate greater net warming from 1851 to 2010 (approximately 0.6°C) than from 1961 to 2010 (approximately 0.7°C). Fitting a linear trend to the HadCRUT3 data from 1851 to 2010 yields a net warming of approximately 0.7°C (vs. approximately 0.68°C from 1961 to 2010). Dr. Gillett offered an explanation for this apparent discrepancy (personal communication) involving the following factors:
-
Their temperature trends are based on linear least-squares trends fitted to the observations, as opposed to differences between the beginning and ends of each period in question.
-
Gillett et al. use decadal averages of the temperature data.
-
The trends shown in Figure 1 above are based on a projection on spherical harmonics (instead of using the simple global average temperature, this process regresses simultaneously against each grid cell, thus preserving the correct spatial distribution of the field), and a limited number of empirical orthagonal functions, which could impact the results somewhat as well.
The result still remains counter-intuitive, and most other similar attribution studies (like those referenced above) generally estimate between 0.65 and 0.85°C warming over the past 100-150 years. The relatively low warming estimate from 1851 to 2010 in the Gillett study appears to influence their TCR results.
Transient Climate Response
Gillett et al. derive the TCR by using a regression-based method to scale the model’s projected warming up or down according to whether it under- or over-predicts the response to anthropogenic forcings over the historical period.
Given that Gillett et al. attribute essentially all of the observed warming to human influences, you would expect their study to yield a relatively high TCR. After all, the TCR is associated with the temperature change in response to increasing CO2, and Gillett et al. attribute essentially the entire observed global surface warming to the greenhouse gas increase.
However, as discussed above, Gillett et al. also attribute a relatively small amount of warming (~0.6°C) to that greenhouse gas increase. On the other hand, they attribute a relatively large surface warming (~0.7°C) to the greenhouse gas increase from 1961 to 2010. This results in different estimates for the TCR for different timeframes. Most notably, constraining the model with data from a timeframe excluding the earliest years (1901-2000) results in a higher TCR than using the 1851-2010 data (Figure 3).
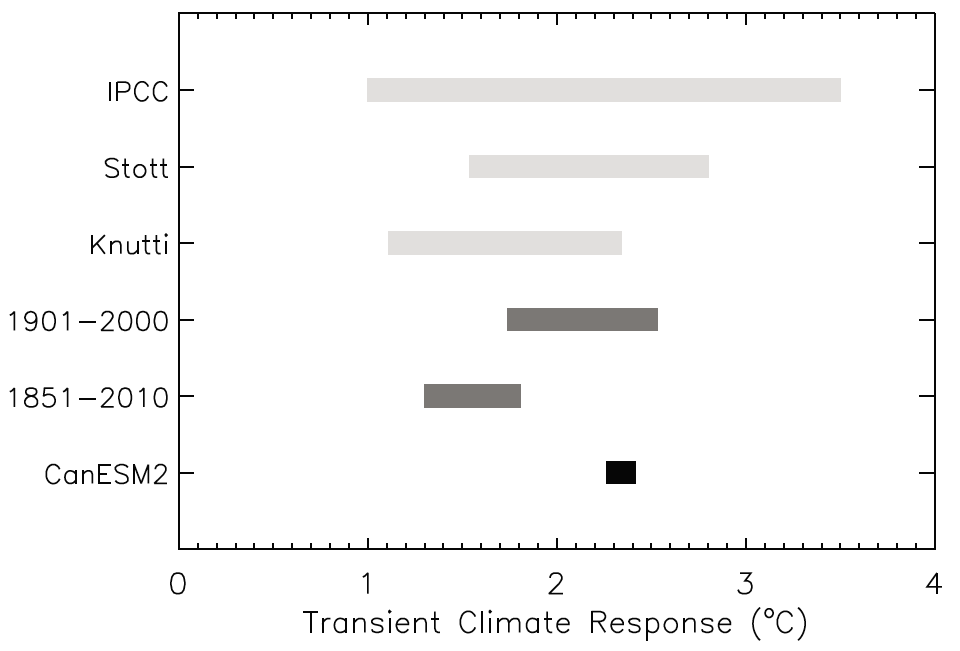
Figure 3: TCR directly simulated by CanESM2 (black), constrained by observations using the 1851–2010 and 1901–2000 regressions (dark gray), and derived from observational constraints by Stott et al. [2006] (Stott), Knutti and Tomassini [2008] (Knutti), and Hegerl et al. [2007] (IPCC) (light gray).
As Figure 3 shows, Gillett et al. find quite different TCRs using 1851-2010 and 1901-2000 timeframes. The former is towards the lower end of the IPCC range, whereas the latter is close to its central values. Gillett et al. comment on the difference (emphasis added):
"By contrast, when regression coefficients calculated over the shorter 1901–2000 period following [Stott et al., 2006] are used to scale projections, projected warming is larger and consistent with that directly simulated, illustrating the sensitivity of the results to the regression period used."
These differing TCRs also result in quite different projections of future warming (Figure 4).
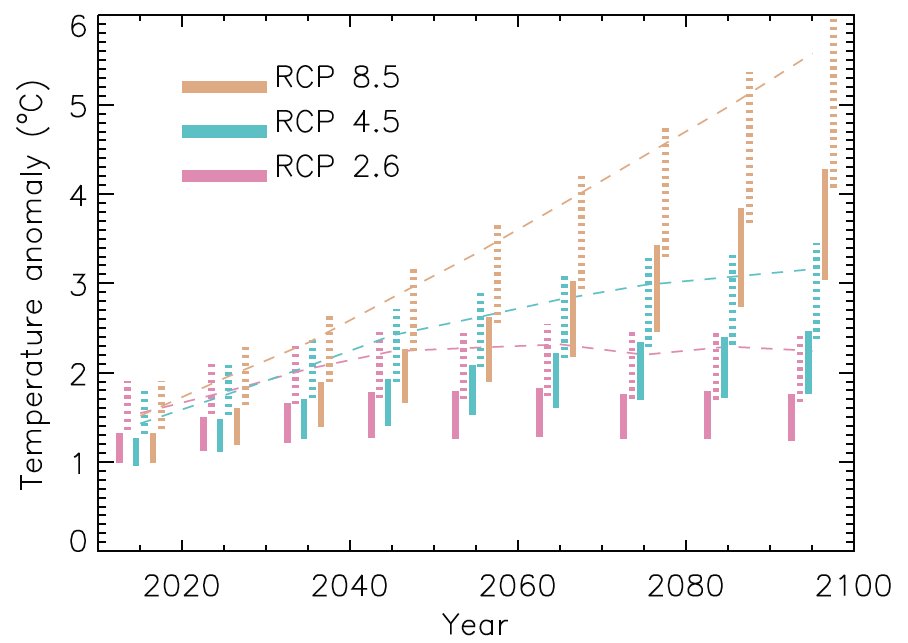
Figure 4: Gillett et al. temperature projections. Dashed lines show directly simulated global mean decadal mean temperature anomalies for each decade of the 21st century relative to the 1851–1860 mean for each RCP. Coloured bars show uncertainty ranges on observationally-constrained projections, derived by scaling projected GHG- and OTH-induced temperature changes using the 1851–2010 (solid) and 1901–2000 (dotted) GHG and OTH regression coefficients. All uncertainty ranges are 5–95%.
The dotted bars (which represent the model run when constrained by the 1901-2000 data) match the simulated projected temperatures (dashed lines) much more closely than the solid bars (based on the 1851-2010 regression). Note that this represents a transient response - Gillett et al. did not evaluate equilibrium climate sensitivity. It's also possible that a lower TCR would simply indicate a longer equilibrium response time.
Caveats and Conclusions
Gillett et al. warn against over-interpreting their results, which are based on just one model, and which are sensitive to the regression period used:
"We therefore recommend caution in interpreting the scaled projections derived from this single model, since our uncertainty estimates account only for possible errors in the magnitude of the simulated responses to the forcings, and not for possible errors in the observations, in the forcings, or in the spatio-temporal patterns of response to those forcings. We suggest that a similar analysis be carried out using multiple models once the necessary simulations are available, which will allow the effects of model uncertainty to be better accounted for."
This of course has not stopped the usual suspects from doing just that - over-interpreting and distorting the results of Gillett et al. However, this behavior will be the subject of another forthcoming blog post.
Given that there is greater uncertainty associated with the HadCRUT data prior to 1900 due to fewer stations and sparser global coverage, and that the TCR constrained by 1901-2000 data better matches the IPCC central TCR estimates, their higher TCR (approximately 1.7 to 2.5°C) seems more likely to be correct. Regardless, as with many attribution studies before them, Gillett et al. attribute the vast majority of the recent global warming to human activity.
Stay tuned for a summary and comparison of recent global warming attribution studies, including Gillett et al., and a blog post on the distortion of their results by certain fake skeptics.

Arguments


(-Snip-). What is presented in Gillett et al. Figure 3a are the results of the sensitivity of their regression weights to the time period chosen. If you were to show Figure 3a, then your readers would see that the regression coefficient for the GHG was pretty stable across time periods, with the exception of the 1901-2000 time period. The GHG regression coefficient (and thus TCR) is higher for the period 1901-2000 than it is when a more complete time period is used by either extending the data backwards to 1851 and/or forward to 2010. It is hard to argue, as you seem to want to do, from the results of Gillett et al. Figure 3a that the results from an intermediate data period (1901-2000) are superior to results using a more complete and up-to-date period of time.
(-Snip-)
-Chip Knappenberger
World Climate Report
[DB] Please refresh yourself with the Comments Policy.
Accusations of deception snipped.
Is this a serious problem? Dana's figure 3 includes both the 1851-2010 and 1901-2000 results for climate sensitivity.
And Dana's article points out throughout the uncertainties and mentions the sensitivity to time period choice.
I suspect that the choice of HadCRUT3 (which seems to lowball the warming, particularly in the decade 2000-2010) has something to do with it. Using GISSTemp, NCDC or an eventual global BEST product might bring the periods into better agreement. As would using periods of more complete global coverage (i.e. from sometime between 1870-1900 onwards)
The post quite clearly explains the reasons why there are legitimate concerns about the 1851-2010 regression results. For one they're based on the estimate that the surface only warmed 0.6°C over that period, which I think is a clear underestimate.
This is hilarious though, a (-snip-), Chip Knappenberger from world climate report (a PR lobby group that has doctored at least one other graph recently, on that occasion a graph by Dr. Urban and colleagues), now desperately tries to turn the tables by falsely accusing others of deception. He is trying to use a trick out of Karl Rove's playbook-- falsely accuse others of doing exactly what you are doing.
That may work on the gullible and misguided folks who follow "World Climate Report" but not us.
On a positive note, glad to see that Knappenberger is following SkepticalScience.
I'll write more later on how only by ignoring the body of evidence (by deleting/ignoring inconvenient data) could Michaels try and use Gillett et al. (2011) to try and claim vindication of their seriously flawed paper from 2002.
[DB] Everyone: No accusations of deception. Any accusations of deception, fraud, dishonesty or corruption will be deleted.
This applies to all parties.
"I suspect that the choice of HadCRUT3 (which seems to lowball the warming, particularly in the decade 2000-2010) has something to do with it. Using GISSTemp, NCDC or an eventual global BEST product might bring the periods into better agreement."
I agree. If one looks at the BEST data, one can see that global coverage prior to 1900 was pretty dismal, and we all know that even to this day HadCRUT has coverage issues , especially over the Arctic. It would have made more sense to use all three global surface temperature datasets from 1880, or a point in time when global coverage was deemed acceptable, especially if the purpose is to constrain the model. One cannot effectively constrain the climate model with poor data and/or for times when data coverage was poor.
The above data also show HadCRUT prior to 1880 likely being on the high side, while since then it has mostly been on the cool side compared to the other records.
Nevertheless, even HadCRUT seems in clear agreement that there was more warming 1851-2010 than 1961-2010, contrary to Gillett et al.
Dana1981 is telling a story from the Gillett et al. paper that he has in interest in (and which has a different emphasis than that of the original authors), and he providing that data which best illustrates his point. Others are free to argue that other data perhaps tells a different story. In our World Climate Report story, we too, preferred to highlight some portions of the Gillett et al. work. In our case, a portion of the Gillett et al. results that was highlighted by the original authors. Dana1981 is free to argue that there are additional aspects that we did not cover. The issue I have with dana1981 is the stridency of his comments at Watts Up With That concerning our article—ironic considering the contents of his post on Gillett et al. here.
-Chip Knappenberger
World Climate Report
But this will be a subject for Monday's post. Let's please focus on the science in Gillett et al. here.
Sure, as to the science. Gillett et al. performed a sensitivity analysis to see how their results were impacted by the time period selected. What they found, and what they showed in their Figure 3a (which was not in that part of all the data that you showed) was that their results were pretty similar when the temperature record was made more complete by either extending it backwards to 1851 or forward to 2010. It is only when using a time period (1901-2000) that neither starts at the beginning of the record (1851) nor extends through the end of the record (2010) that a higher TCR is inferred. The authors clearly think that the science (i.e., the sensitivity analysis) supports their opinion that the results from the full data record provide an improvement over previous results which used the 1901-2000 period—which runs contrary to your feeling that using the latter time period provides a result that “seems more likely to be correct”.
But, that said, and as you well point out, there is still much work to be done here and Gilllett et al. are the first to admit that this result is only a step along the way. However, its publication will probably not result in as much teeth gnashing behind the scenes as ours did (Michaels et al., 2002)—with similar results—a decade ago.
-Chip
Apparently Is Dr. Michaels is indeed not incapable of speaking for himself.
This is usually the point (in a world where ethics and morals reign supreme) when reasonable, ethical people sincerely and humbly apologize to Gillett et al. for doctoring a figure from their paper and thus also misrepresenting the authors' work/research.
But instead we have a bunch of weaseling and rationalizing and obfuscation going on. that says a lot as to their actual motives/intent.
Doctoring graphs is scientific misconduct and could be actionable by the journal in question.
This much is very clear, the only ones with an agenda here are World Climate Report, and it is an ideological, scientifically void agenda at that.
I am curious why they did not select a period from say 1900-2010, or 1950-2010 (periods when the global coverage was much more complete".
According to BEST (who use more data than do HadCRUT) in 1850, about 40% of the land surface was sampled, almost exclusively in the N. Hemisphere.
By 1880 the coverage had increased to almost 60%, with data also available for some of the S. Hemisphere land masses too.
By 1900 about 75% of the land surface was sampled.
By 1955 about 90% is achieved.
Michaels et al. (2002) was met with skepticism b/c it was a bad paper that should not have been published, but it was given a free pass by then editor Chris de Freitas (a denier), just as was Soon and Baliunas (2003). Between 1997 and 2003, de Freitas gave 14 papers from his "skeptic" pals free pass. Most of which were so flawed that they should not have seen the light of day, including Michaels et al. (2002). You can read more about this sad saga at "Skeptics Prefer Pal Review Over Peer Review: Chris de Freitas, Pat Michaels And Their Pals, 1997-2003"
It seems that the World Climate Report are now trying to invert reality.
And again, Gillet et al. does not vindicate Michaels et al. (2002) and I bet that Gillett et al. would confirm that if asked.
Albatross @12 - Gillett wanted to have comparable results to previous studies, so they used similar timeframes as in previous work. 1851-2010 is similar to the IPCC 2007 (but extended to more recent years), and 1901-2000 I believe is the timeframe used by Stott (2006). I wish they had shown the projection using the 1901-2010 timeframe, and I also wished they had used multiple data sets, rather than relying solely on HadCRUT, which we know has a cool bias. But that's the reasoning behind their timeframe selections.
You ask "I am curious why they did not select a period from say 1900-2010, or 1950-2010 (periods when the global coverage was much more complete".
From Gillett et al.:"Figure 3a shows that similar GHG
regression coefficients to those derived over the period
1851–2010 are obtained either over the period 1851–2000 or
1901–2010."
In other words, when they used 1901-2010 they get much the same answer when it comes to GHG as when they used 1851-2010. The odd man out was the analysis using only data from 1901-2000 (dana1981's preference).
-Chip
We don't know what the projections would look like using the 1901-2010 coefficients, and assuming that "they get much the same answer" (which Gillett et al. do not state) just because the coefficients are "similar" is unwarranted.
Yes, WCR is entitled to their own opinions, but not their own facts and having their own opinions certainly does not entitle them to doctor scientists' graphics!
"Dana1981 is telling a story from the Gillett et al. paper that he has in interest in (and which has a different emphasis than that of the original authors), and he providing that data which best illustrates his point."
Not true, as evidenced by the OP, and a strawman to boot. Trying to equate a summary article of the entire paper with a distorted, one-sided misrepresentation of the paper which included a doctored graph is offensive not to mention [snip]
There is a very clear pattern of deliberate attempts to mislead and misinform by the WCR. well, either "deliberate" or they have no clue how to properly undertake science and report on science.
You say:
“We don't know what the projections would look like using the 1901-2010 coefficients, and assuming that "they get much the same answer" (which Gillett et al. do not state) just because the coefficients are "similar" is unwarranted.”
Well, while we may not know quite what the projections would look like (it would probably take a bit more digging), when it comes to the TCR (a key to the magnitude of coming climate change), we can be pretty certain that the results from 1901-2010 would be similar to those from 1851-2010 because Gillett et al. indicate that the TCR is largely derivable directly from the GHG coefficient (and the size of its uncertainty…both quantities appear quite close from the 1851-2010 and the 1901-2010 time periods…see their Figure 3a):
“The GHG regression coefficient may also be used to estimate the Transient Climate Response by scaling the temperature response at the time of doubling CO2 (averaged between the year 60 and 80) in a simulation with a 1% increase in CO2 per year following Stott et al. [2006].”
-Chip
The TCR is determined only by the GHG coefficient. The temperature changes (i.e., the “projections”) for the 21st century are dependent on the TCR and the emissions pathways (and thus both the GHG and the OTH coefficients are required).
So, as I said in my last comment, we “can be pretty certain” that the value of the TCR would be similar whether calculated using the temps from 1851-2010 or 1901-2010 (since the GHG coefficients are quite similar). As to how global temperatures progress over the 21st century, it is harder to say without more digging into the details of the scenarios used by Gillett et al. coupled with the impact of the changes in the OTH coefficient.
Right?
-Chip
Fair enough. And thanks for the discussion.
-Chip
"Our analysis also leads to a relatively low and tightly-constrained estimate of Transient Climate Response of 1.3–1.8°C, and relatively low projections of 21st-century warming under the Representative Concentration Pathways."
"These estimates of TCR are consistent with previously derived ranges (grey bars) [Hegerl et al., 2007; Knutti and Tomassini, 2008; Stott et al., 2006], though our ranges are more tightly constrained, in part because they are derived from a single model with relatively low multidecadal variability and do not account for model uncertainty"
So there is no serious conflict or challenge to the data reported in the IPCC's AR4.
In section 10.5.2 of AR4 they state:
"Fitting normal distributions to the results, the 5 to 95% uncertainty range for equilibrium climate sensitivity from the AOGCMs is approximately 2.1°C to 4.4°C and that for TCR [transient climate response] is 1.2°C to 2.4°C (using the method of Räisänen, 2005b). The mean for climate sensitivity is 3.26°C and that for TCR is 1.76°C."
Now the important part, the "skeptics" are trying to suggest the range of TCR found in Gillett et al. (2012) shows that equilibrium climate sensitivity is much lower than the mean value of +3 C reported in AR4 and that consequently the expected warming for doubling CO2 will be much lower than previous estimates. However, even if one selects the lower range for TCR estimated by Gilett et al. (1.3 to 1.8) the median value for TCR for the models discussed in AR4 lies in that range at 1.65 C. Moreover, the median EQS for those models eight models having a TCR lying within Gillett et al's lower range is ~2.85 C.
So mean TCR of the IPCC AR4 models lies within lower range estimated by Gilett et al. and those models predict a mean EQS of almost +3 C.
Now this all assumes that we will only double CO2, if we continue with BAU as Michaels and his oil lobby friends are advocating then we could treble even quadruple CO2 by 2100, and then even using Gillett et al's most conservative estimates for TCR, the warming by 2100 (before equilibrium has been achieved) could range between about 3.1 and 4.3 C.
I fail to see where the reason for optimism from the climate "skeptics" is stemming from. Gillett et al. is not a vindication of Michaels et al. (2002) and it is certainly not an excuse to advocate continuing with business as usual.
How much of TCR is realised in 1 yr, 5 yrs, 10 yrs etc?
TCR is defined here.
Feedbacks take time to 'happen' and stabilise, and this time depends on the feedback: the water cycle feedback should be reasonably quick (reacting within years), but the carbon cycle feedback and the change of albedo from retreating ice sheets should be slower.
The TCR is defined as the heating if you increase CO2 through time, and then take the change in temperatures at the decades CO2 doubles. It will be bigger than the 'no feedbacks' climate sensitivity because it'll take over a hundred years to double CO2, and the feedbacks will have had time to react to the first burst of warming. But it's plenty smaller than the final equilibrium sensitivity because the Earth hasn't had time to properly react to the latest warming.
Since there is much more land in the Northern Hemisphere and there has also been more warming in the North, this technique results in an underestimation of the global land warming trend, and isn't a proper comparison with the other records. This discrepancy isn't present in the land-ocean data because the oceans plug in the gaps.
The main source of the lower warming from 1851-2010 is, as Gillett states, the use of a linear regression across the period when making the calculation. The implications of this can be seen in these graphs: the 1961-2010 is well-represented by a linear trend so almost all the temperature change is captured. However, the 1851-2010 is not so well-represented. In particular, the warming over the past 20-30 years is chopped off.
As a sensitivity study I did the same thing with GISS (1961-2010 and 1881-2010 - HadCRU 1881-2010 is featured in the previous image). It turns out that HadCRU produces a slightly larger amount of warming both between 1881-2010 and 1961-2010.
Did Gillett et al. discuss the HadSST3 changes? Seems to me many of the figures mentioned here will be altered by it's forthcoming inclusion in a new iteration of HadCRUT.
On the BEST-Hadcrut comparison: I've swapped a couple of emails with the BEST team on this. They did not make the mistake of using the CRUTEM3 values directly, which as Paul points out is the mean of the hemispheric averages. Rather they used 0.68*NH+0.32*SH, which is pretty close to a land-area average - you can check this and reproduce their plot down to the nearest pixel. Alternatively, you can calculate a true land-area average by simply downloading the CRUTEM3 gridded data and doing an area weighted average: This is virtually indistinguishable to the weighted hemisphere method shown in the BEST figure after about 1920.
However, this is still not a valid comparison to BEST, as the BEST team and myself have independently concluded. The reason is that the large 5x5 degree cells used by CRUTEM3 include a significant number of cells with mixed land/ocean. The CRUTEM3 average gives these cells the same weight as land-only cells. If the cells are properly weighted according to the proportion of land in that cell, the coastal cells are downweighted, and the divergence between CRU and BEST is significantly reduced. Here is what the comparison with the land-masked CRU (and NOAA) looks like once this correction is made:
CRUTEM3 still drops off after 2000, but the dramatic difference is eliminated.
"The BEST graph shows land-only temperatures, where differences are mainly caused by spatial processing idiosyncrasies."
You are of course correct. To be honest I was in a rush and grabbed the BEST graphic because it was easily accessible.
The fact (and my point) remains that the uncertainties in the global surface air temperature (SAT) data increase as one goes back in time, especially prior to 1880. Here is what I should have shown
There are more colourful images here in Brohan et al. (2006).
Additionally, while land surface stations was an issue, as I noted in a post, that also applies to SST observations in the early part of the record, perhaps even more so.
Hadley has just released its SST3 product and HadCRUT4 (an update)is available (although not widely at this point). In the latest version they use SST3 and they address some of the low sampling issue at high northern latitudes where marked warming has been taking place.
Having had some experience optimizing numerical models I would every time choose a smaller but more reliable sample than a longer but less reliable sample set. That was my issue with them including data prior to 1880 to try and constrain the model. I honestly do not think one can effectively do that given the large uncertainties present in the observations back then. Also, why limit yourself to one global SAT product when there is GISTEMP and NCDC out there as well.
they did look at 1901-2010 but unfortunately did not show the results for the adjusted/scaled projections using the regression coefficients for that period, nor did they show the estimated TCR estimated for that period (IIRC).
Isn't highly likely that ALL of the significant recent warming is due to human activity. Surely.
Why wouldn't it be. What else would contribute to a significant warming?
The land-masked CRU index does show substantial divergence from the BEST data over the last decade, if you look at the 12 month or even 60 month running means. In particular CRU gives substantially different results for any trend you calculate starting since 1998.
However the differences are largely ironed out by the 120-month running mean. I suspect therefore that any calculation using the whole run of the data, such as the one described in this article, will be minimally affected by the choice of temperature data.
(When I first started look at this a few months back you suggested adjusting the coverage the different gridded datasets to get an accurate indication of the effect of poor sampling in CRUTEM3 and ultimately HADCRUT. That was a good idea, since it is very simple and factors out all the complex issues of baselines and so on. I'm hoping to have the results in a week or two.)
Paul Magnus - there could be a small natural contribution to the warming (solar and/or volcanic). Gillett found a very small natural contribution from 1961 to 2010.
Now, Skeptical Science has posted another summary of another study on this matter — human versus natural causes of global warming. This summary is on a new paper just published in 2012.
This is what Dr. Annan had to say about Gillett et al:
"This new [linking to Gilett et al.] paper also suggests that the transient response of a modern model (albeit a particularly sensitive one) has to be significantly downscaled to match observations. Mind you, that paper also has a worrying discrepancy between the results obtained with 1900-2000, versus 1850-2010 data. Normally one would expect the latter to be broadly a subset of the former - more data means closer convergence to the true value - but the two sets of results are virtually disjoint, which suggests something a bit strange may be going on in the analysis (cf Schmitter et al with the land-only versus land+ocean results). But just a glance at the first figure shows a striking divergence between model and data over the first decade of the 21st century (compared to the close agreement prior to then). Something isn't quite right there."
[Source]